


The bitcoin (BTC) price has been decreasing since June 29 and has reached the support line of an ascending wedge.
Technical indicators and the price movement provide a bearish outlook, suggesting that a breakdown from the wedge is expected.
Bitcoin descends toward support
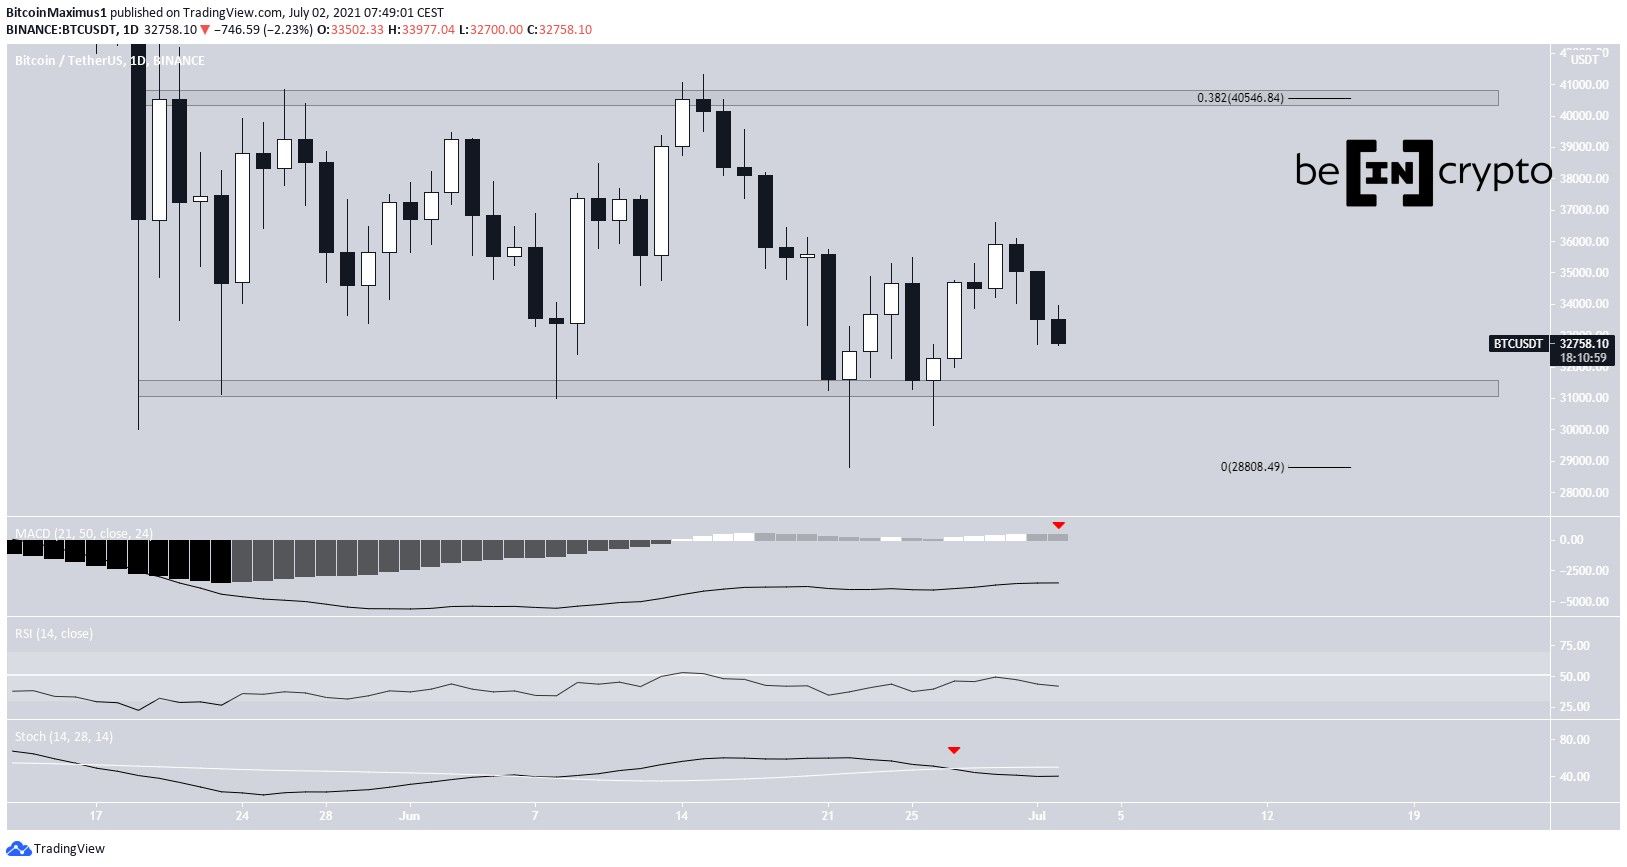
BTC had been moving upwards since June 22. At the time, it had reached a low of $28,805. The ensuing bounce caused it to reclaim the $31,400 horizontal support area.
On June 29, BTC reached a high of $36,600 before falling sharply. It’s currently trading near $32,800.
Technical indicators in the daily time frame are bearish. The MACD is close to giving a bearish reversal signal (red icon) and its signal line is below 50. The RSI is below 50 and decreasing while the Stochastic oscillator has made a bearish cross.
The main resistance area is found at $40,550. This target is a horizontal resistance level and the 0.382 Fib retracement level.
Ascending wedge
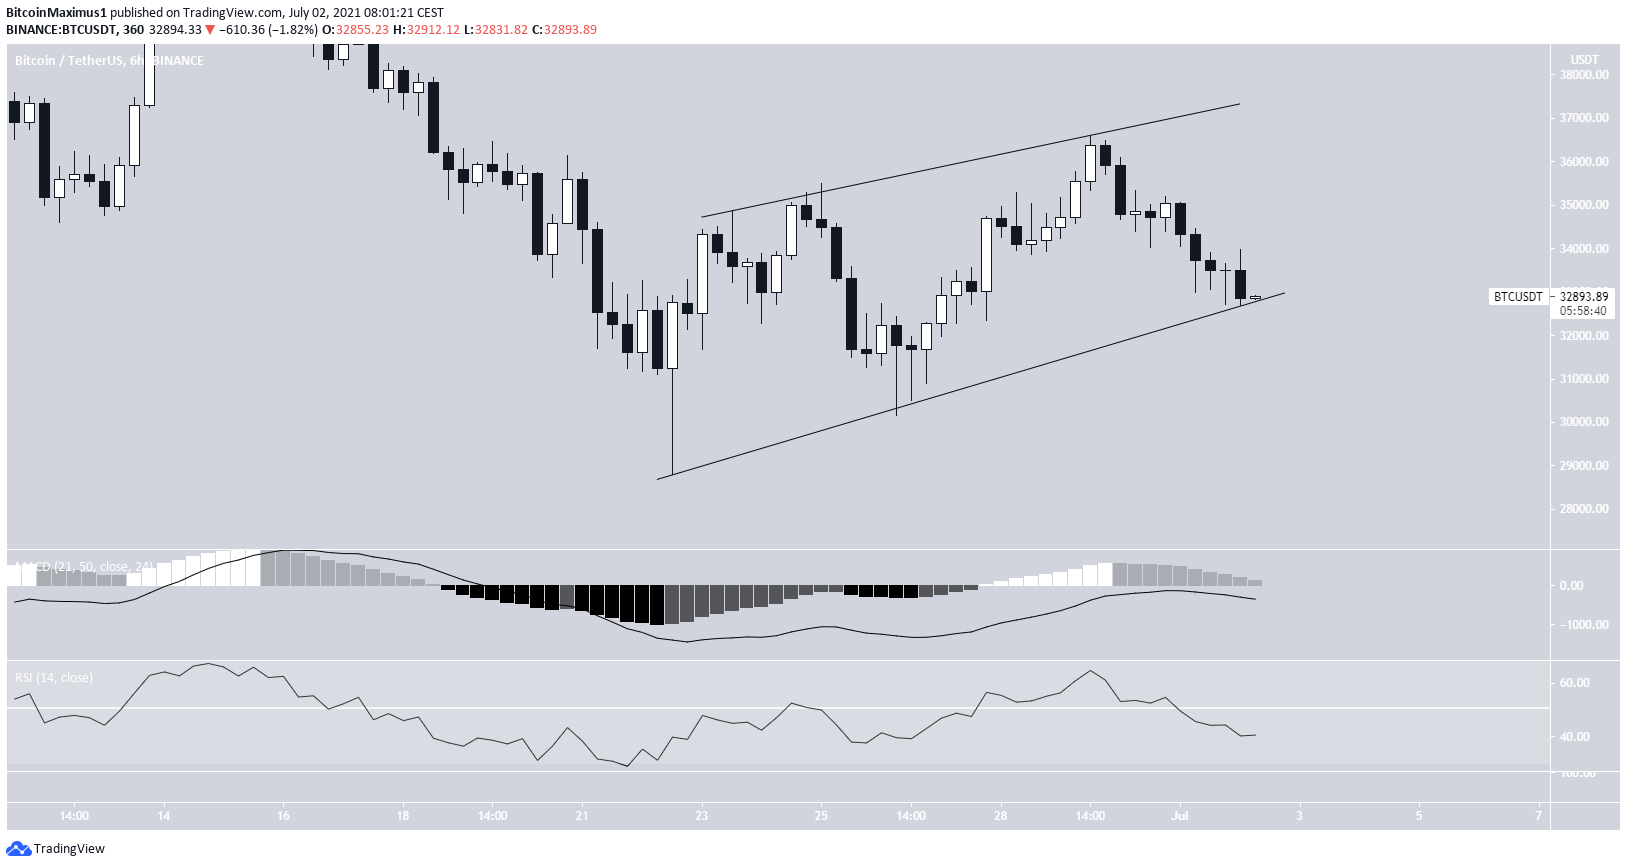
The six-hour chart shows that BTC could be trading inside an ascending wedge since the aforementioned June 22 low.
The price is currently right at the support line of the wedge, which is often considered a bearish pattern.
Both the MACD and RSI have turned bearish, supporting the possibility of a breakdown.
If so, BTC would likely revisit the previously outlined $31,400 horizontal support area and could potentially go lower.
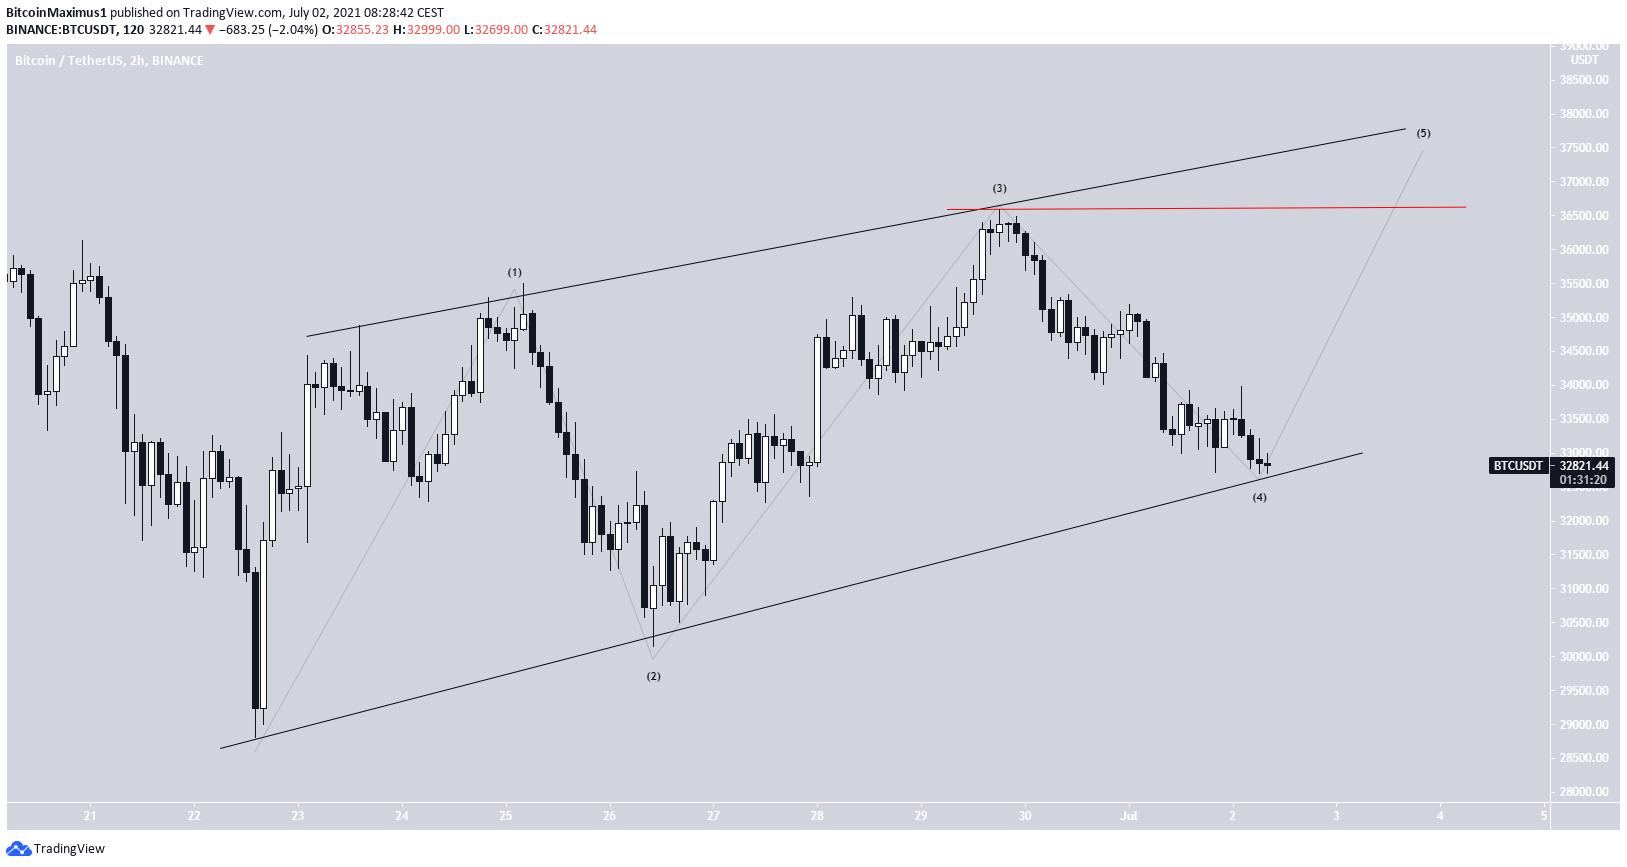
BTC Wave count
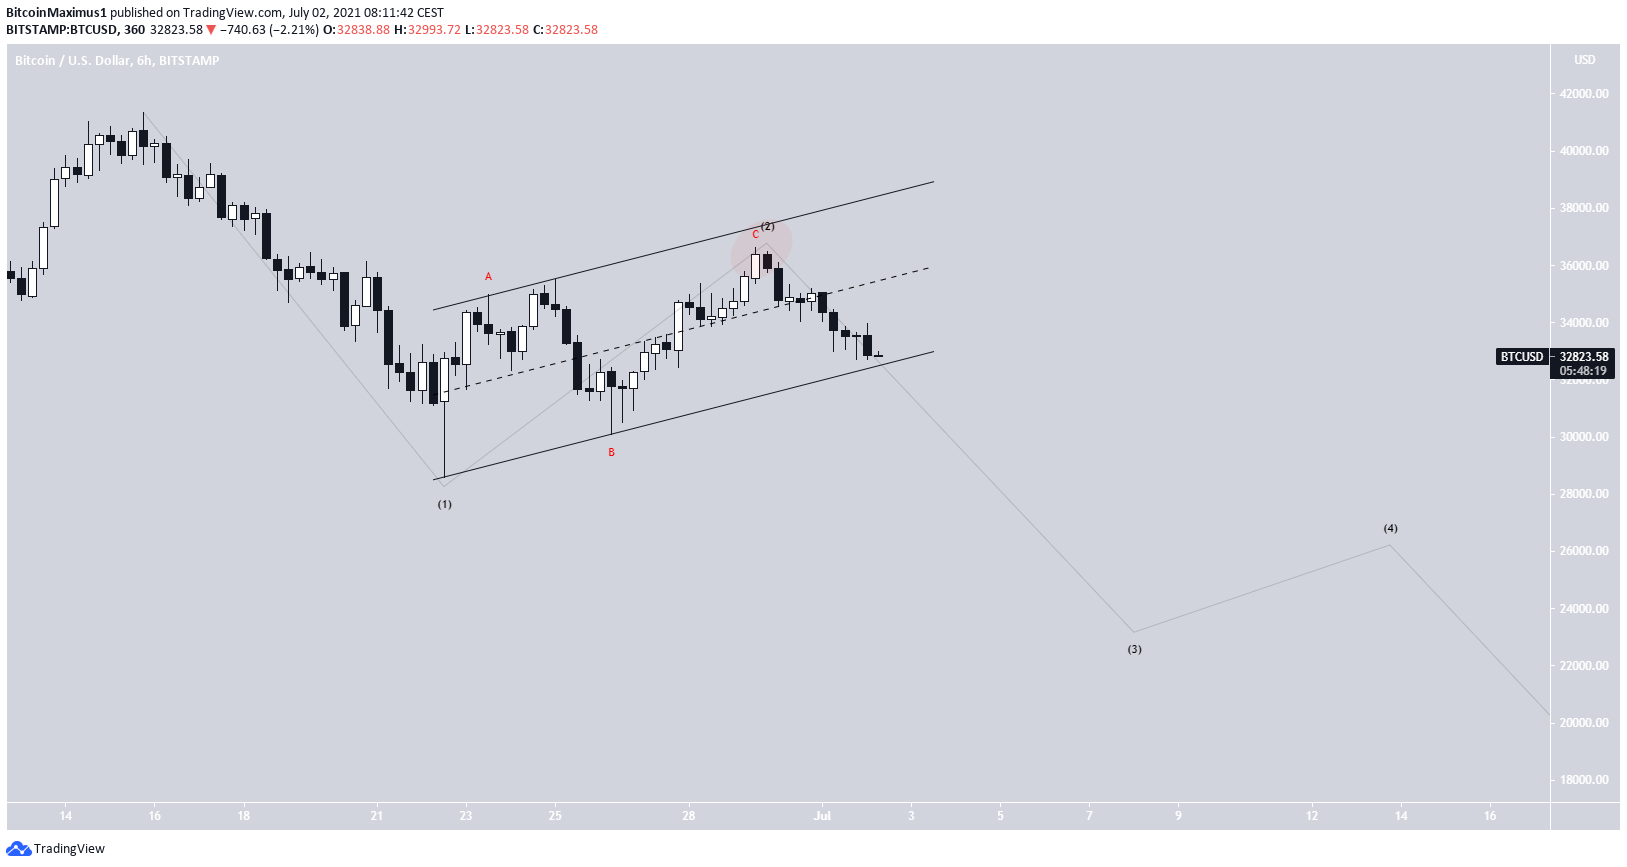
If the upward movement since June 22 is corrective, the top failed to even reach the resistance line of the channel (red icon). This created the previously outlined wedge formation and is a decisive sign of a lack of strength in the movement.
A breakdown from the channel would likely confirm that BTC is heading to test lower supports.
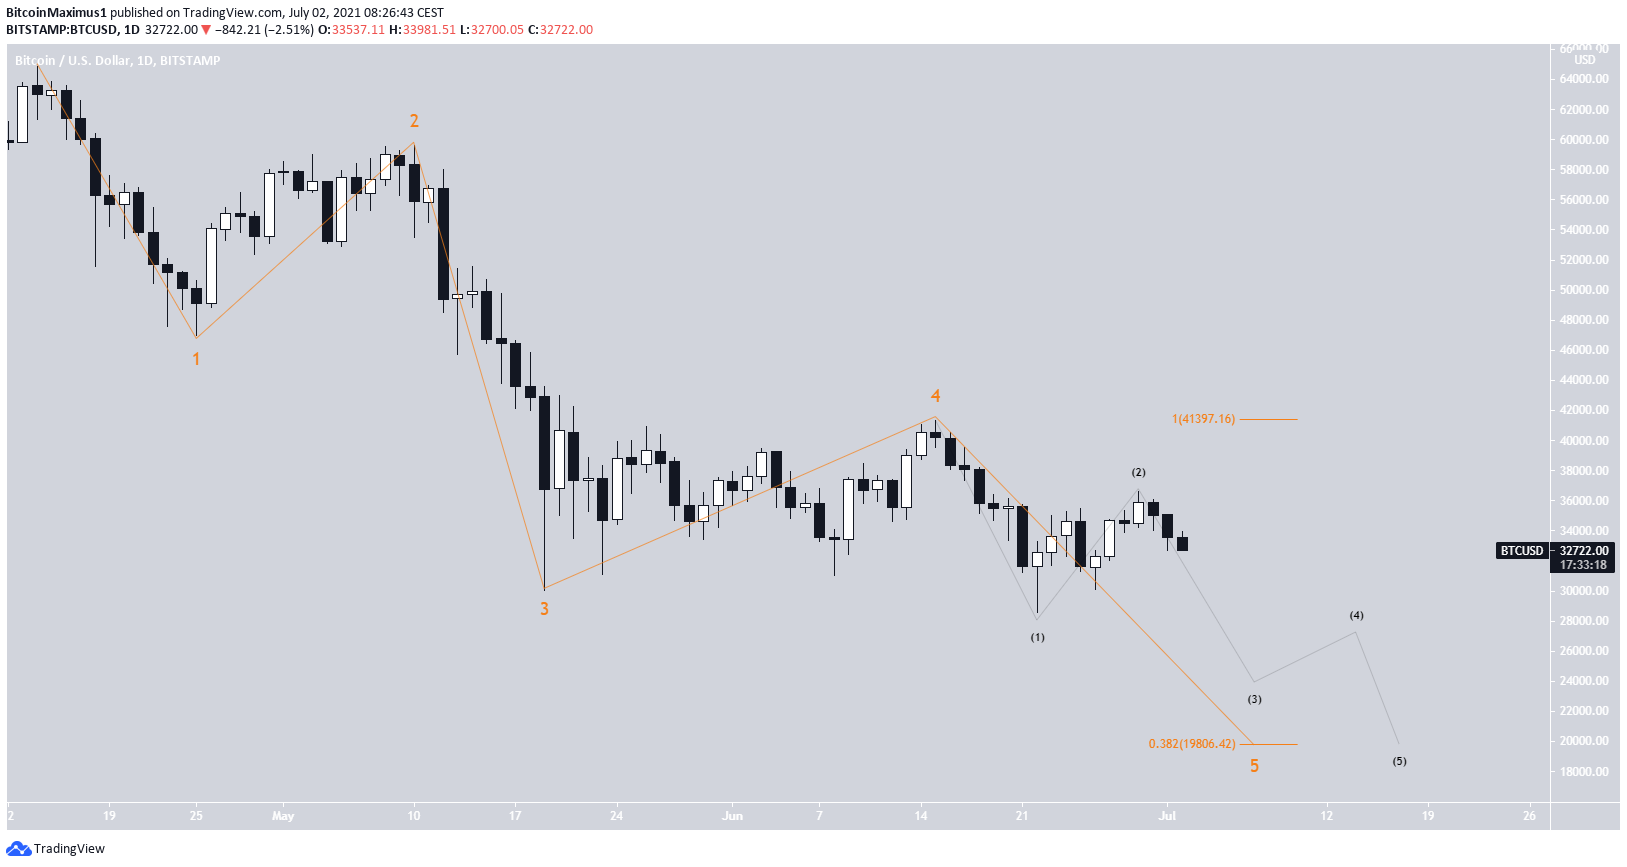
A potential target for the bottom of the entire downward movement would be found near $19,800. This target is a Fib projection on waves 1-3 (orange).
Alternate count
An alternate count suggests that the movement since June 22 is a leading diagonal. In this case, the previously outlined wave five ended on June 22. In order for it to remain valid, BTC would have to rebound almost immediately.
This would be confirmed by an increase above the June 29 high of $36,600.
Nevertheless, a decrease would likely follow after the pattern is complete, causing a breakdown from the wedge and eventually a higher low.
For BeInCrypto’s previous bitcoin (BTC) analysis, click here.


