


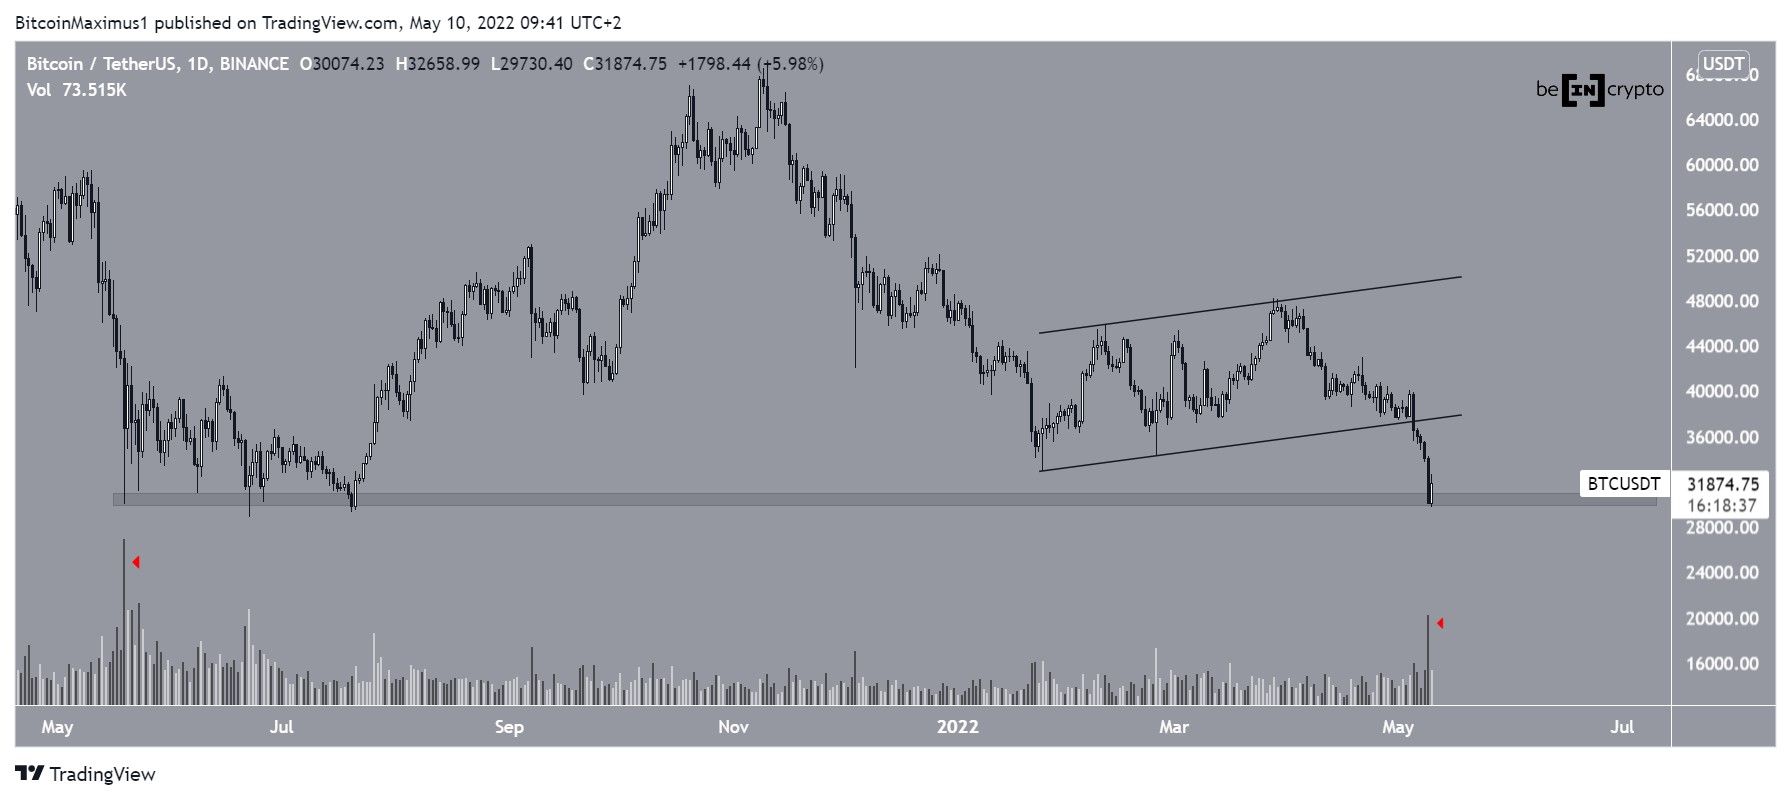
Bitcoin (BTC) bounced after reaching a low of $29,730 on May 10, validating the $30,500 horizontal area as support.
Bitcoin had been increasing inside an ascending parallel channel since Jan. 24. Both the resistance and support lines of the channel were validated numerous times, until the price finally broke down on May 5.
BTC reached a local low of $29,730 on May 10 and rebounded afterward, validating the $30,500 horizontal area as support. This area has not been tested since July 2021.
An interesting development is that the volume on May 9 was the highest in nearly a year, more specifically, the highest since May 19, 2021 (red icon).
Future BTC movement
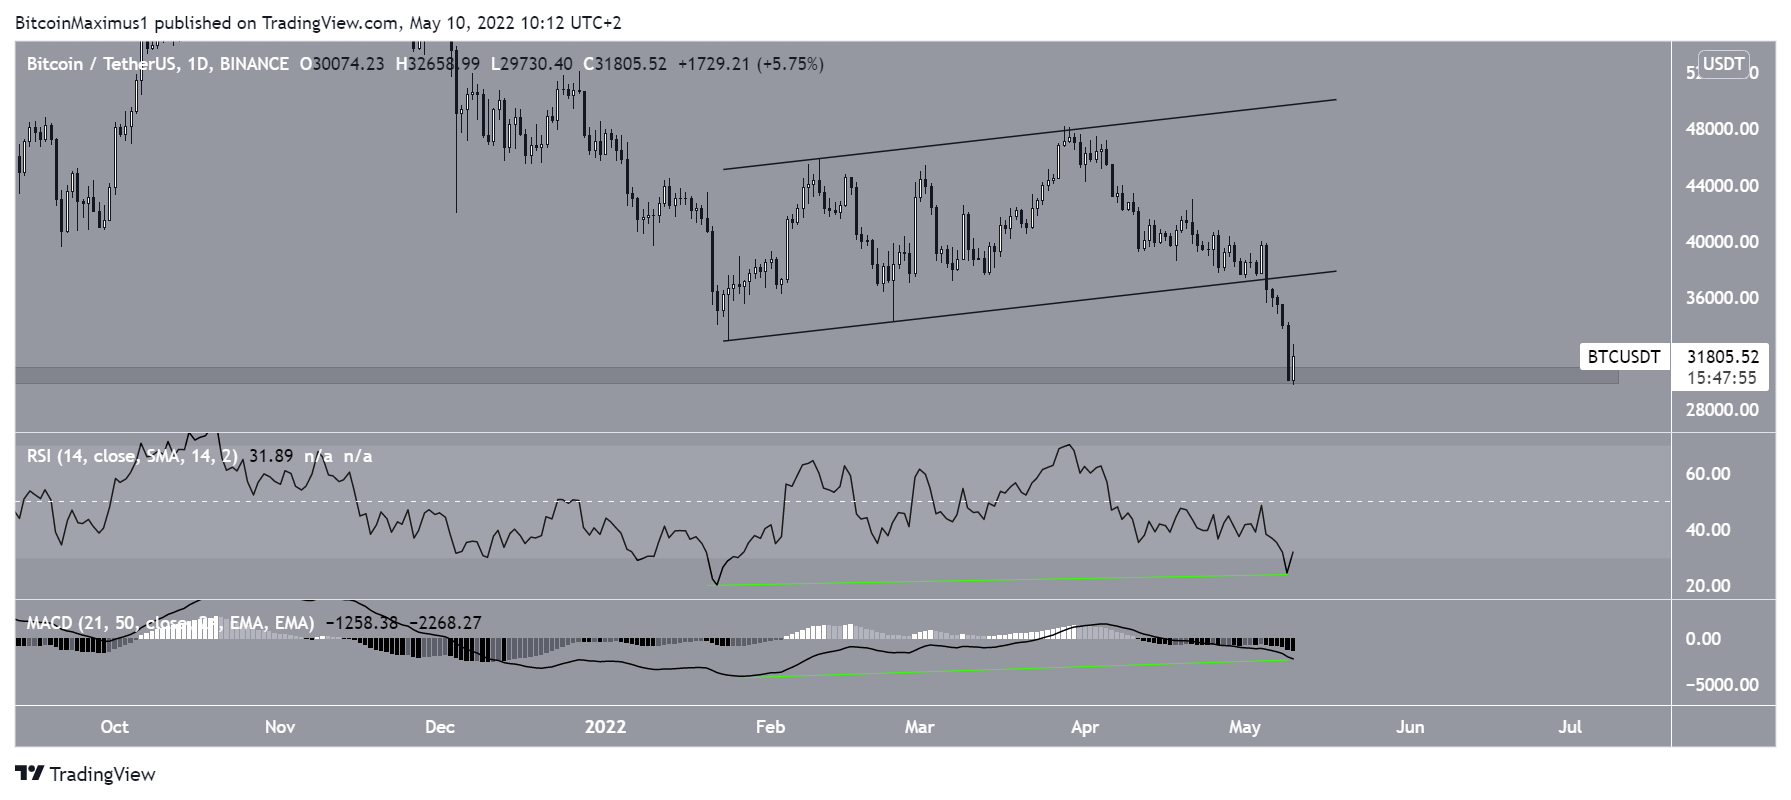
Technical indicators in the daily time frame are bearish, even though they are showing oversold conditions. The main reason for this is that both the RSI and MACD are falling. The former is below 30 and the latter is well into negative territory.
While both indicators have generated bullish divergences, they have not been validated yet, and could be negated with a continued decrease.
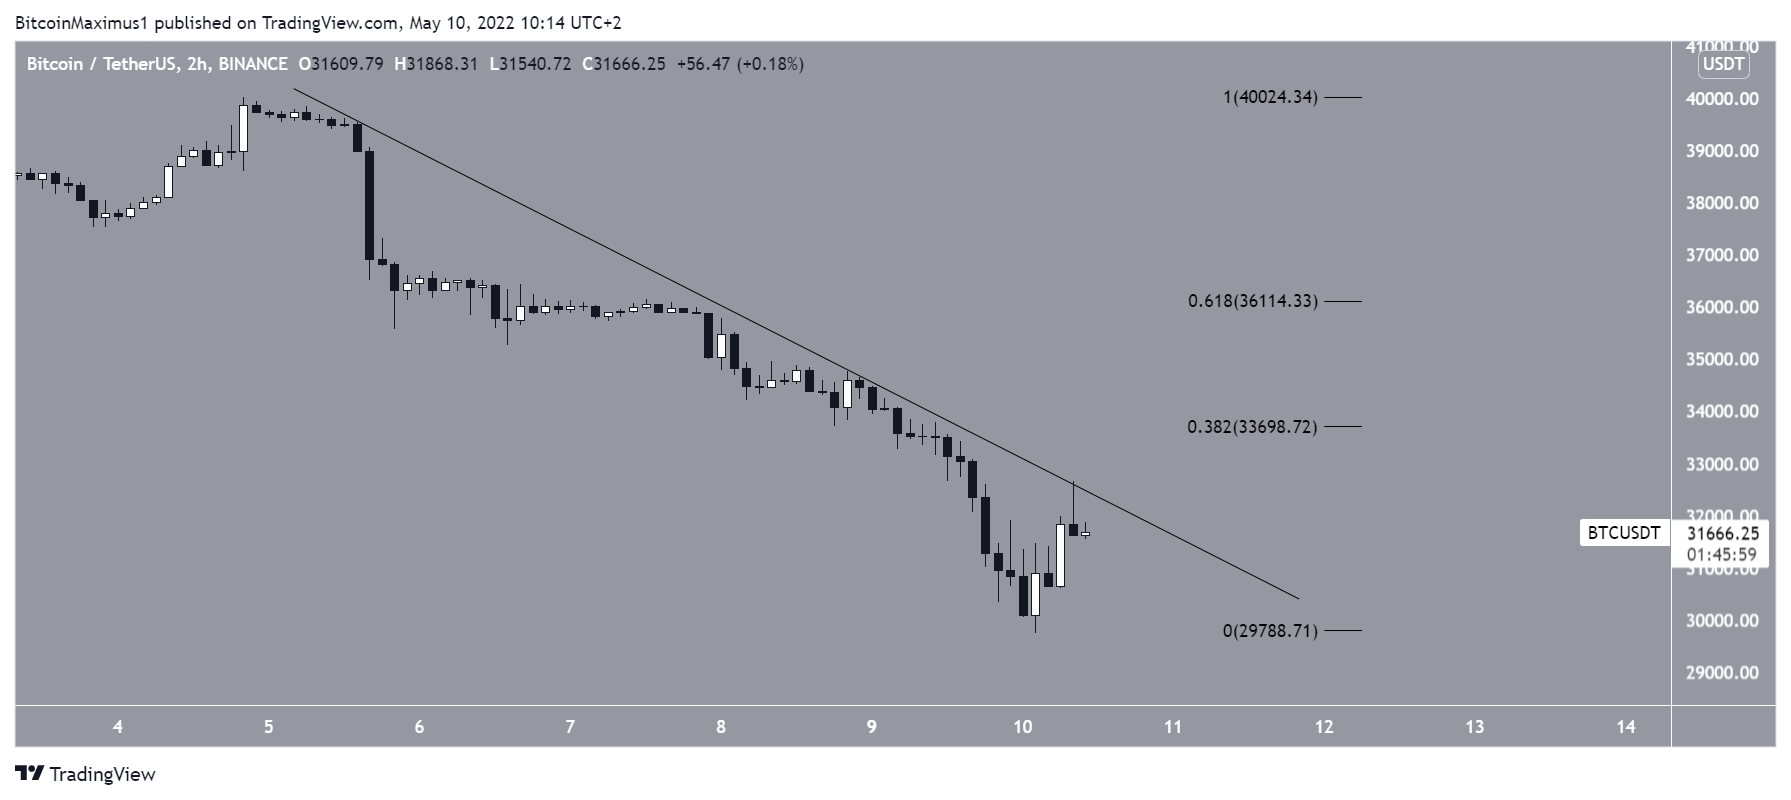
The two-hour time frame shows that BTC has been trading beneath a descending resistance line since May 5.
If a breakout from the line occurs, the next closest resistance levels would be found at $33,700 and $36,100. These targets are the 0.382 and 0.618 Fib retracement resistance levels, respectively.
Wave count analysis
The most likely wave count suggests that BTC has been in a long-term corrective phase since reaching an all-time high of $69,000 on Nov. 10, 2021.
If true, it’s currently in wave C of an A-B-C corrective structure (red). The sub-wave count is shown in black in the chart below.
The first potential target for the bottom of the movement is found at $25,700. This target would give waves A and C a 1:0.61 ratio.
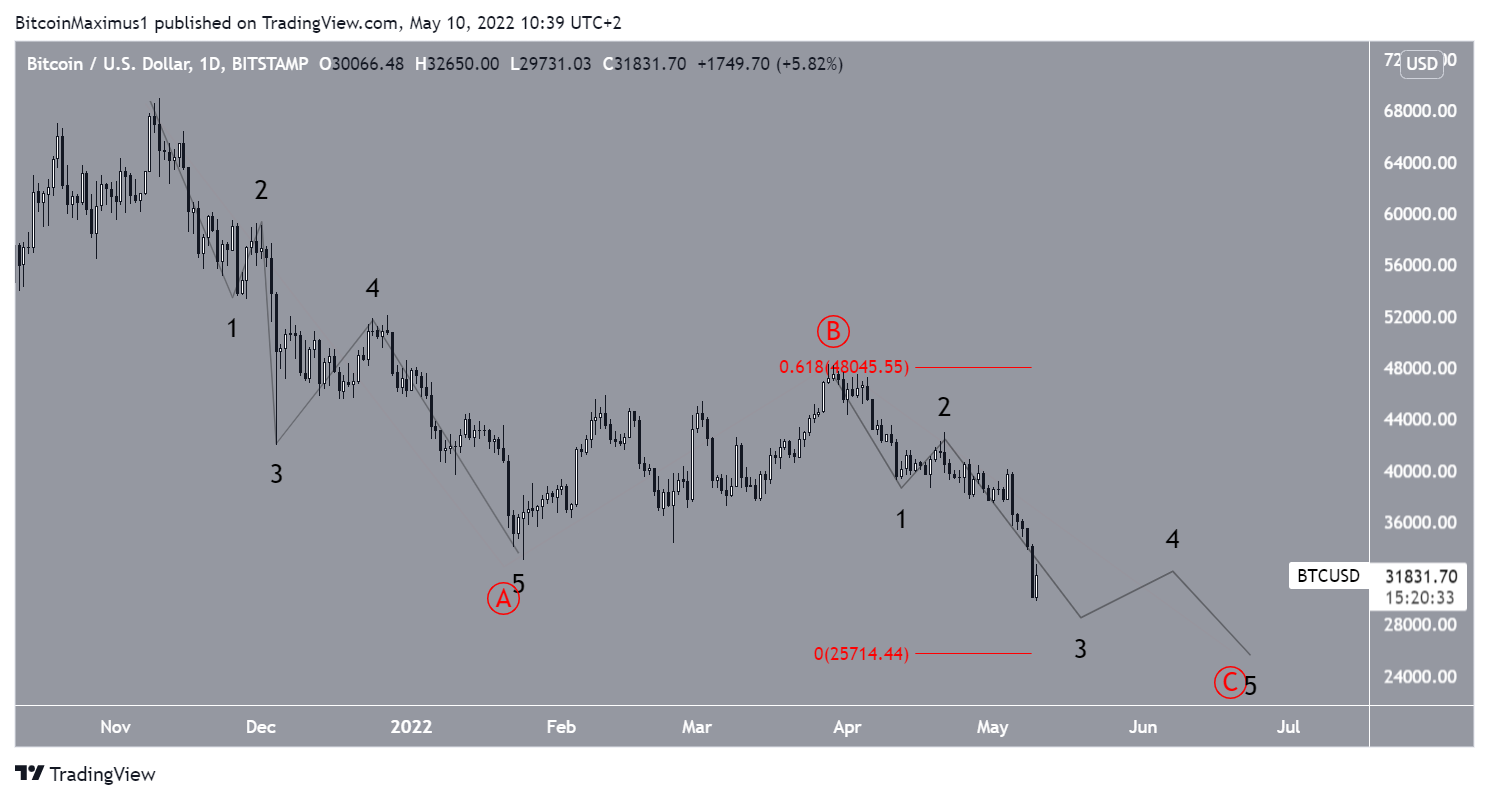
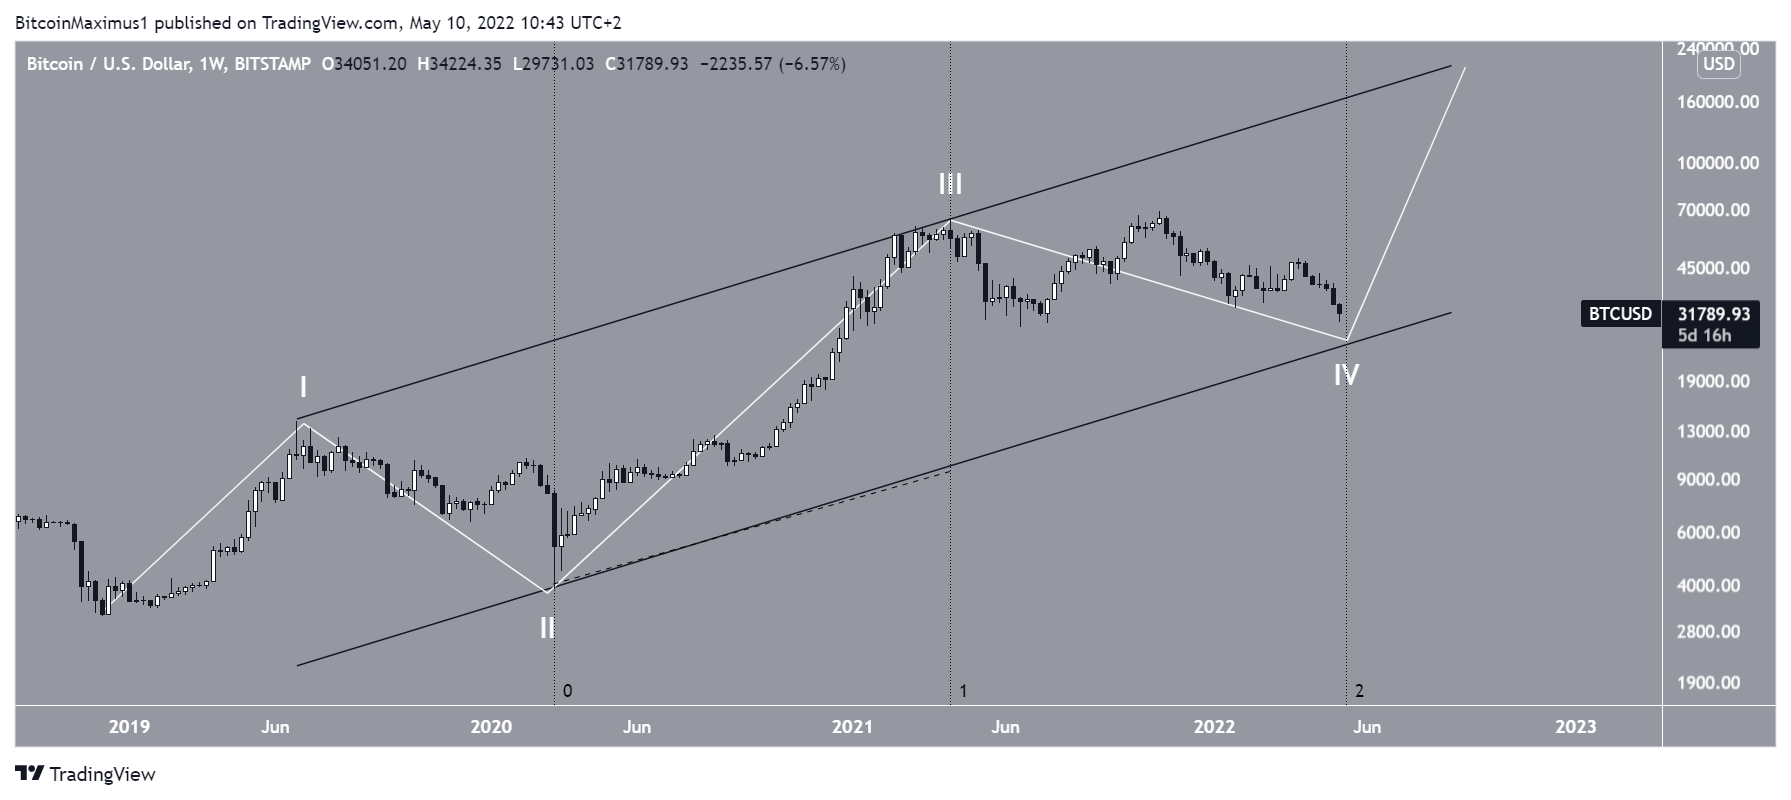
The longer-term wave count still suggests that the ongoing decrease is part of wave four (white) of a five-wave upward move that began in December 2018.
It also provides more confluence at the $26,000 level. This area coincides with an ascending parallel channel that connects the highs and lows of wave one, two, and three.
Finally, if the bottom is reached within the next two weeks, waves three and four would have the exact same time length.
For BeInCrypto’s previous Bitcoin (BTC) analysis, click here


