


Bitcoin (BTC) has been decreasing since June 29 and created a lower high on July 5.
BTC is currently trading inside two short-term parallel channels, and has already bounced at their support lines. A breakdown from these channels would be an extremely bearish development.
Bitcoin trading range
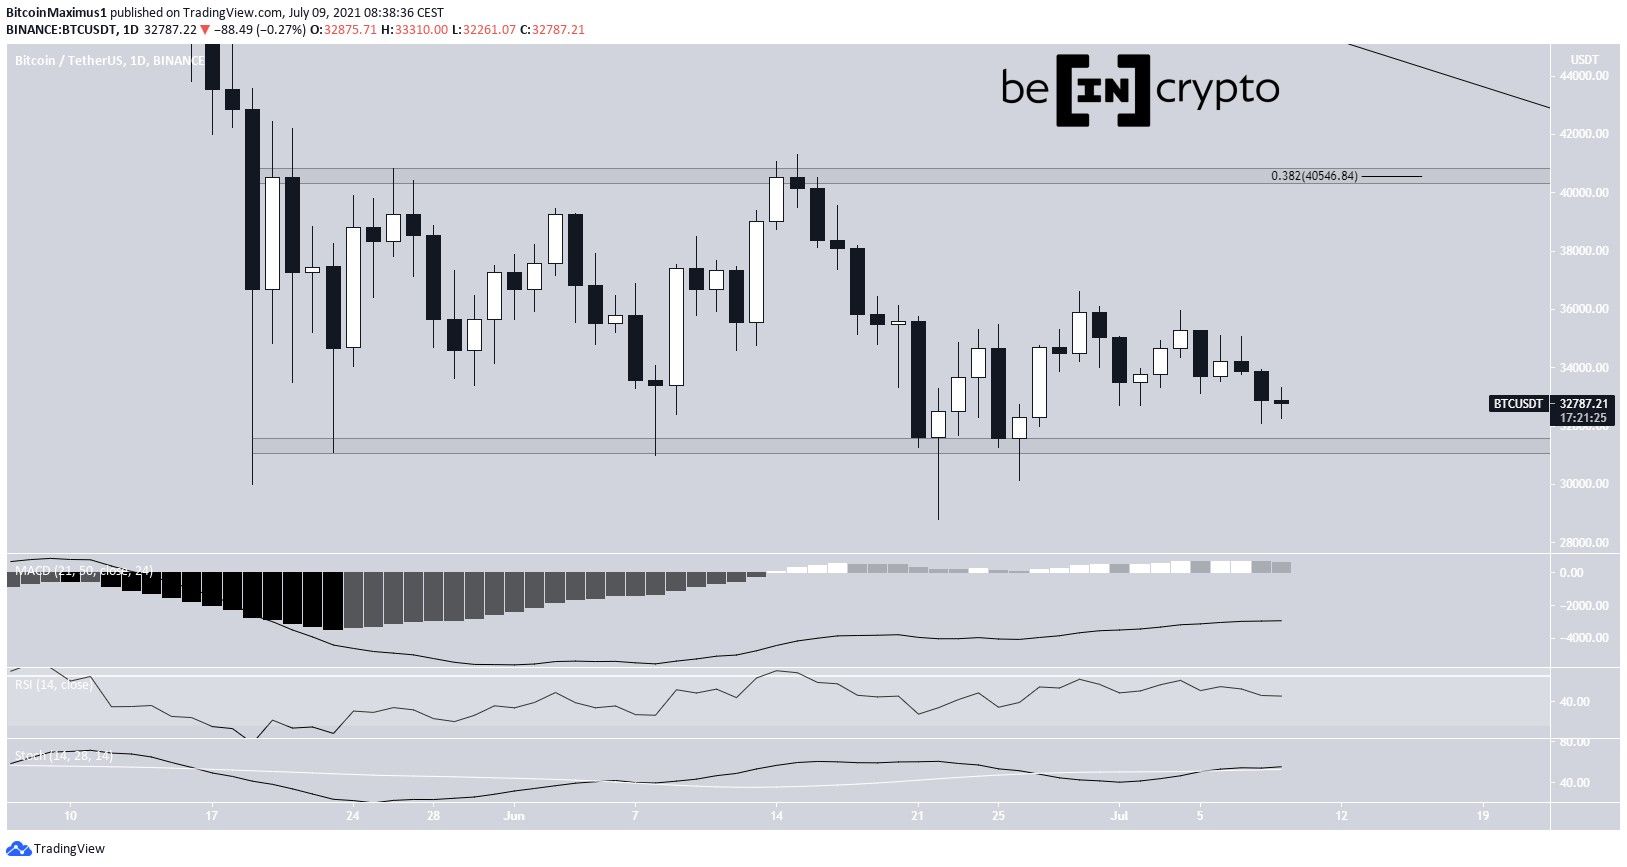
Bitcoin decreased considerably on July 8, reaching a low of $32,077 in the process. However, it bounced back and created a relatively long lower wick.
Technical indicators are still undecided. The RSI is just below the 50-line, the MACD is still positive but has lost strength, and the Stochastic oscillator is undecided between making a bullish and bearish cross.
The long-term range since May 19 is still in place. The support and resistance levels are found at $31,300 and $40,550, respectively. The latter is the 0.382 Fib retracement resistance level.
Short-term movement
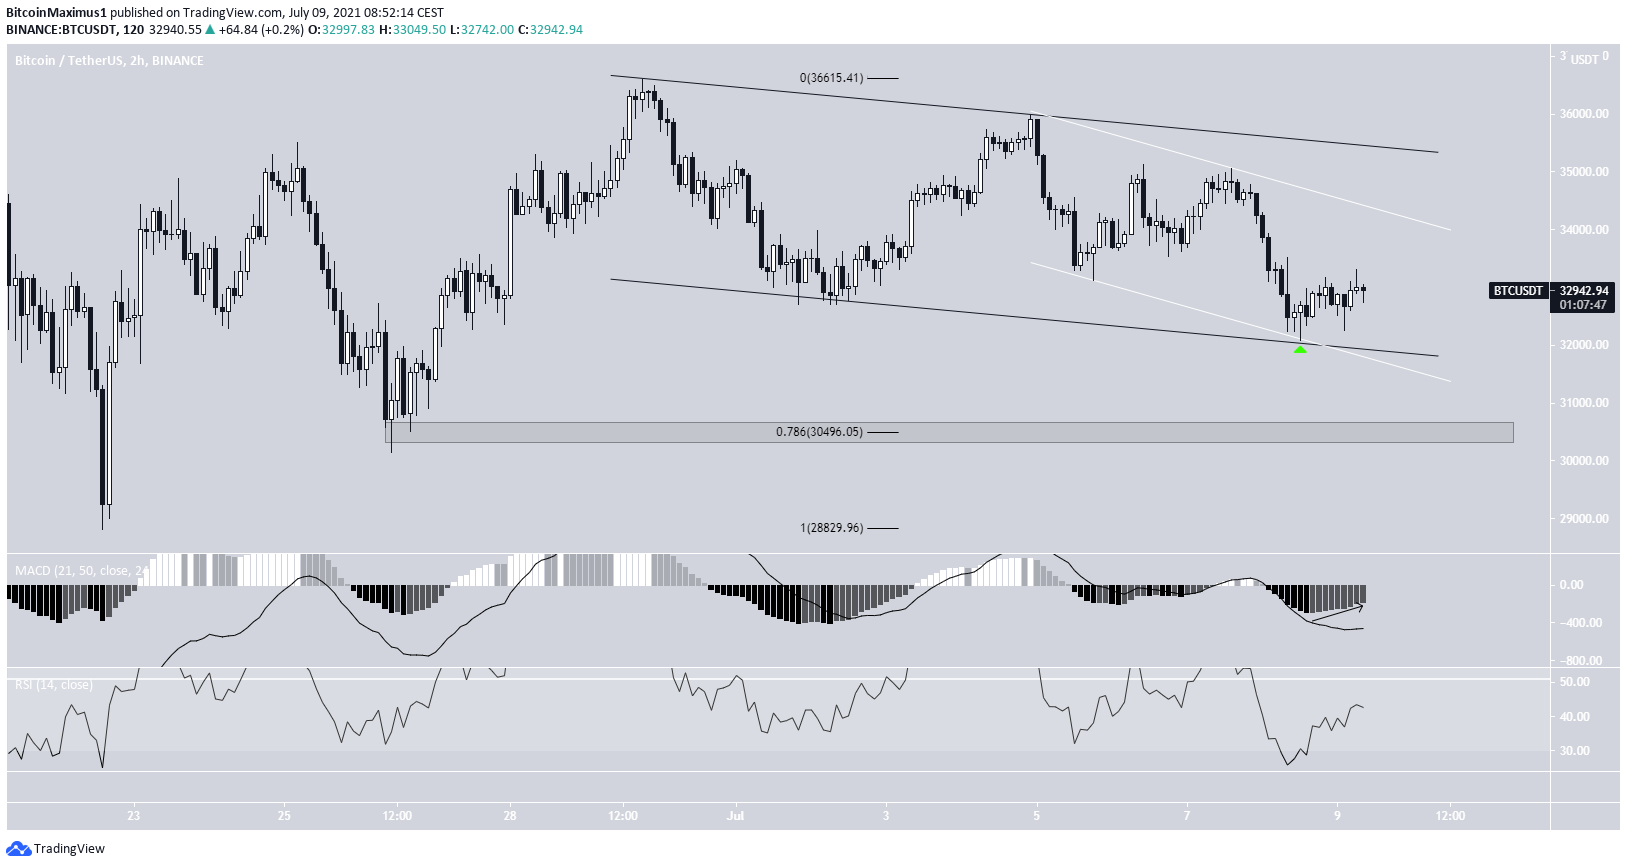
The two-hour chart shows two descending parallel channels, one long (black) and the other short (white) term. Parallel channels often contain corrective movements.
On July 8, BTC bounced at the confluence of the support lines of these two channels (green icon).
In addition to this, the short-term MACD is moving upwards. Therefore, the current price level is a very suitable level to initiate a bounce.
If BTC were to break down, the next support level would be found at $30,500.
However, a breakdown could also mean that the downward movement is impulsive and could lead to a breakdown of the range and new lows.
Wave count
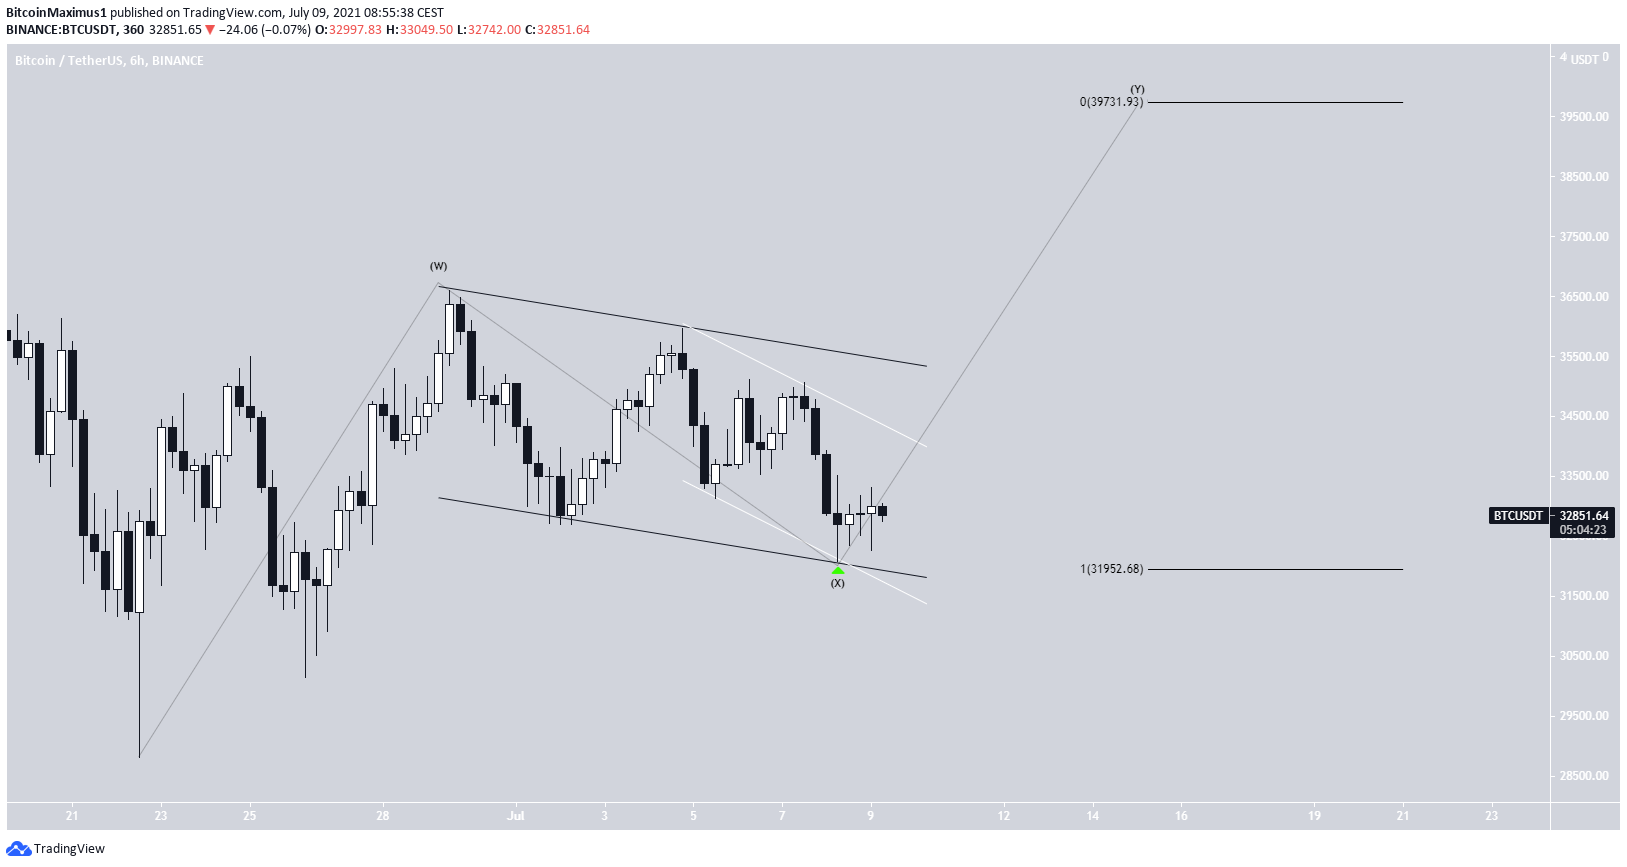
The exact wave count is still unclear.
Due to the presence of the channels, it’s possible that this is the X wave of an W-X-Y corrective structure.
In the Y wave, BTC could move back toward the range highs.
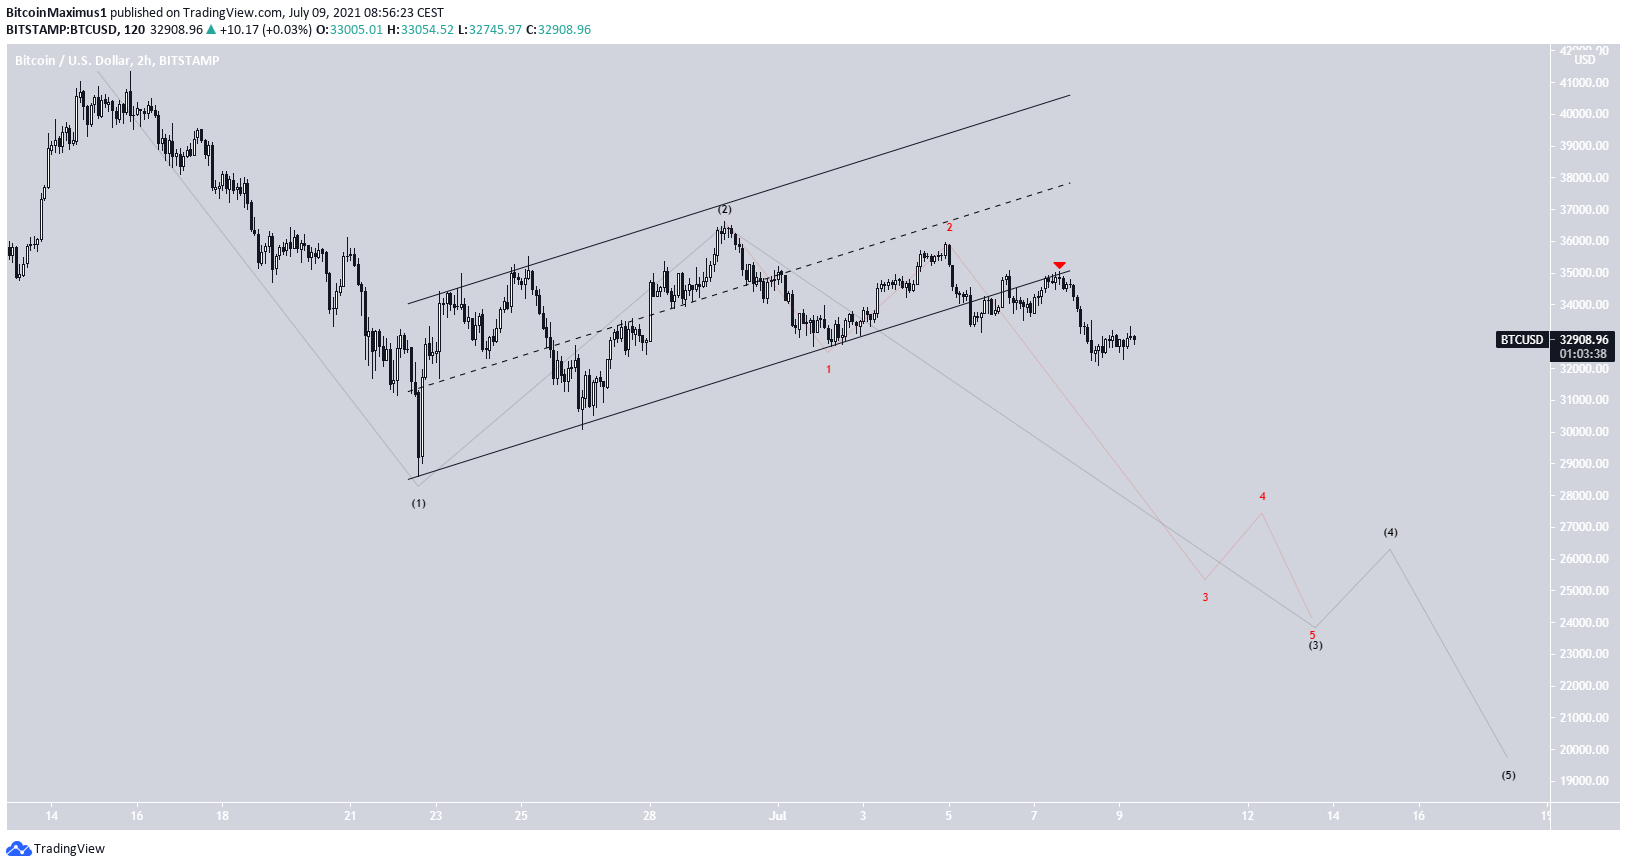
On the other hand, the bearish count indicates that BTC is still in a bearish impulse.
This seems extremely likely after the breakdown from the long-term ascending parallel channel.
However, the lack of a sharp downward movement after the breakdown has cast some doubt.
The only way for this count to remain valid is if the movement is a series of 1-2/1-2 wave formations.
If this transpires, it could lead to lows near $19,000.
For BeInCrypto’s latest bitcoin (BTC) analysis, click here.


