


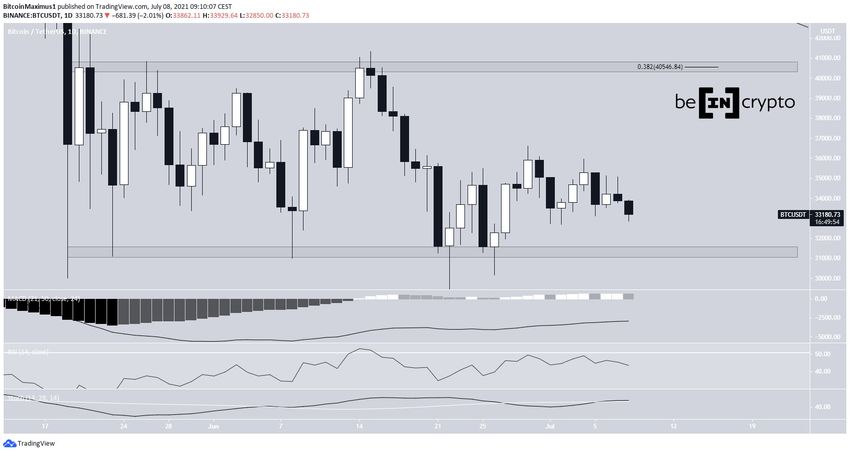
The bitcoin (BTC) price was rejected on July 7 but is still trading inside its previous range.
The short-term reading and the wave count provide mixed readings, leading to an undetermined trend.
BTC trading range
BTC made another attempt at moving upwards on July 8, but created another long upper wick. It has fallen slightly since, so far reaching a low of $32,530.
It has been trading relatively close to this level since June 21.
Technical indicators are undecided. The RSI is at the 50-line and the Stochastic oscillator is undecided between making a bullish or bearish cross. Similarly, the MACD has lost its strength but is still positive.
BTC is still trading inside the same range between $31,300 and $40,550. The latter target is the 0.382 Fib retracement resistance level.
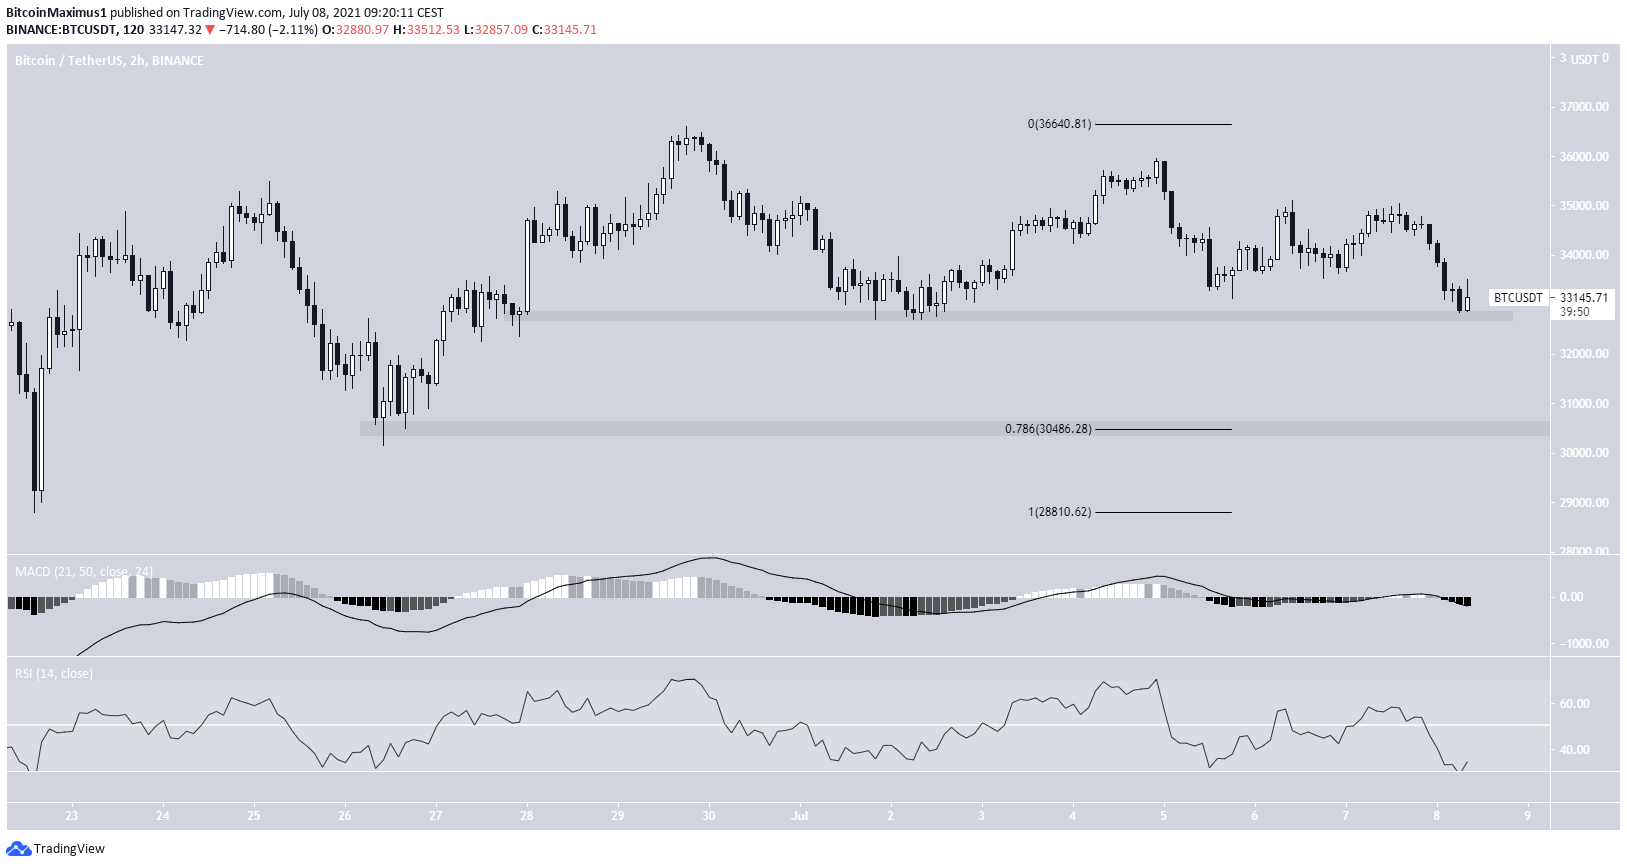
The shorter-term two-hour chart shows that BTC is trading at the $32,725 minor support level. This is the 0.5 Fib retracement support level of the most recent portion of the upward movement. In addition, it’s a horizontal support area.
Similar to the daily time frame, technical indicators provide a mixed reading. The MACD is at the 0 line while the RSI is moving above and below 50.
If a breakdown occurs, the next support would be found at $30,500. This is the 0.786 Fib retracement support level and a horizontal support area.
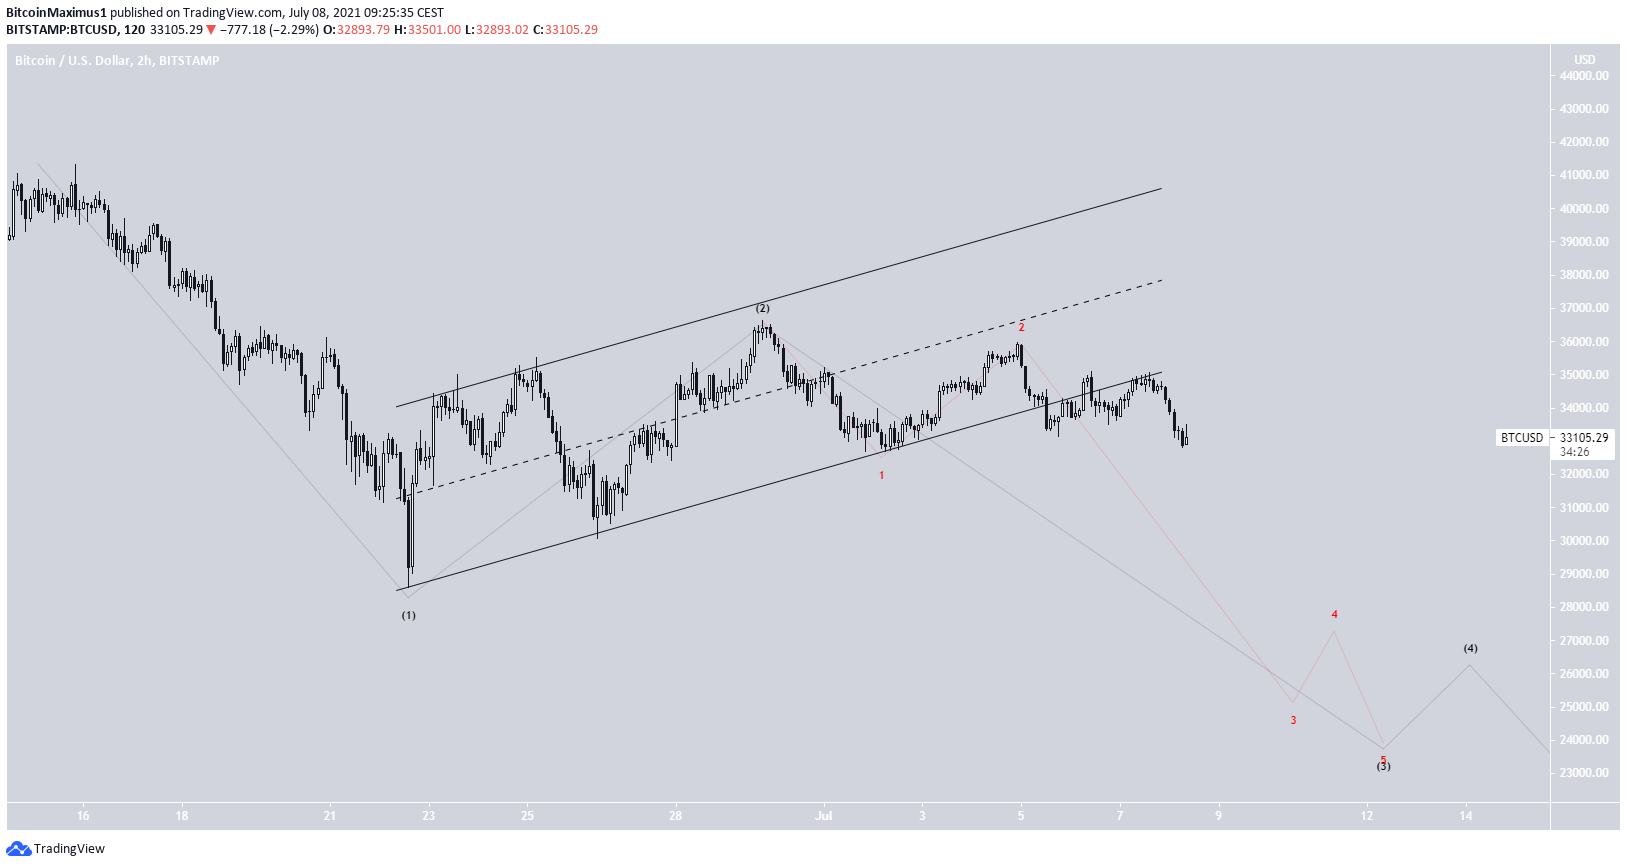
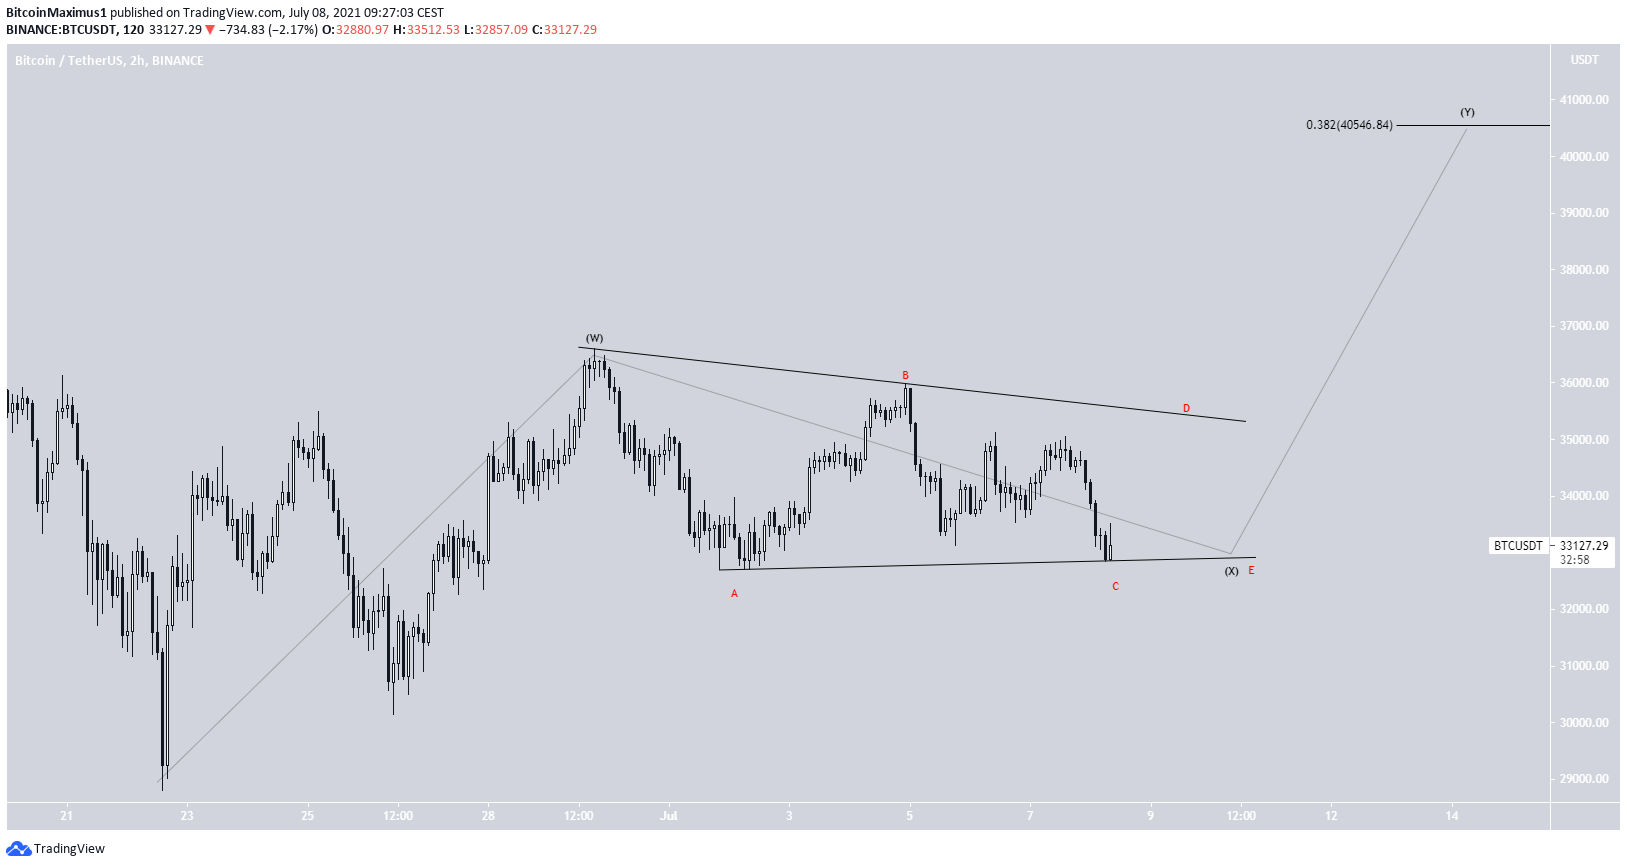
Wave count
The wave count is currently unclear. The bearish count suggests that BTC is in a large 1-2/1-2 formation, which could eventually lead to lows near $19,000.
The bullish count suggests that BTC is trading inside a symmetrical triangle as part of a complex corrective structure. This could lead to a retest of the range high.
Due to both counts being technically valid and the mixed readings from technical indicators, the current wave count is a bit ambiguous.
For BeInCrypto’s latest bitcoin (BTC) analysis, click here.


