


Bitcoin (BTC) is trading just above a long-term support level, and is showing bullish reversal signs in the short-term, indicating that a breakout is likely.
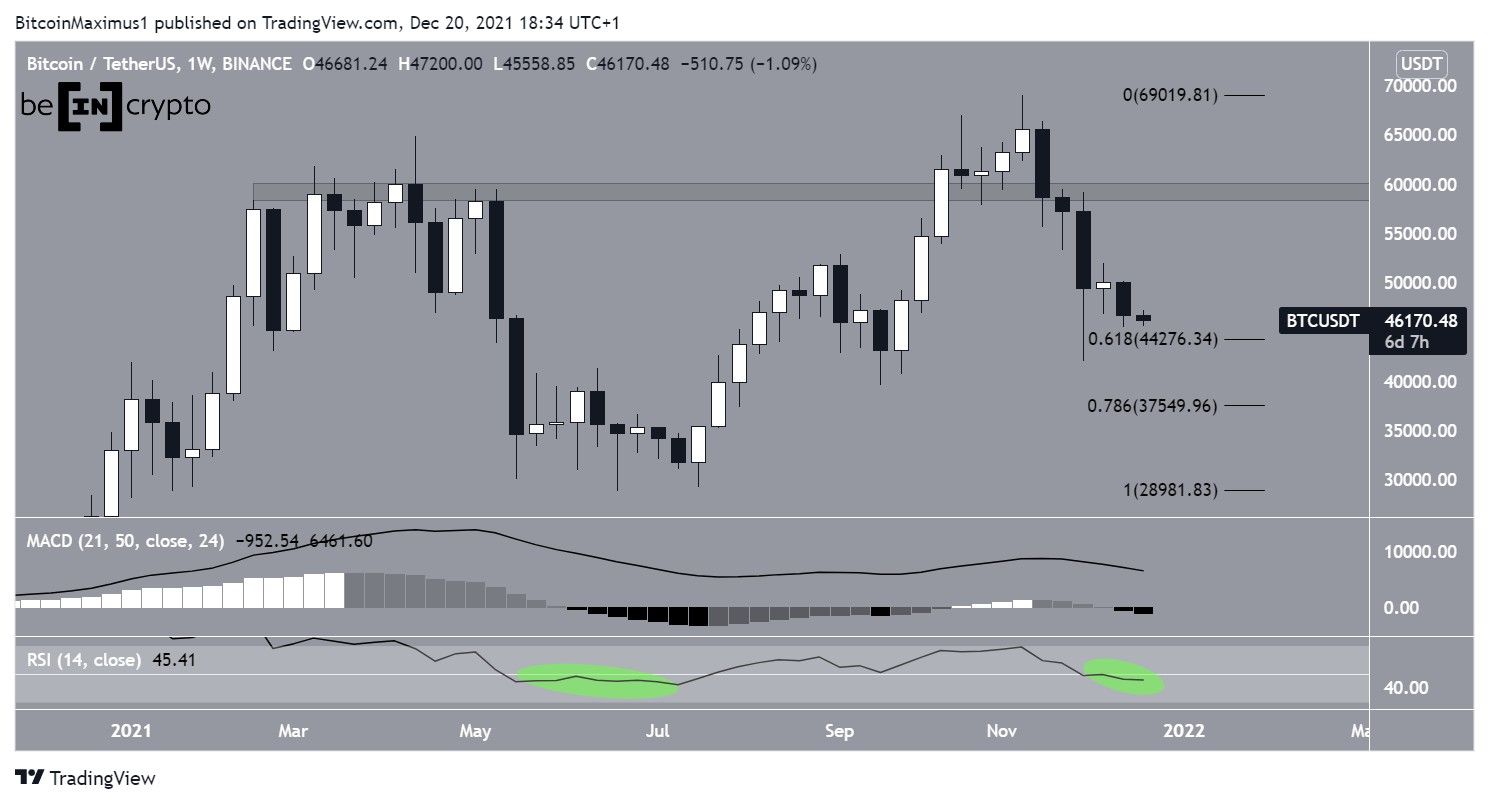
BTC decreased by slightly more than $3,000 during the week of Dec 13-20, reaching a close of $46,681. However, it is still trading above long-term support at $44,275, created by the 0.618 Fib retracement support level. This is the Fib level that most commonly acts as support after sharp falls.
However, technical indicators are showing bearish signs.
The MACD, which is created by a short- and a long-term moving average (MA) is falling and has created a negative histogram bar. This means that the short-term MA is deaccelerating relative to the long-term one, and is a sign of a weakening trend. However, the fact that the MACD line is still positive suggests that the trend is still bearish.
The RSI, which is a momentum indicator, is just below the 50 line. This is also a sign of bearish trends.
The previous time both these indicators gave the same readings was in May – July (Green circle). Despite the bearish signs, that proved to be a local bottom, since BTC initiated the current recovery in the beginning of July.
It remains to be seen if the same will transpire this time around.
Conversely, the next closest support area is at $37,550, created by the 0.786 Fib retracement support level.
Potential bounce
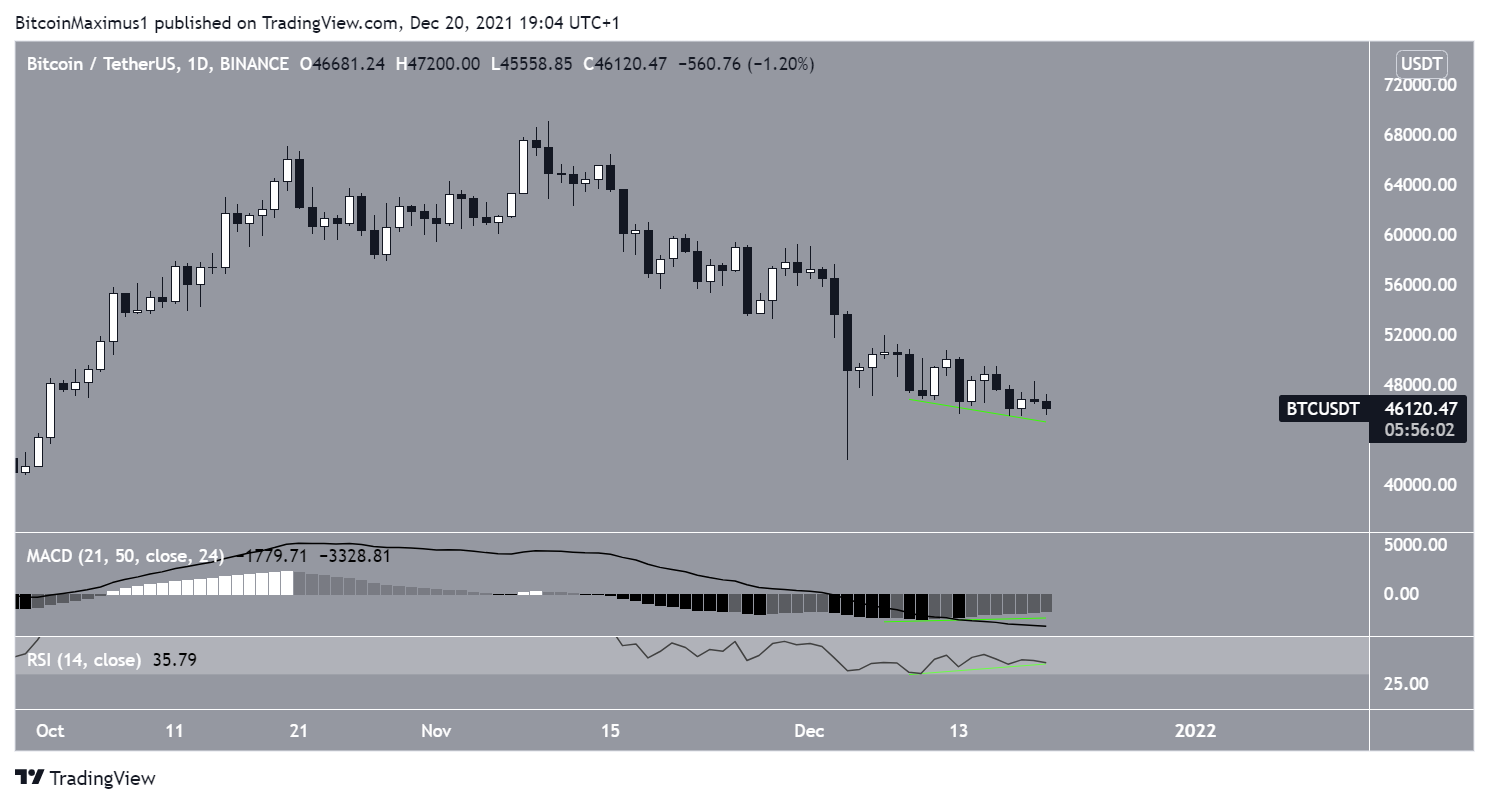
The daily chart provides a more bullish outlook. This comes mainly from the considerable bullish divergence that is present in both the RSI and MACD (green lines). Bullish divergences often transpire close to bottoms and precede significant trend reversals.
In addition to this, the MACD has generated six consecutive higher momentum bars and is in the process of creating the seventh.
Therefore, despite the ongoing drop, readings from the daily time-frame suggest that bullish momentum is starting to return.
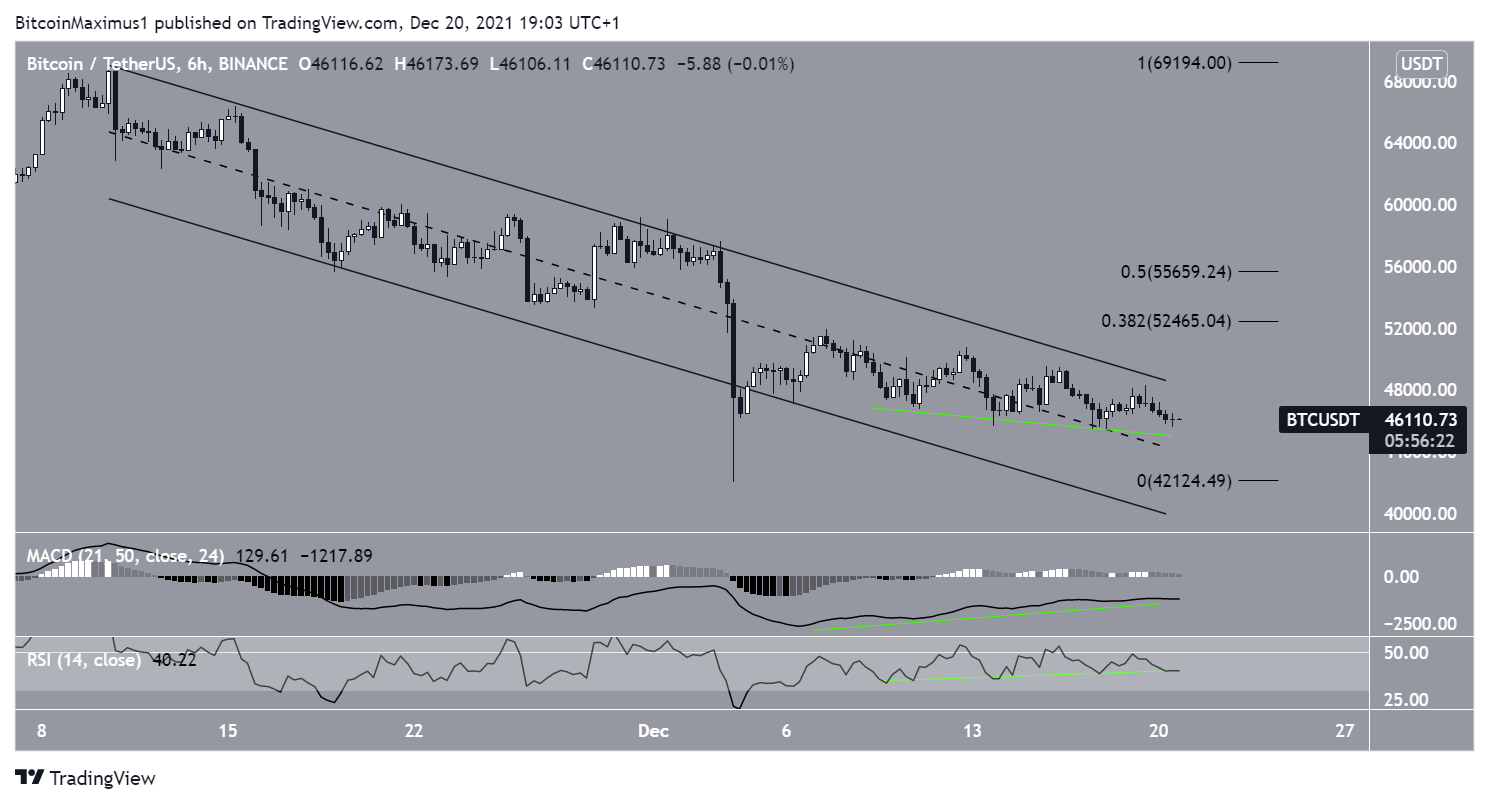
A look at the six-hour time-frame supports this possibility.
BTC has been trading inside a descending parallel channel since Nov 10. Such channels usually contain corrective movements. Therefore, a breakout from it would be likely.
Furthermore, there is a similar bullish divergence developing in both the RSI and MACD, supporting the possibility of a breakout.
If one occurs, the closest resistance area would be between $52,465-$55,650, created by the 0.382 – 0.5 Fib retracement resistance levels.
Is the BTC correction complete?
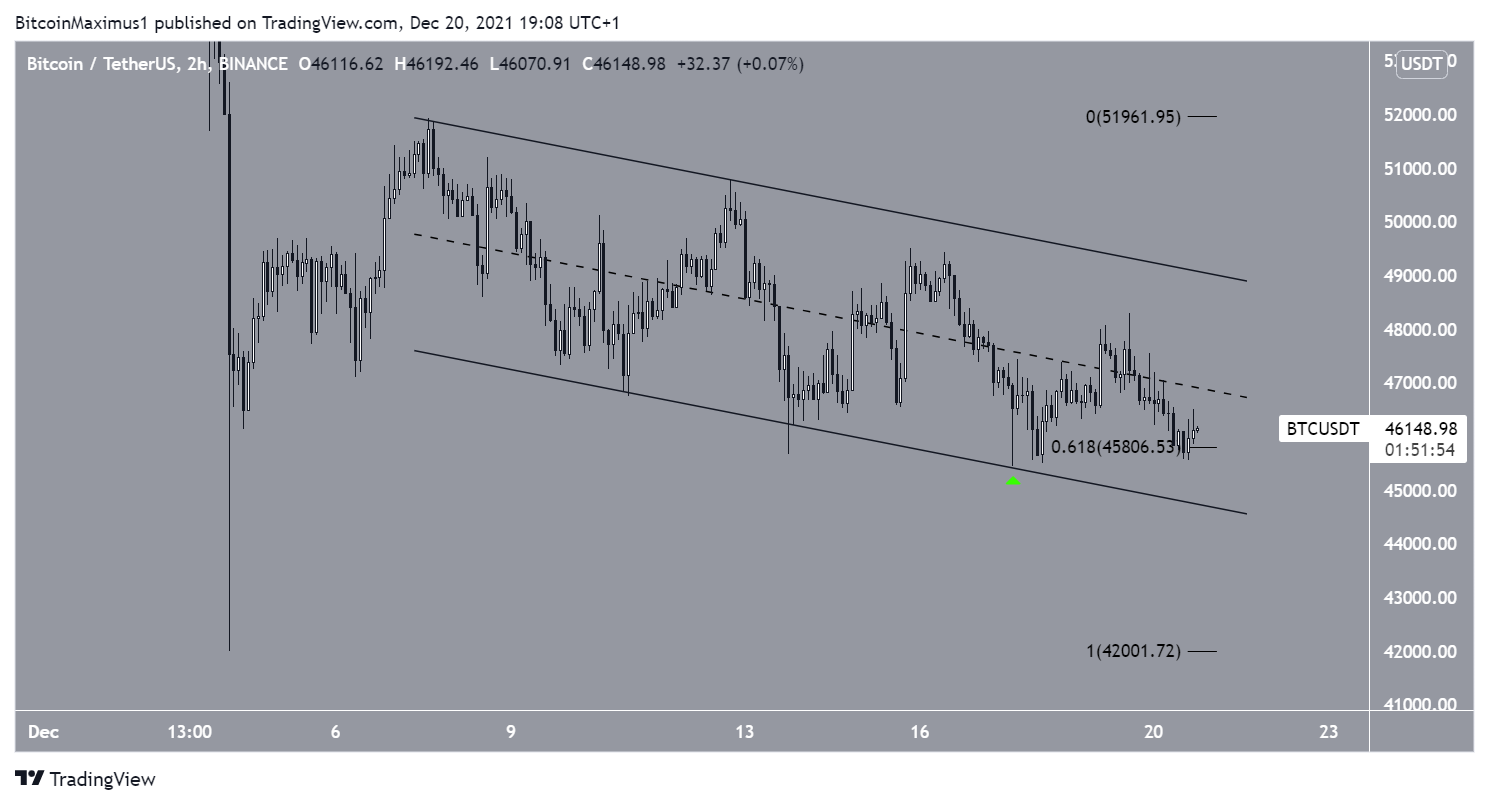
Finally, the two-hour chart shows another descending parallel channel, this one in place since Dec 6.
On Dec 17, BTC bounced at its support line and initiated a bounce. The bounce also coincided with the 0.618 Fib retracement support level.
Currently, BTC is attempting to reclaim the middle of the channel. Doing so would further increase the chance that a breakout will transpire, taking BTC to the $52,465-$55,650 resistance area.
For BeInCrypto’s previous Bitcoin (BTC) analysis, click here


