

Bitcoin (BTC) has been retracing since July 30, but it is trading inside a short-term bullish pattern and has reached short-term support.
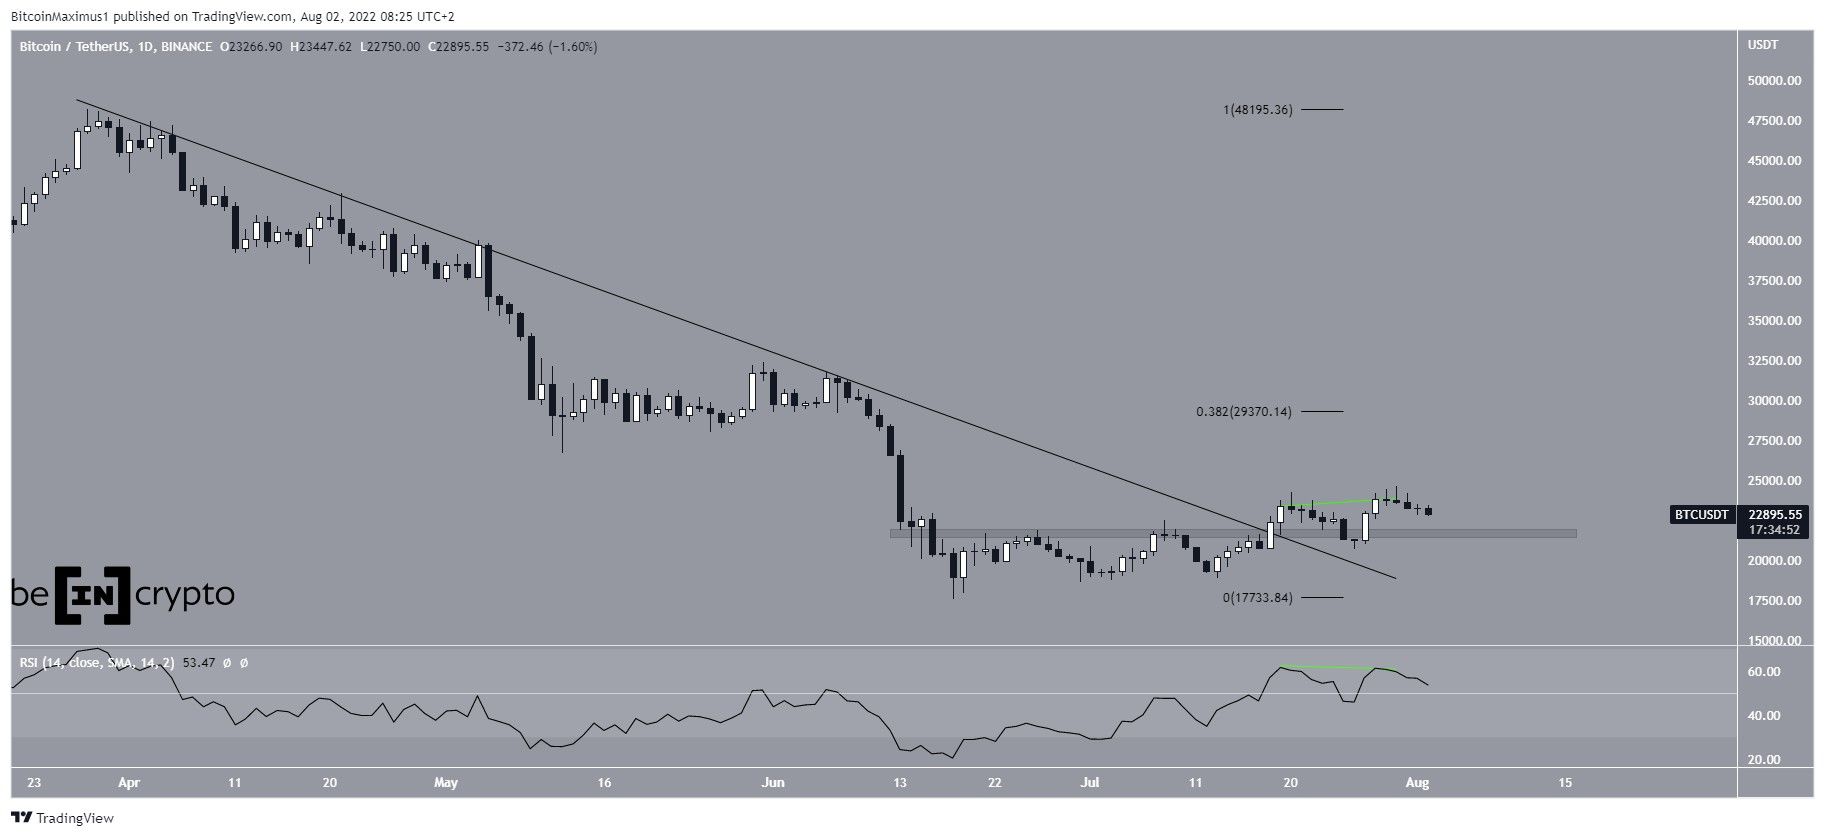
The daily chart shows that Bitcoin has broken out from a descending resistance line that had previously been in place since the end of March. Bitcoin broke out on July 18 but has not increased considerably since.
BTC has, however, broken out from the $21,750 horizontal area and validated it as support afterward and the daily RSI has moved above 50.
There is a slight bearish divergence that is now developing in the RSI (green line). This could lead to a short-term retracement towards the $21,750 horizontal area prior to any upwards continuation. The next closest resistance area is found at $29,370. This target is the 0.382 Fib retracement resistance level.
Short-term movement
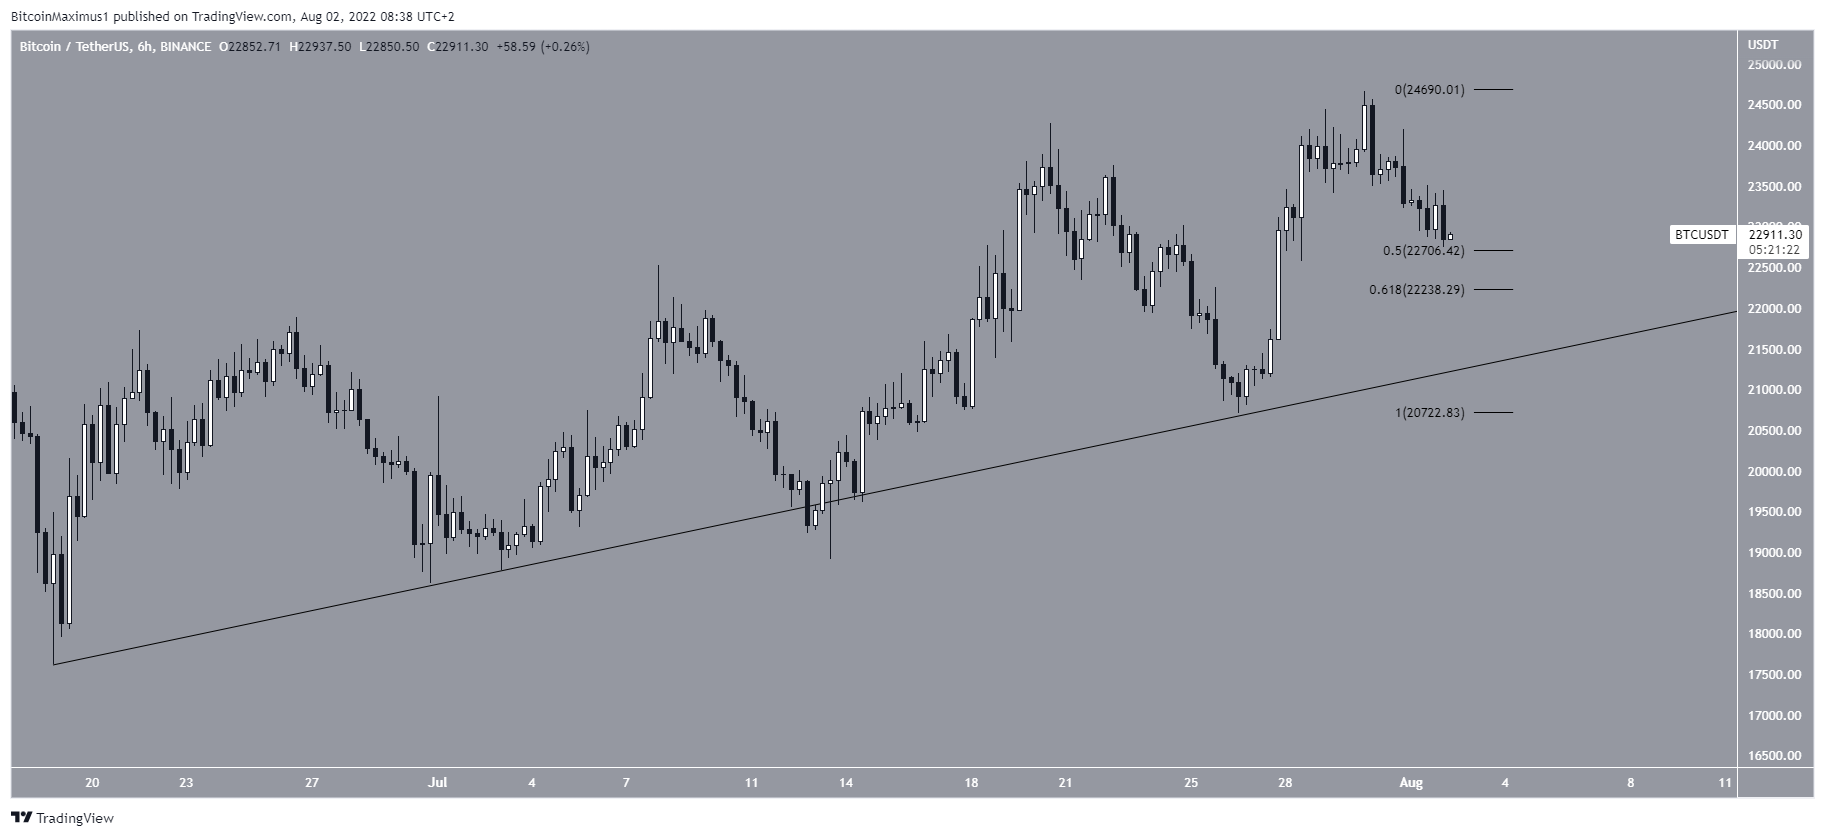
The six-hour chart shows that BTC could still be following an ascending support line that was created in the middle of June. The line currently intersects near $21,800, aligning with the previously outlined horizontal support area.
There is also Fib support found between $22,250 and $22,700, created by the 0.5-0.618 Fib retracement support levels.
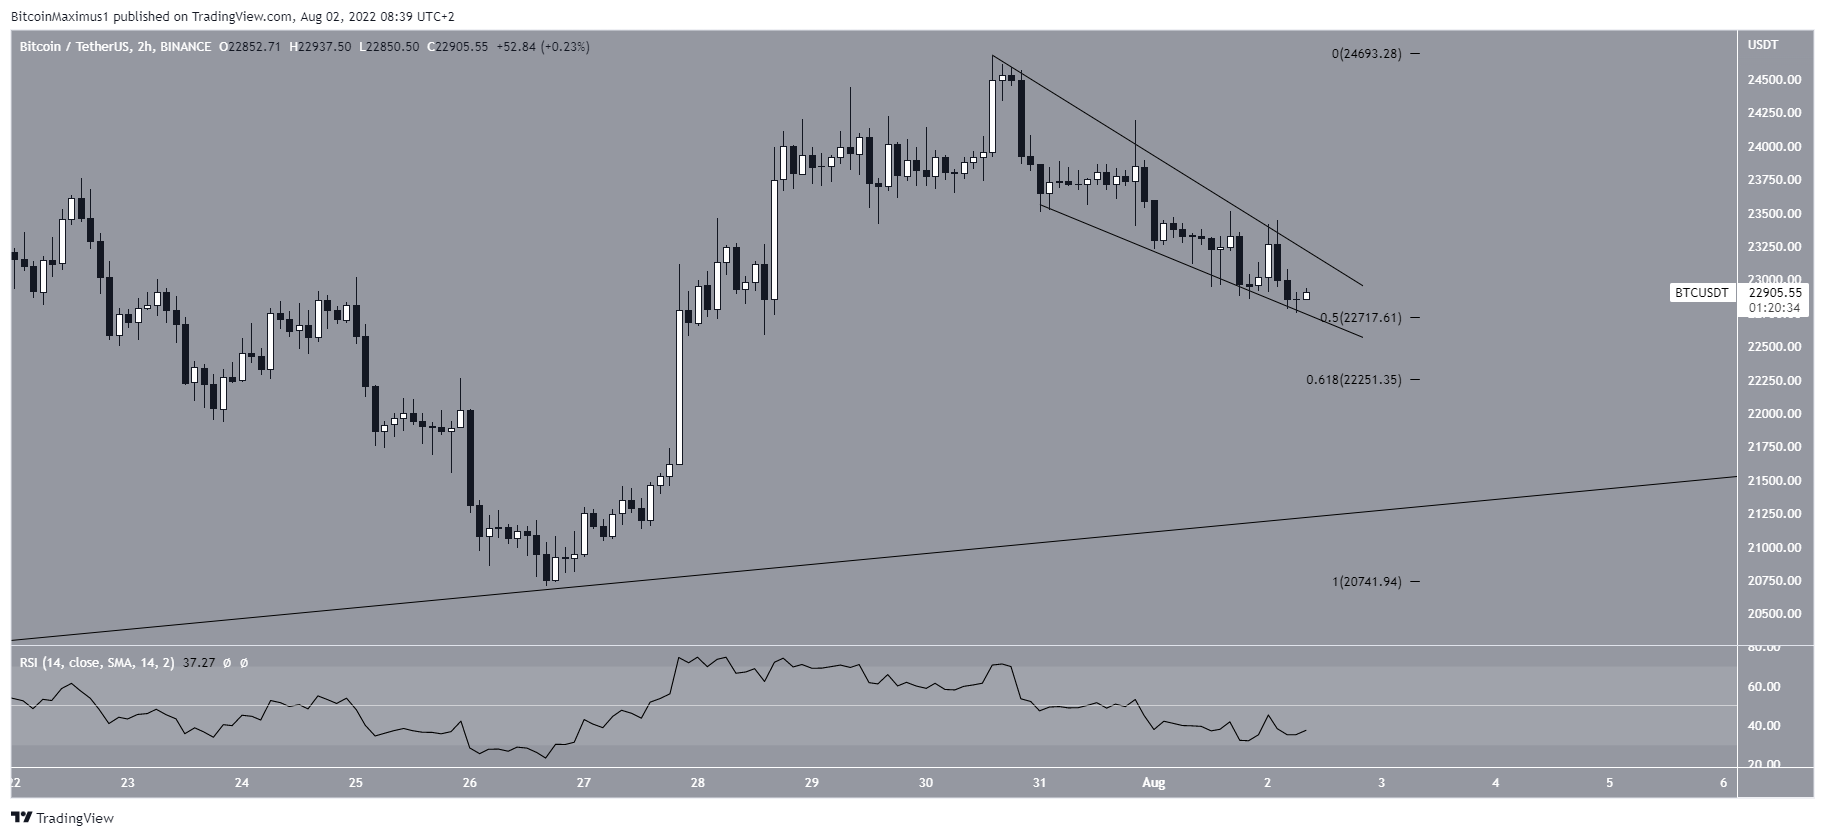
The two-hour chart shows that Bitcoin has been trading inside a descending wedge since reaching its July 30 local highs. The descending wedge is often considered a bullish pattern, meaning that a breakout from it would be likely.
BTC wave count analysis
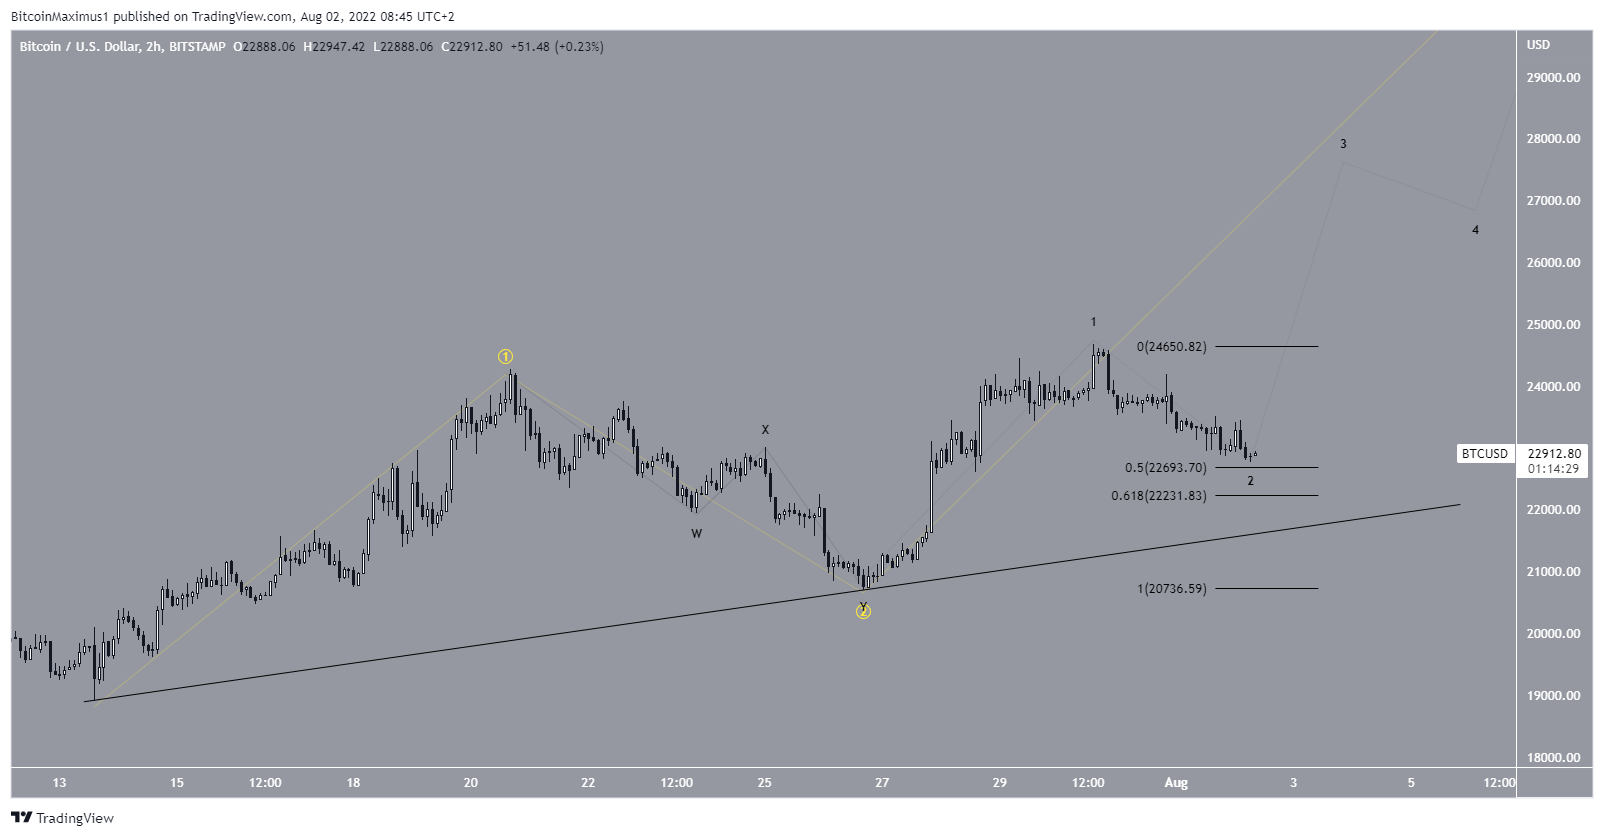
The most likely wave count suggests that Bitcoin has begun wave three of a five-wave upward move (yellow). If correct, a considerable increase is likely, since wave three is usually the sharpest and largest out of the five.
The sub-wave count is shown in black and suggests that the price is completing sub-wave two, after which a sharp increase could follow.
Since this seems to be a 1-2/1-2 wave formation. A decrease below the ascending support line and the 0.618 Fib retracement support level at $22,230 would invalidate this particular count.
For Be[in]Crypto’s previous Bitcoin (BTC) analysis, click here
Disclaimer
In line with the Trust Project guidelines, this price analysis article is for informational purposes only and should not be considered financial or investment advice. BeInCrypto is committed to accurate, unbiased reporting, but market conditions are subject to change without notice. Always conduct your own research and consult with a professional before making any financial decisions. Please note that our Terms and Conditions, Privacy Policy, and Disclaimers have been updated.
