
On April 1, the Bitcoin price initiated an upward move that caused it to break out above its descending resistance line and with it the symmetrical triangle it had been trading in since March 20.
Bitcoin Price Breakout
Last night, the Bitcoin price broke out from the possible symmetrical triangle it has been trading in since March 20. The breakout transpired after the price completed an A-B-C-D-E correction, even though the E wave failed to touch the ascending support line of the triangle. In addition, volume was significant — the highest on a bullish candlestick since March 23.
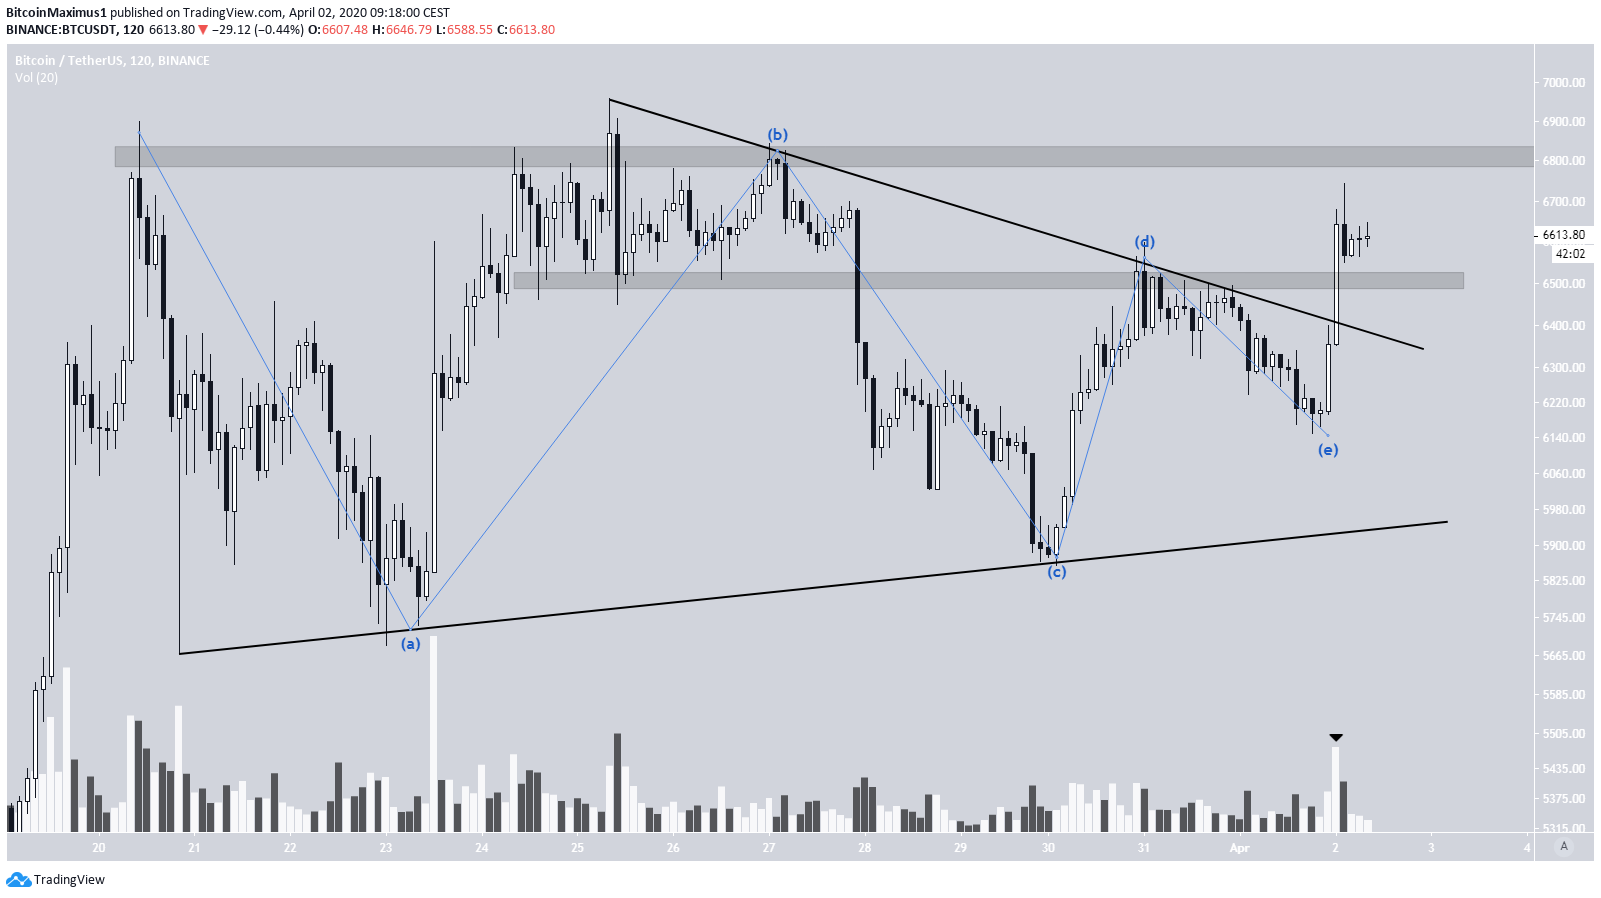
The closest support and resistance areas are found at $6,500 and $6,800, respectively. The price has successfully flipped the $6,500 area as support. So, the directional bias, at least in the short-term, is bullish.
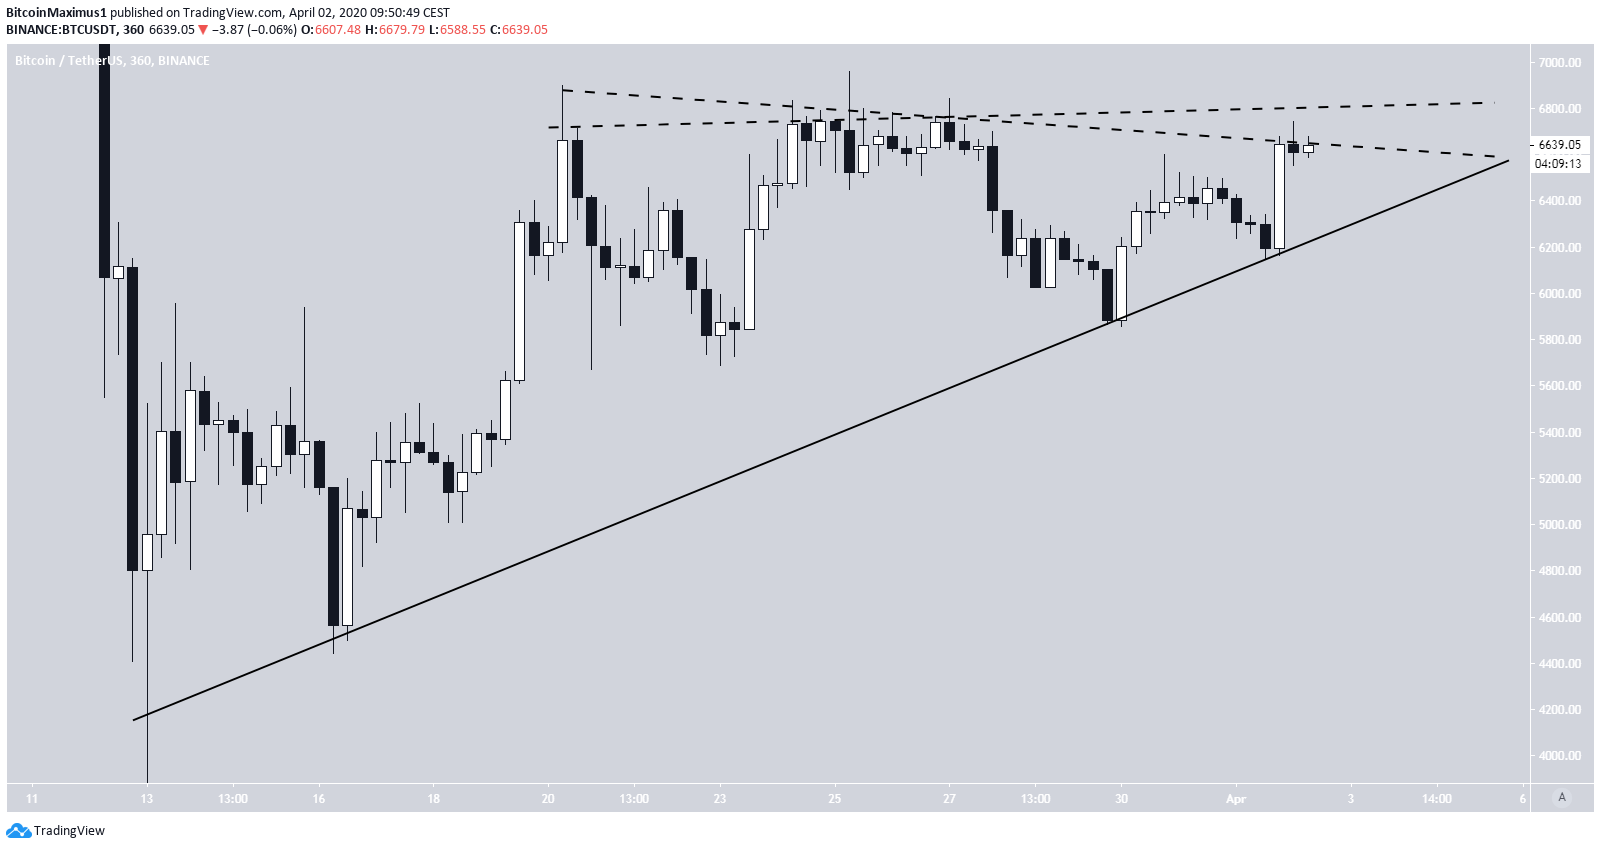
Ascending Support
A look at a longer-term chart reveals that the price has been following a longer-term ascending support line since reaching a bottom on March 13. On March 30, the price validated it for the fourth time and created a bullish engulfing candlestick.
As for the resistance, the price could either be following a horizontal or a descending line, which creates either an ascending or symmetrical triangle.
Whichever may be the case, due to the creation of four consecutive higher-lows and the lack of bearish divergence, the price is expected to break out above this resistance.
Due to the lack of overhead resistance and the relatively long period of consolidation, the breakout could be swift, with the price moving above $8,000 in rapid fashion.
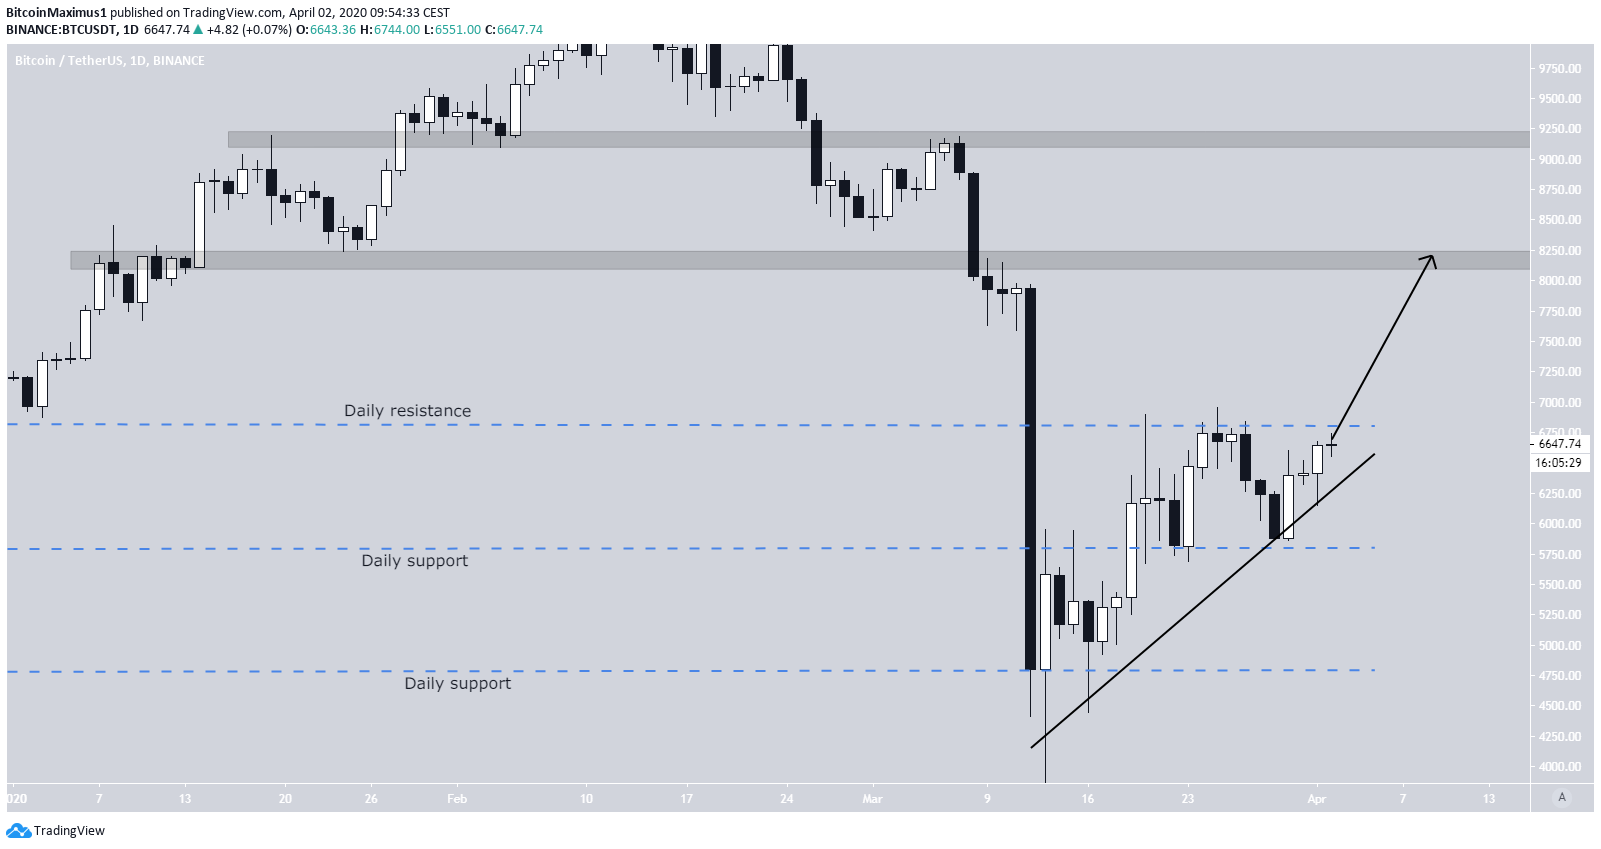
The closest resistance areas are found at $8,200 and $9,200, respectively.
To conclude, the BTC price initiated an upward move on April 2 and broke out above its descending resistance line. The price movement and creation of numerous higher-lows indicates that the price wants to continue moving upwards. A breakout could take the price back above $8,000.
For those interested in BeInCrypto’s previous Bitcoin analysis, click here.
