


Last night, the Bitcoin price closed its monthly candlestick for March. The candlestick took the form of a bearish hammer, with a very long lower-wick.
It closed 24% below the opening price, while the candlestick had a lower-wick with a magnitude of 40%.
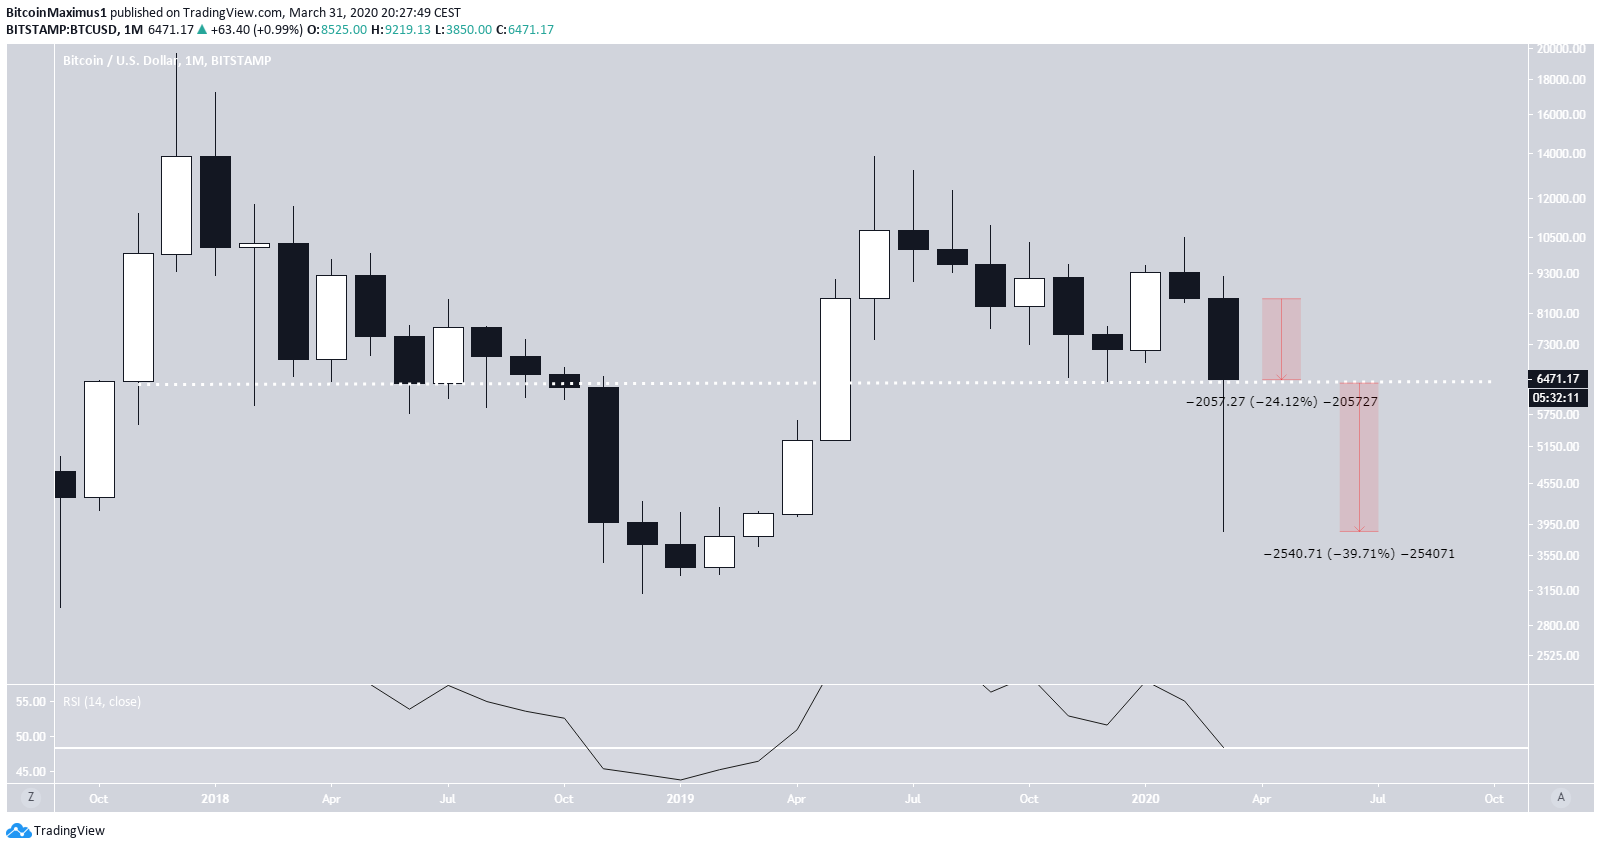
Bitcoin Monthly Candlestick For March
The values for the March candlestick are as follows:
- Open – $8,525
- Close – $6,410
- High – $9,219
- Low – $3,850
It is worth noting that the lower-wick had a magnitude of 40%, which indicates that there was significant buying pressure at prices below $6,000. However, the candlestick still had a bearish body of 24%. The candlestick looks akin to a bearish hammer.
While this is typically a bearish indication, the price had managed to hold above $6,450, which is an important high time-frame support area. A close below this level would be a major bearish development. As long as the price can keep above this level, a bullish continuation could occur.
In addition, the monthly RSI has reached the 50-line from above. Similar to the $6,450 support, a decrease below this level would indicate that the trend is likely bearish.
Short-Term Outlook
In the short-term, the price has been following a descending resistance line since March 15 when it reached a high of $6,957. At the time of publishing, the price was rejected from the resistance line and had begun to decrease.
In addition, there is a strong resistance area at $6,500, which the price has unsuccessfully attempted to break out from for the past two days.
Finally, it is possible that the price is following an ascending support line. A failure to break out above the current resistance line could trigger a decrease toward support. At the time of publishing, this movement seems likely.
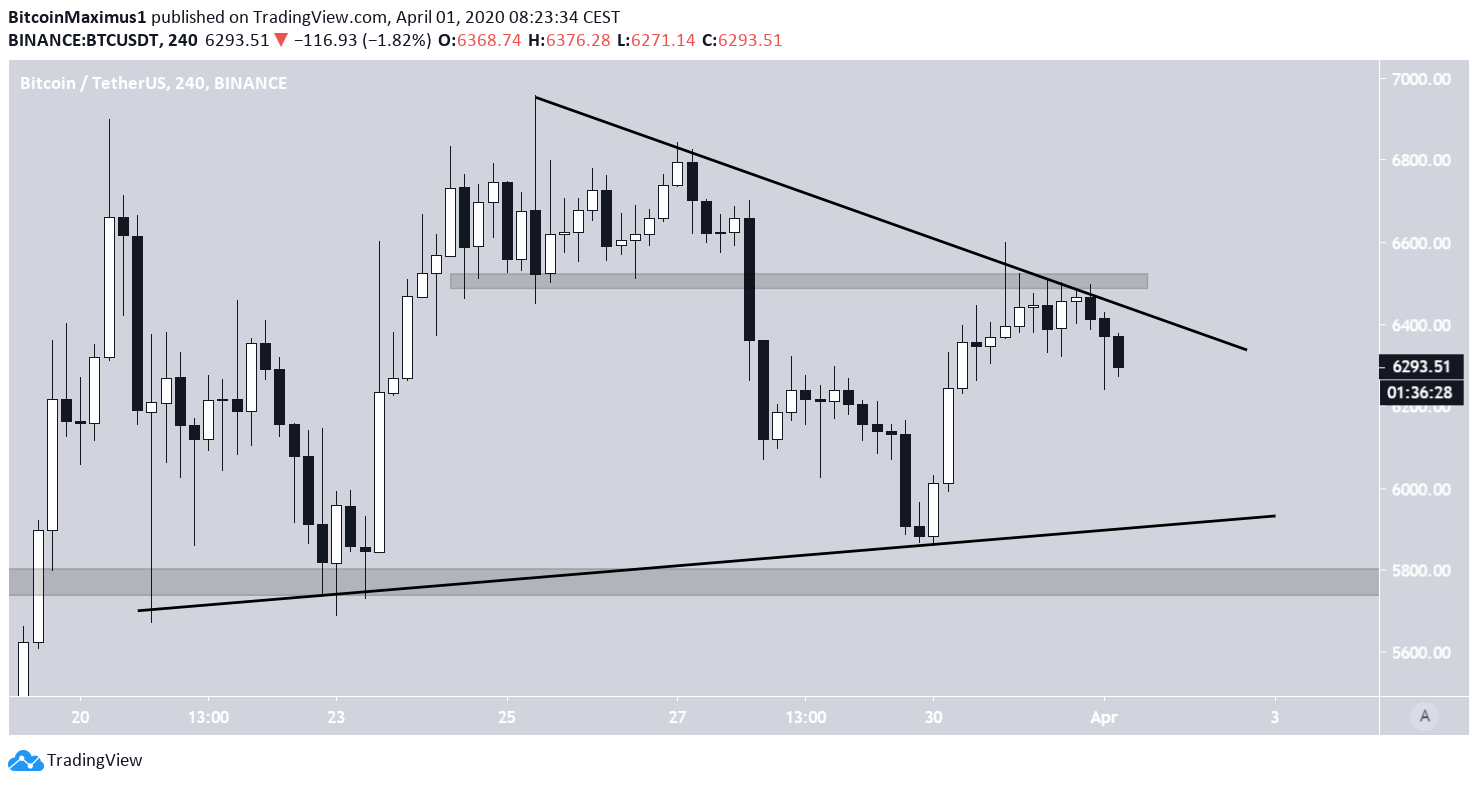
To conclude, the BTC price has created a bearish hammer candlestick for the month of March but has managed to stay above an important monthly support level. In the short-term, the price is expected to decrease towards the support line of the possible symmetrical triangle.
For those interested in BeInCrypto’s previous Bitcoin analysis, click here.


