


Be[In]Crypto takes a look at the five cryptocurrencies that had the biggest weekly gainers during the week of March 4.
The biggest weekly gainers are:
- Waves (WAVES) : 37.99%
- Zcash (ZEC) : 25.27%
- Stacks (STX) : 22.94%
- Terra (LUNA) : 7.21%
- Dash (DASH) : 7.05%
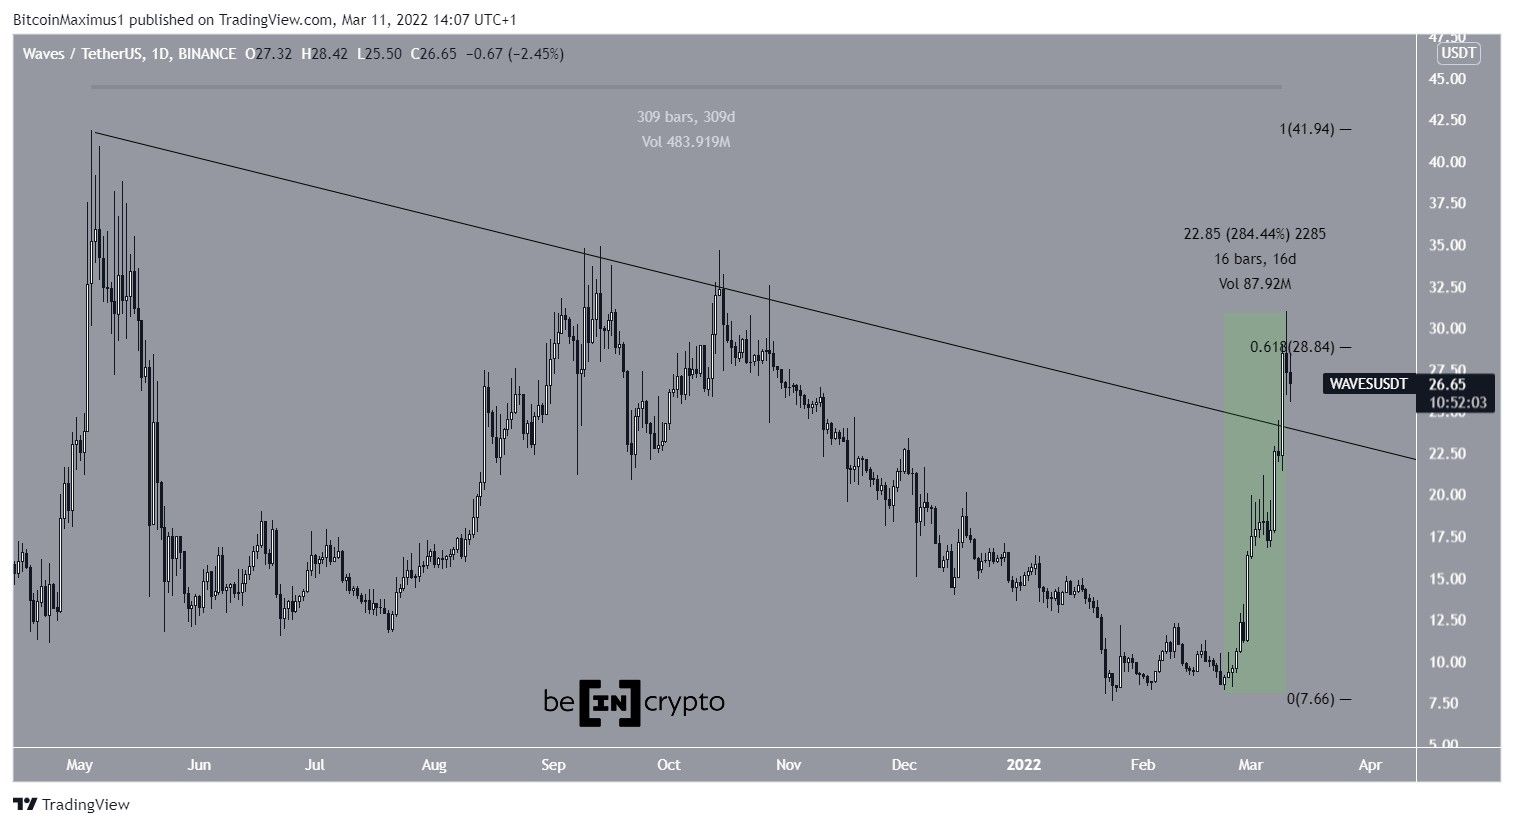
WAVES
WAVES has been decreasing alongside a descending resistance line since reaching an all-time high price of $41.86 on May 4. The downward movement led to a low of $7.56 on Jan. 24.
WAVES initiated a rapid upward movement on Feb. 22 and broke out from the descending resistance line on March 9.
In a span of 16 days, it increased by 284 percent. Currently, it is in the process of validating the line as support.
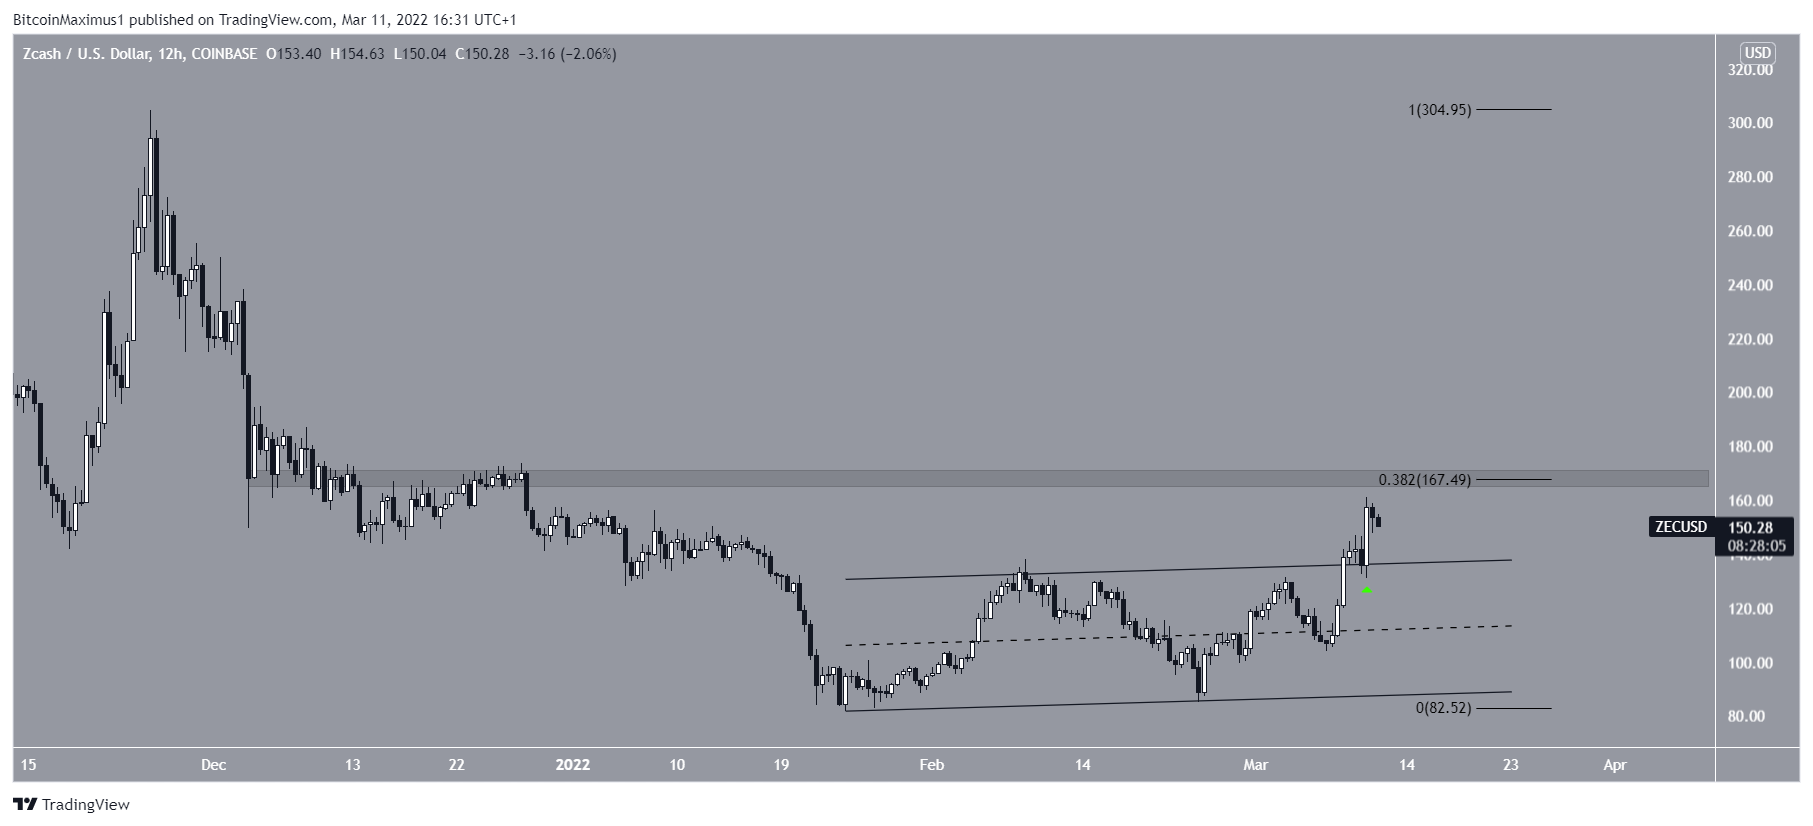
ZEC
Zcash (ZEC) has been increasing since Jan. 25.
Initially, the upward movement was contained inside an ascending parallel channel. However, ZEC managed to break out on March 8 and validated the channel as support three days later (green icon).
The closest resistance area is at $167.50. This is both a horizontal and a Fib resistance area.
Until ZEC manages to break out, the trend cannot be considered bullish.
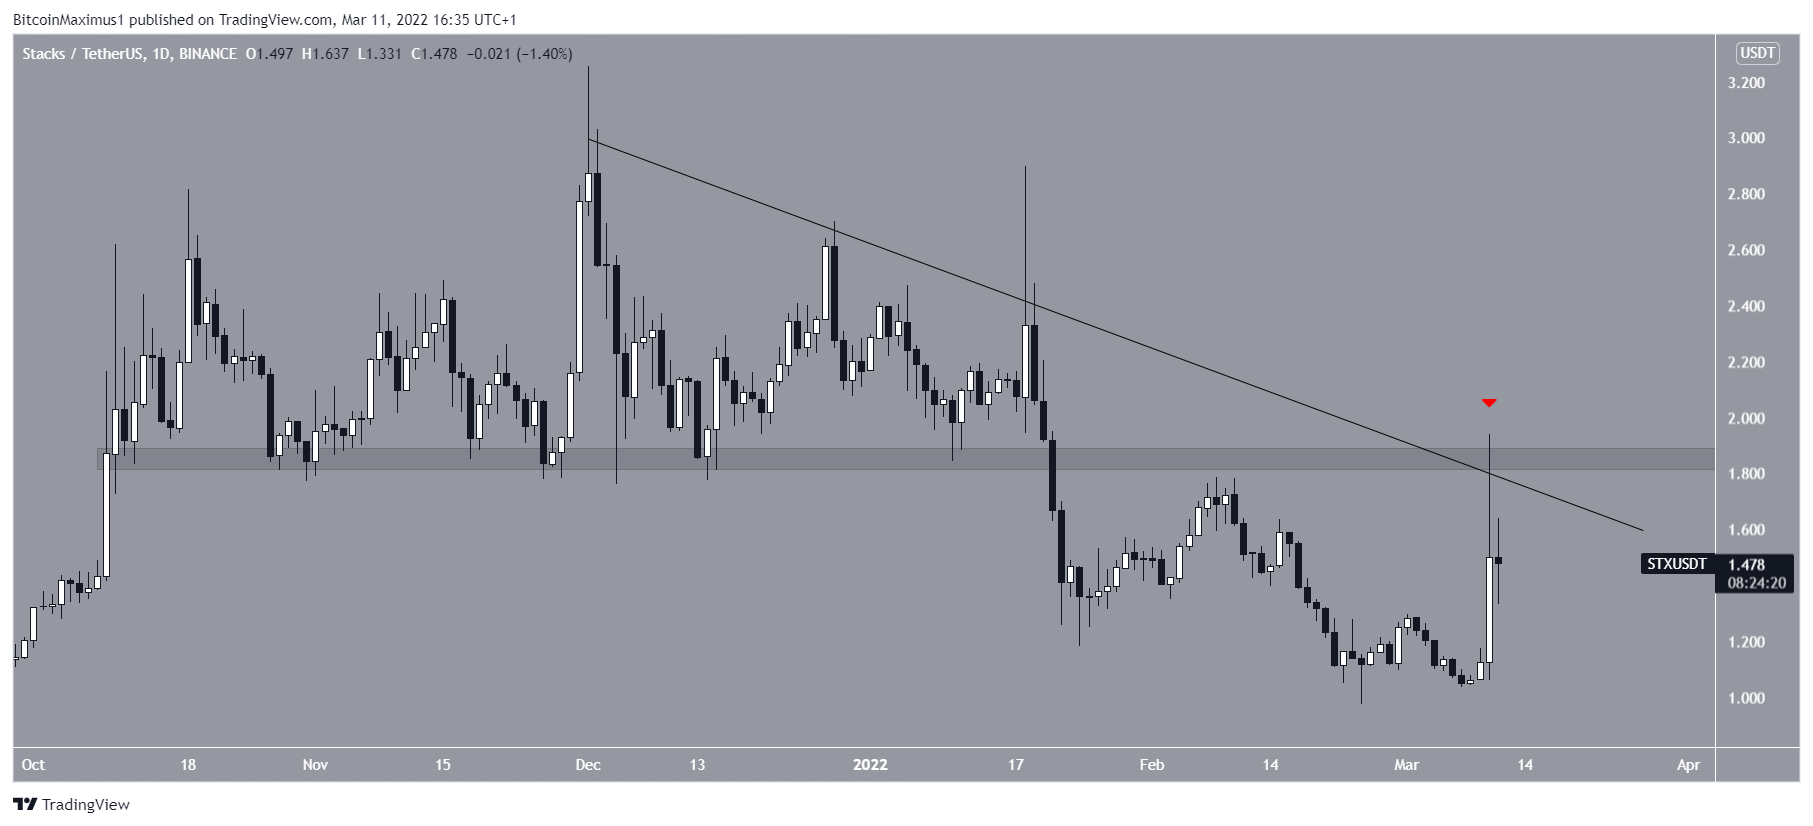
STX
Stacks (STX) has been decreasing alongside a descending resistance line since Jan. 1. So far, the line has been validated four times, most recently on March 10 (red icon).
The rejection created a long upper wick, which is considered a sign of selling pressure. Furthermore, it served to validate the $1.85 area as resistance.
STX has been scrambling for support since.
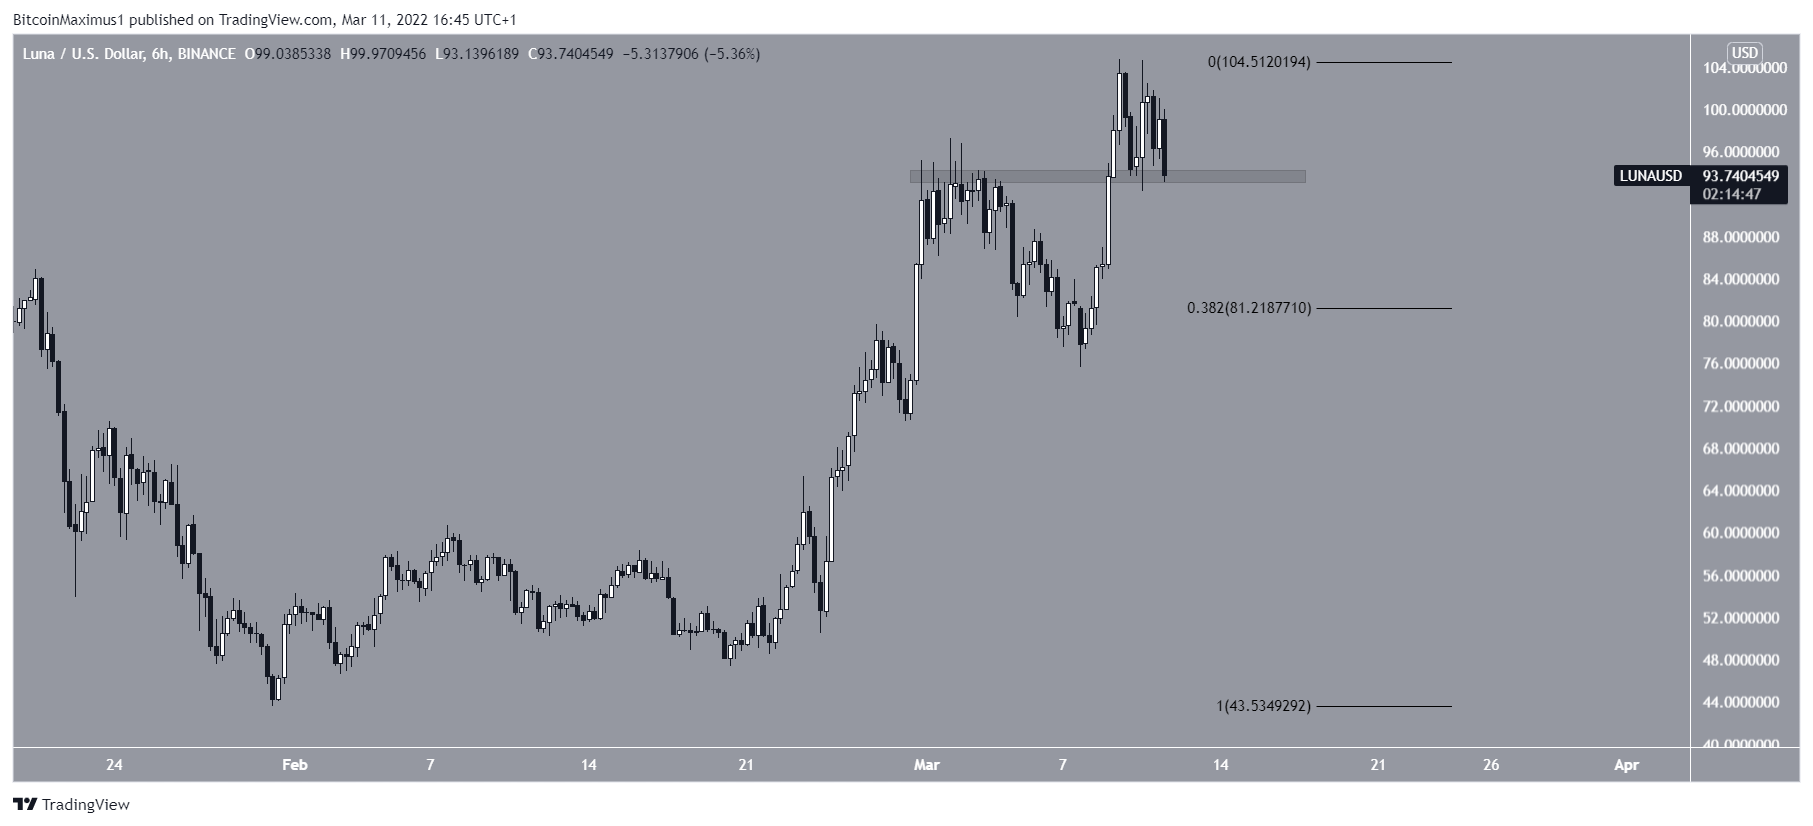
LUNA
Terra (LUNA) has been moving upwards since Jan. 31. The increase accelerated on Feb. 20 and LUNA reached a new all-time high price of $104.76 on March 9.
However, it has been decreasing since and is currently attempting to validate the $94 area as support.
A breakdown below this level could greatly accelerate the rate of decrease, leading to lows of at least $81. This is the 0.382 Fib retracement support level.
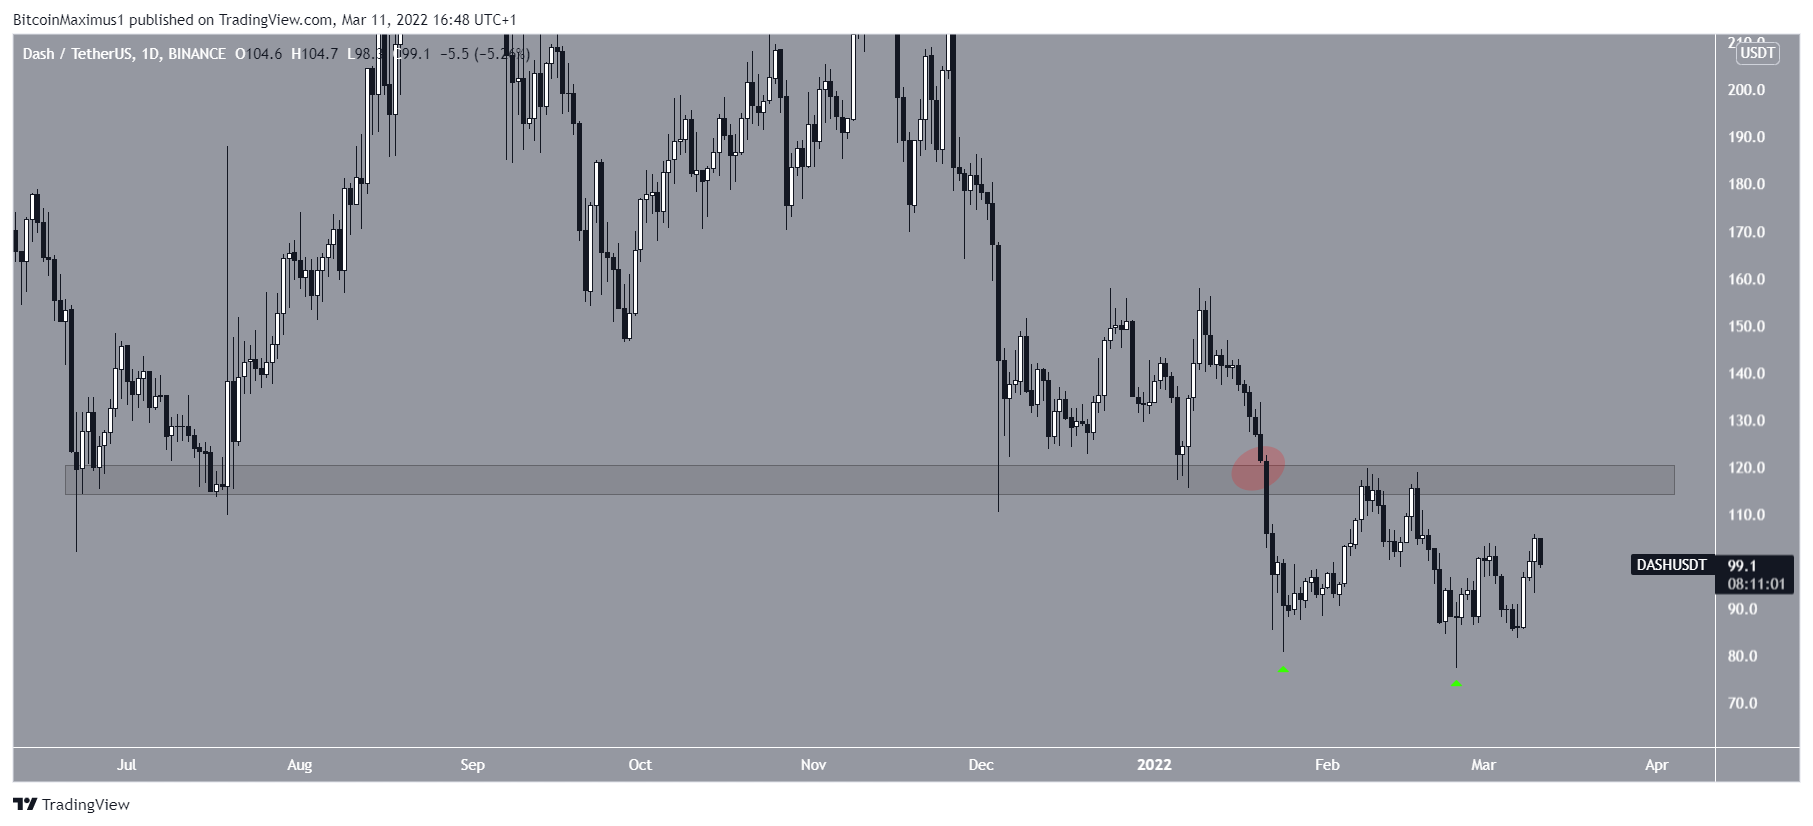
DASH
On January 24 and February 24, respectively, DASH created a double bottom, representing a bullish pattern.
Furthermore, both lows were combined with long lower wicks (green icons), which are considered signs of buying pressure.
However, DASH is still trading below the $117 resistance area. The area had previously acted as support since June and turned to resistance after DASH broke down on Jan 21 (red circle).
Until the area is reclaimed, the trend cannot be considered bullish.
BeInCrypto’s latest Bitcoin (BTC) analysis, click here.
What do you think about this subject? Write to us and tell us!


