


If you want to read a summary of our most recent short-term Bitcoin Cash (BCH) price analysis and predictions click here.
Bitcoin Cash was born on Aug 1, 2017, when Bitcoin (BTC) hardforked. There have been many Bitcoin hard forks, but Bitcoin Cash remains the most well-known.
It was developed to increase Bitcoin’s block size. This would allow more transactions to be held within each block. In turn, more transactions could be processed in a shorter period of time with lower fees.
This seemed like a reasonable solution to the scalability problem which has plagued Bitcoin since its birth. However, there were many who believed that Bitcoin should not change.
There is evidence to support their claim. Bitcoin still has the highest market cap and remains the dominant cryptocurrency despite many hard forks.
On the contrary, Bitcoin Cash experienced a contentious hard fork in 2018—around a year after the initial Bitcoin hard fork causing losses to price and market cap. Furthermore, the Bitcoin Lightning Network promises another solution to the scalability problem that might make Bitcoin Cash a redundancy
Regular Price Analysis and Predictions for Bitcoin Cash
Bitcoin Cash reached a low of $261.48 on May 2. A rapid increase ensued and the price reached a high of $310.0 on May 4. It has been decreasing since.
The price is trading inside the symmetrical triangle outlined below:
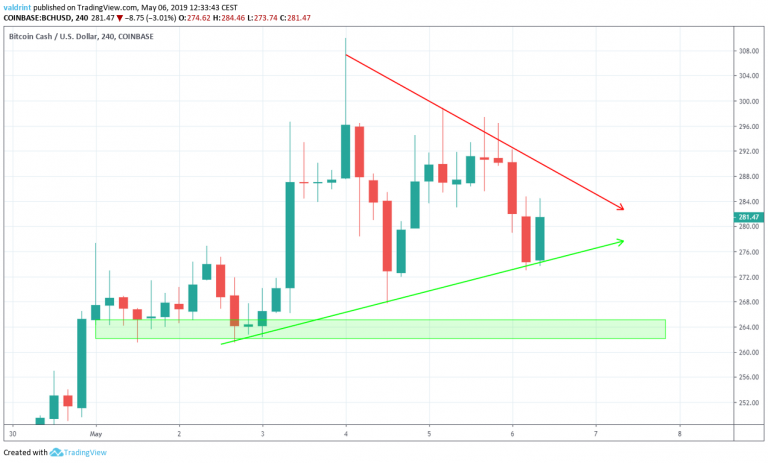
At the time of writing, the price was trading close to the support line of the triangle.
According to our latest analysis, we believe that the price will break down from the triangle and head towards the support area near $264.
To read our full May 2 BCH/USD and BCH/EUR analysis and price predictions, click here:
Oh Look, There’s More…
- Fundamental Analysis
- Technical Analysis
- Bitcoin Cash Price Prediction 2019
- Bitcoin Cash Price Prediction 2020
- Bitcoin Cash Price Prediction 5 years
- Conclusion
Fundamental Analysis
From a fundamental perspective, Bitcoin Cash is struggling to remain relevant. Though it initially appeared to offer a novel solution to the scalability problem, it has become quite problematic.
After a contentious hard fork in 2018, it is unclear if—or perhaps when—another hard fork might occur. It has been unable to compete with Bitcoin, and its competitive advantage decreases now that the Lightning Network is gaining ground.
Furthermore, recent research suggests that the actual market cap of Bitcoin Cash and other hard forks may be inaccurate. What is reported on CoinMarketCap and elsewhere, therefore, might not be a true reflection of Bitcoin Cash’s real exchange-value.
Increasing the Block Size
Bitcoin has a blocksize limited to 1 megabyte (MB). As transactions increased across the network through the 2010s, this caused slow transaction times and high fees. There developed a need to scale transactions to a reasonable level while minimizing the cost of each transaction.
A simple solution was to simply increase the block size. This was suggested. Some of the Bitcoin community accepted the idea.
Others rejected it.
Their logic was simple and valid.
They believed that Bitcoin should adhere to a specific set of rules and not deviate. An increase to the block size would be a deviation from these rules. Therefore, such an increase should not occur.
While a soft fork may have been able to increase the block size without issue, the contention led to two camps: those supporting a 1MB block and those who supported an increase.
A hard fork occurred on Aug 1, 2017. Bitcoin Cash split from the Bitcoin blockchain with its own set of rules and protocols.
Versus the Lightning Network
The Lightning Network poses another solution to the scalability problem.
The Lightning Network does not require a hard fork. Instead, it is a second layer protocol that works on top of the first layer mainnet. Using the Lightning Network requires the creation of side chains.
The side chains allow transactions to occur off the mainnet and then to be attached to the mainnet at a later date. This means that tens, hundreds, or thousands of transactions can be bundled into two transactions:
One transaction to open to side chain and one transaction to validate the transactions onto the mainnet.
Like Bitcoin Cash, the Lightning Network decreases transaction fees while increasing the total number of transactions that can occur per second using Bitcoin.

On Mar 15, 2019, the Lightning Network turned one year old. As a birthday gift, the Lightning Network exceeded 1,000 BTC capacity on the same day.
As the Lightning Network gains adoption, Bitcoin Cash may fall behind. Bitcoin gains a further competitive advantage over Bitcoin Cash with the integration of the Lightning Network.
The Bitcoin Cash Civil War
An 8MB block size was not enough for some. On Aug 16, 2018, Jimmy Nguyen of nChain announced Bitcoin SV in a press release. It was described as:
“A new full node implementation of the original Bitcoin protocol now restored in the form of Bitcoin Cash (BCH).”
It was developed to make several changes to Bitcoin Cash including an increase of the block size to 128MB. The idea was heartily rejected by many in the Bitcoin.
On Aug 20, 2018, Bitcoin ABC was announced to make much more extensive changes to Bitcoin Cash.
We have just published “The Bitcoin ABC Vision” which describes our suggested path ahead for the technical development of Bitcoin Cash: https://t.co/r1U1gmCynD
— Bitcoin ABC (@Bitcoin_ABC) August 24, 2018
This led to contention. A hard fork occurred on Nov 15, 2018. Bitcoin ABC has almost been unanimously accepted as the real Bitcoin Cash and is listed as such on Kraken, Huobi, CoinMarketCap, and many other places.
Binance, however, lists BCHABC and BCHSV. There remains contention over which coin should be called what, but for the sake of ease, we’re taking the side of the majority: Bitcoin ABC is Bitcoin Cash.
Not that it necessarily matters. As long as Bitcoin Cash continues facing contentiousness, it will struggle to maintain a unified community. Adoption and usage of Bitcoin Cash are impeded by these hard forks and the problems that now arise with naming the cryptocurrencies.
Without a universally accepted method of reference, the ability to even discuss Bitcoin Cash lessens. There seems little reason to use Bitcoin Cash when a number of other better option remain available.

Technical Analysis
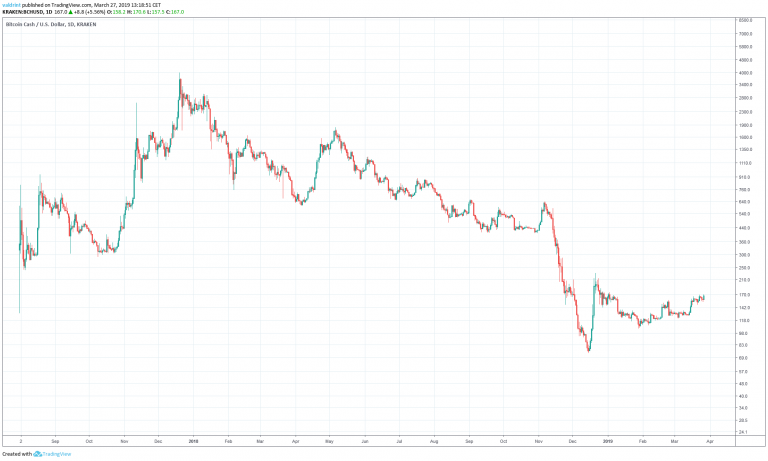
On Aug 11, 2017, BCH reached a low of $130. A sharp increase took prices to over $900 before the end of the month. By October, BCH had reached lows under $300.
A much more significant and rapid spike brought BCH to an all-time high of $4000.10 on Dec 17, 2017. Price losses followed with a bottom of $599.60 reached on Apr 6, 2018.
Only one month later, BCH had again tripled in value reaching a high of $1834.80 on May 6.
Price steadily dropped throughout the rest of the year. On Dec 14, a bottom of $73.60 was reached. Values over $200 were reached by the end of the month.
At the time of writing on Mar 27, 2019, BCH was trading around $170.
Relevant upward trends are listed below with the lows and highs experienced at the respective beginning and end of each:
It appears that there have been two significant uptrends that reached consecutively lower highs despite higher lows. A third high was reached on Dec 15, 2018. It is lower than both the first and second high.
Using these figures and trends, we will attempt to isolate patterns that might determine future price values. The hard fork in 2018, however, may have caused unnatural fluctuations to price. This means that any predictions made about Bitcoin Cash must be approached with caution and skepticism.
RSI Similarities
To begin, we seek to isolate similarities between these upward trends within the technical indicators. To begin, we examine the similarly high relative strength index (RSI) ratings during each low.
The price of BCH on Kraken is analyzed at 12-hour intervals from Aug 11 2017 to Mar 27 2019 alongside RSI in order to figure out where our current position is relative to two lows experienced in 2017:

To better visualize large price fluctuations, logarithmic charts are going to be used in this analysis.
Furthermore, the upper limit of the RSI is put at 20, therefore only values lower than that are visible.
The RSI reached a low of 19.5 on Apr 2, 2018, five days before the $599.60 low. A similar low of 18.6 was reached on Dec 13, 2018, one day before the $73.60 low
This may suggest that RSI may reach similarly low levels below 20 shortly before the date in which it reaches a low.
Therefore, we may have the first similarity between the Dec 2018 low and the Apr 2018 low: Oversold RSI values(<20) were reached on the days that corresponded with a swing low.
The RSI shows no similarities between the Dec 2018 and Aug 2017 lows.
Rate Of Change
The price of BCH on Kraken is analyzed at one-day intervals from Aug 11, 2017 to Mar 27, 2019.
This is done in order to look for other similarities between the two aforementioned lows.
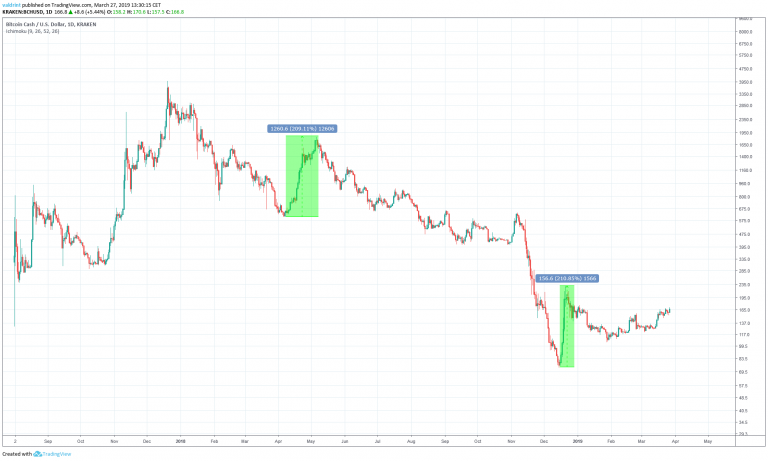
The price made a low of $599.60 on Apr 6, 2018. A sharp upward move ensued and price made a high of $1834.80 on May 6. The rate of increase measuring from bottom to top is 209%.
The price made a low of $73.60 on Dec 14, 2018. A sharp upward move ensued and price made a high of $171.70 on Dec 21, 2018. The rate of increase measuring from bottom to top is 210%.
Therefore, we have another similarity. The rate of increase from the swing low to the swing high are identical in both scenarios.
What About the Rates of Decrease?
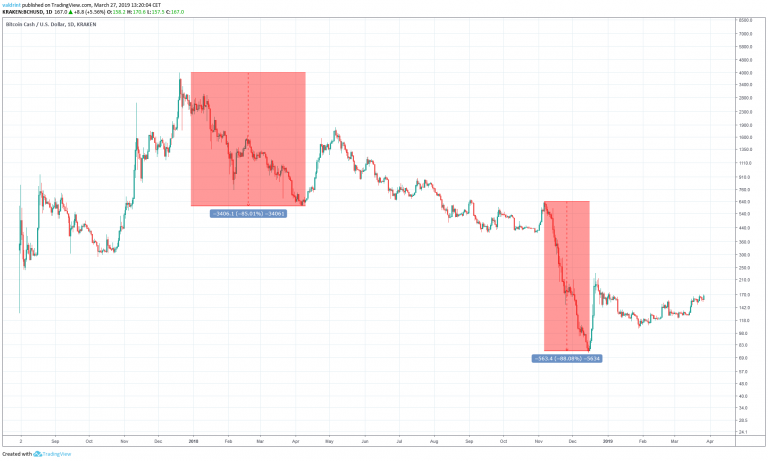
On Dec 20, 2017 the price made a high of $4000.10. Gradual and rapid drops brought Bitcoin Cash to a bottom of $599.60 on Apr 6, 2018. Measuring from top to bottom, the rate of decrease is 85%.
On Nov 7, 2018, the price made a high of $638. A sharp decrease ensued, before it made a low of $73.6 on Dec 14, 2018. Measuring from top to bottom, the rate of decrease is 88%.
Therefore, we can come to the conclusion that the rates of decrease are also similar.
Summary and Analysis of Similarities
We have established the following similarities between the Apr and Dec 2018 lows:
- Similar low RSI values
- Rate of decrease from the previous swing high to the respective low
- Rate of increase from the respective low to the next swing high
Since the rates of increase and decrease between the lows were almost identical, we are going to assume that the magnitude of all future moves will also be the same.
Using this rate, we may not be accurate in predicting future prices. However, if it proves to be correct, it can be effectively used for all future predictions.
However, we still need to figure out the relationship between the two lows in regards to time periods.
Time Periods
To determine what prices might be reached, we must determine proper time tables. These will allow us to track the length of the patterns we’ve defined above. To this, we examine the times of the two corrections.
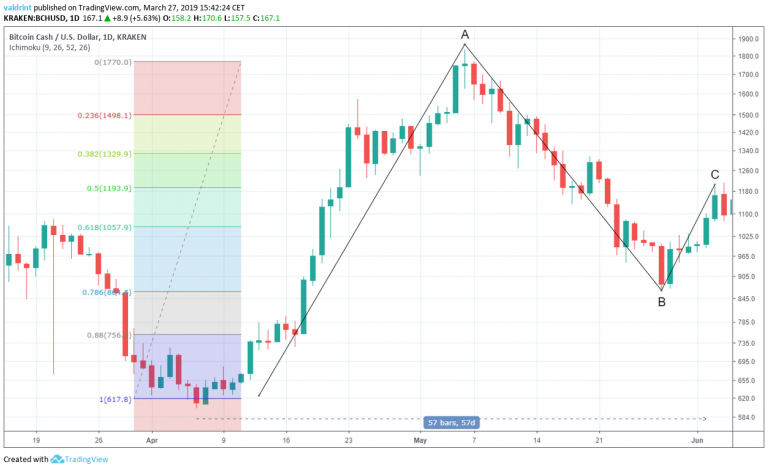
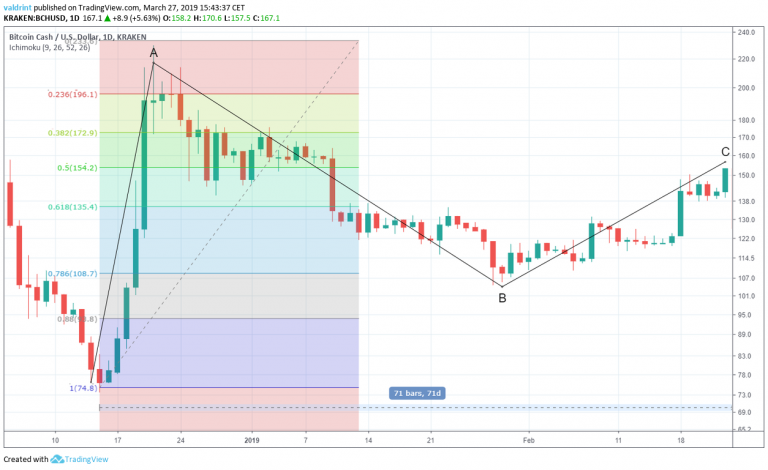
The price of BCH on Kraken is analyzed at one-day intervals from Mar 19, 2017 to Jun 3, 2017 (Top) and from Dec 9, 2017 to Feb 20, 2018 (Bottom):

The price made a low of $599.60 on Apr 6, 2017. A sharp upward move ensued and price made a high of $1834.80 on May 6.
A gradual decrease ensued, and price made a low of $870.80 on May 28. Measuring from bottom to top, this amounts to a retrace of 78.6%.
Price subsequently fell before a swing high of $1076 was reached on Jun 4. Measuring from bottom to top, this amounts to a retrace of 61.8%
It took 57 days for this entire movement to materialize.
The price made a low of $73.60 on Dec 14, 2018. A sharp upward move ensued and price made a high of $171.70 on Dec 21, 2018.
A gradual decrease ensued. BCH made a low of $104.60 on Jan 28, 2019. Measuring from bottom to top, this amounts to a retrace of 78.6%.
Afterward, Bitcoin Cash made a swing high. It reached $157.10 on Feb 24. Measuring from bottom to top, this amounts to a retrace of 61.8%
It took 71 days for this entire movement to materialize.
Now, we have another similarity between the two movements: After reaching lows, they both experienced two swing highs. The rate of increase in both instances was nearly identical.
Furthermore, we have a time ratio we can use to predict future price behavior.
Movements in the Dec, 2018 low took1.24 times longer (71/57) than those on the Apr, 2018 low.
NOTE: A recent increase in the price of BCH on Mar 17 seems to go contrary to the pattern we have identified until now. However, the pattern is meant to be used for long-term analysis, and we do not believe that the price will act in an identical manner every step of the way. Therefore, we believe that the prices will eventually revert back to the mean.
BCH Price Prediction 2019
In order to figure out the price at the end of 2019, we will use the 1.24 rate of time and apply to find the date after the Apr 2018 low which corresponds to Dec 31, 2019.
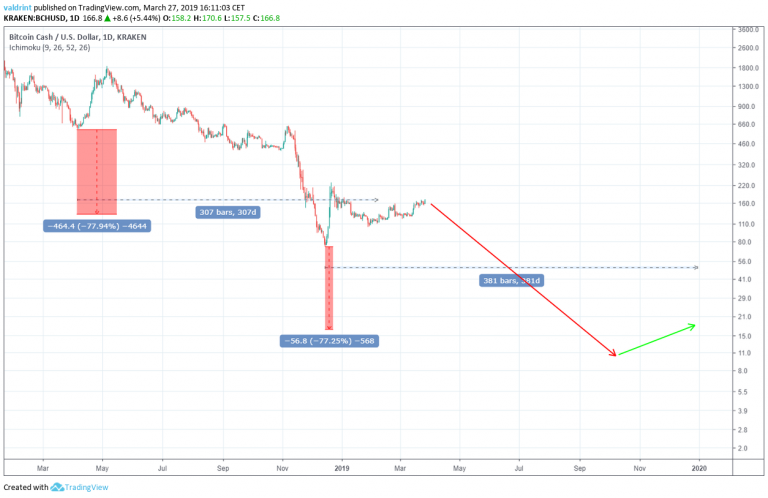
On Feb 8, 2019, 398 days after the $599.6 low, the price reached a value of $131. Measuring from the $599.60 low, this is a 77% rate of decrease.
Using the same rate of decrease from the $73.60 low gives us a price of around $16.50 on Dec 31, 2019.
It is worth mentioning that using this pattern will give us a low of $9.50 on Oct 24, 2019.
Bitcoin Cash Price Prediction 2020
In order to figure out the price at the end of 2019, will use the 1.24 rate of time and apply to find the date after the Apr 2018 low which corresponds to Dec 31, 2019.
However, the date corresponds to a future date. Furthermore, it corresponds to a date after the projected pattern has already finished. After the projection is finished, it is likely that the price will not repeat the same movement again.
However, for the sake of the analysis, we are going to make this prediction assuming that after the price makes the low of $9.5 mentioned in the previous section, it will start another movement which is identical to the ones started after Apr and Dec 2018 lows.
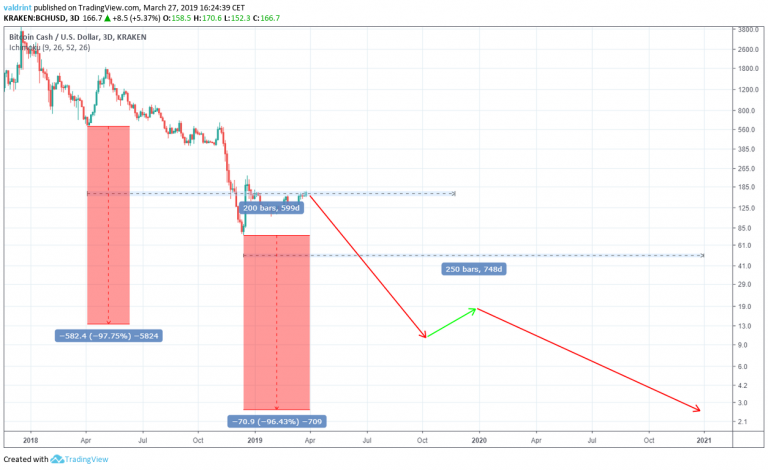
On Nov 24, 2019, 599 days after the $599.60 low, the price reached a value of $13. Measuring from the $599.60 low, this is a 97% rate of decrease.
Using the same rate of decrease from the $73.60 low gives us a price of around $2.70 on Dec 31, 2020.
Bitcoin Cash Price Prediction 2021
The BTC price movement since we first made our predictions has in turn invalidated them, since BCH has increased in value instead. This confirmed that the similarities based on the rate of time and RSI were not sufficient to predict the future price movement. This also gets more complicated because of the aforementioned fork, which split BCH into two.
Therefore, the inability to used indicators forces us to use a trading pattern, in this case the ascending triangle. While the rate of increase could be predicted accurately with this method, the rate of time will likely be inaccurate.
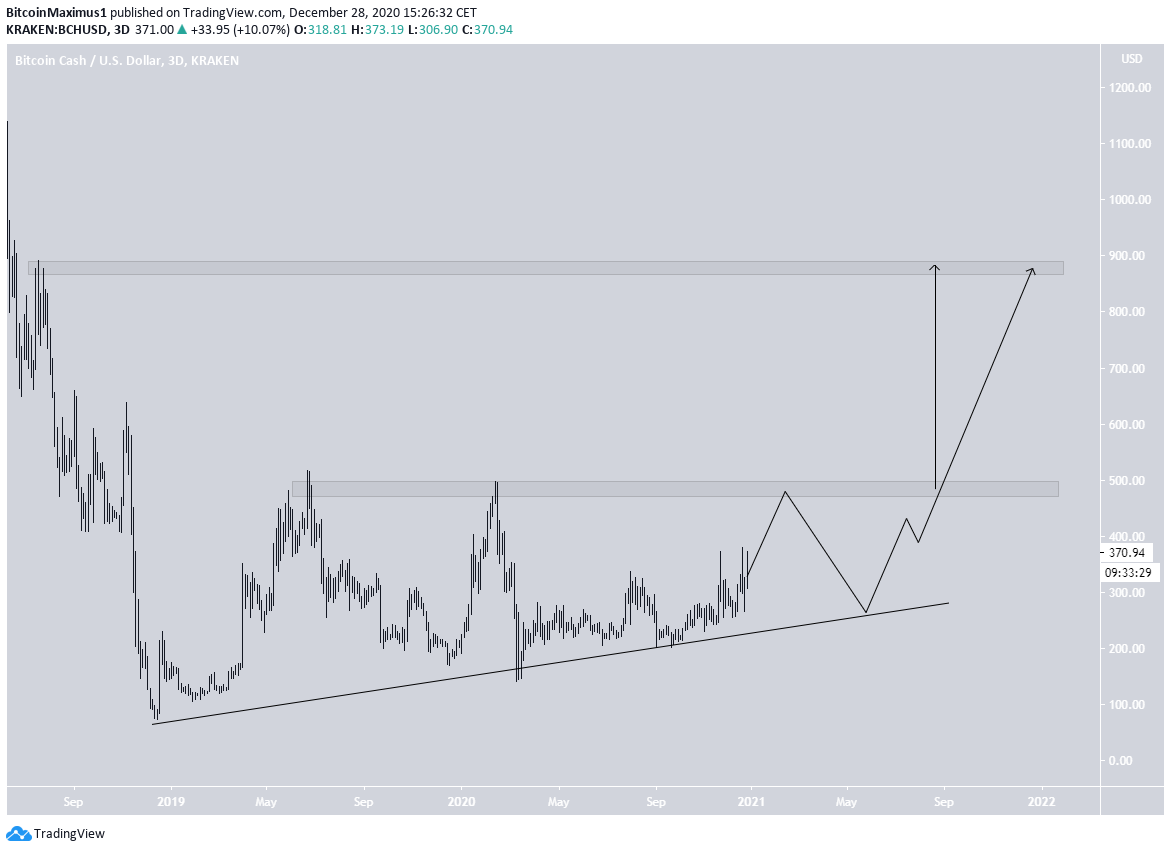
Nevertheless, BCH has been trading inside a very long-term ascending triangle since the beginning of 2019, with the main resistance area being at $460.
If BCH continues consolidating inside this triangle towards the point of convergence between support and resistance, it is on track for a breakout towards the end of 2021.
A breakout that travels the entire height of the pattern would take BCH all the way to the next closest resistance area at $880.
Since the breakout is expected near the end of the year, a price near $880 is expected on Dec. 31, 2020.
Summary of Analysis
There are several similarities between the Apr 2018 low and the current one in Dec 2018.
- Very similar RSI levels are generated at their respective lows.
- The rate of decrease from the previous swing high to the respective low
- The rate of increase from the respective low to the next swing high
- Similar time periods of movement after the high.
The following predictions are made with the assumption that price will follow the pattern laid out in the previous correction and on the time tables we defined:
- A low around $9.50 could be reached in late October 2019.
- Bitcoin Cash could be trading around $16.50 in December 2019.
- Bitcoin Cash be trading around $2.7 in December 2020.
Until these prices are validated, the patterns we defined cannot be considered accurate indicators of future prices. Validation of these prices, however, would also validate the accuracy of the pattern we have isolated. At the end of 2019, we will return to these predictions to assess whether the pattern appears to be holding true or not.
Since the rate of increase has differed considerably, the use of a trading pattern has been required in order to determine the BCH price in the end of next year.. Doing so gives us a price near $880 for Dec. 31, 2020.
Bitcoin Cash Price Prediction 5 years
Approaching the five-year mark in and of itself is a feat that few cryptocurrencies survive long enough to see. In five years, significant changes can be expected both to the capabilities of the Bitcoin Cash (BCH) platform, and its price, which could very see it exceeds it $4,000 all-time high.
Forecasting the long-term price of a cryptocurrency that only recently saw its first birthday is a tricky endeavor, particularly a cryptocurrency that appears to be losing ground against its main competitor — Bitcoin (BTC).
In order for Bitcoin Cash to see significant gains in the next five years, it must address several of its major shortcomings, particularly user adoption. If Bitcoin Cash manages to capitalize on the momentum of Bitcoin and produce a proven scaling solution, it might then be considered competitive again.

Conclusion
Bitcoin Cash lacks the competitive advantage of other cryptocurrencies including Bitcoin. It also is still relatively new, yet has already faced major contention leading to a heat Civil War between Bitcoin SV and BCH/Bitcoin ABC. While it emerged as a solution to Bitcoin’s scalability problem, other solutions like the Lightning Network have emerged.
Bitcoin Cash and all its hard forks appear as redundant. It seems only to have created trouble for itself, and these problems have at times reverberated throughout the cryptocurrency and digital asset market. While Bitcoin Cash appears to perform well, its overall market cap may be inflated.
Steady and heavy price losses are expected between 2019 and 2020. Whether or not Bitcoin Cash will survive another five years is a very important and relevant question. It could be possible based on its current position that BCH will have dropped out of the cryptocurrency race within the early 2020s.
What do you think of our price prediction for Bitcoin Cash (BCH) in 2021? Do you think Bitcoin Cash can ever compete with Bitcoin? Let us know your thoughts in the comments below!
Disclaimer: The contents of this article are not intended as financial advice, and should not be taken as such. BeInCrypto and the author are not responsible for any financial gains or losses made after reading this article. Readers are always encouraged to do their own research before investing in cryptocurrency, as the market is particularly volatile.


