
The Binance Coin (BNB) price fall has not gone rampant despite a number of negative news report. However, the drop could continue in the short-term.
Pressure is mounting on Binance after Coinbase announced that it would suspend BUSD trading next month. Moreover, Forbes accused the cryptocurrency exchange of misuse of customer funds misuse similar to that of FTX. This comes after the crypto exchange allegedly transferred $1.78 billion in stablecoins to various hedge funds.
Binance Coin (BNB) Approaches Range High
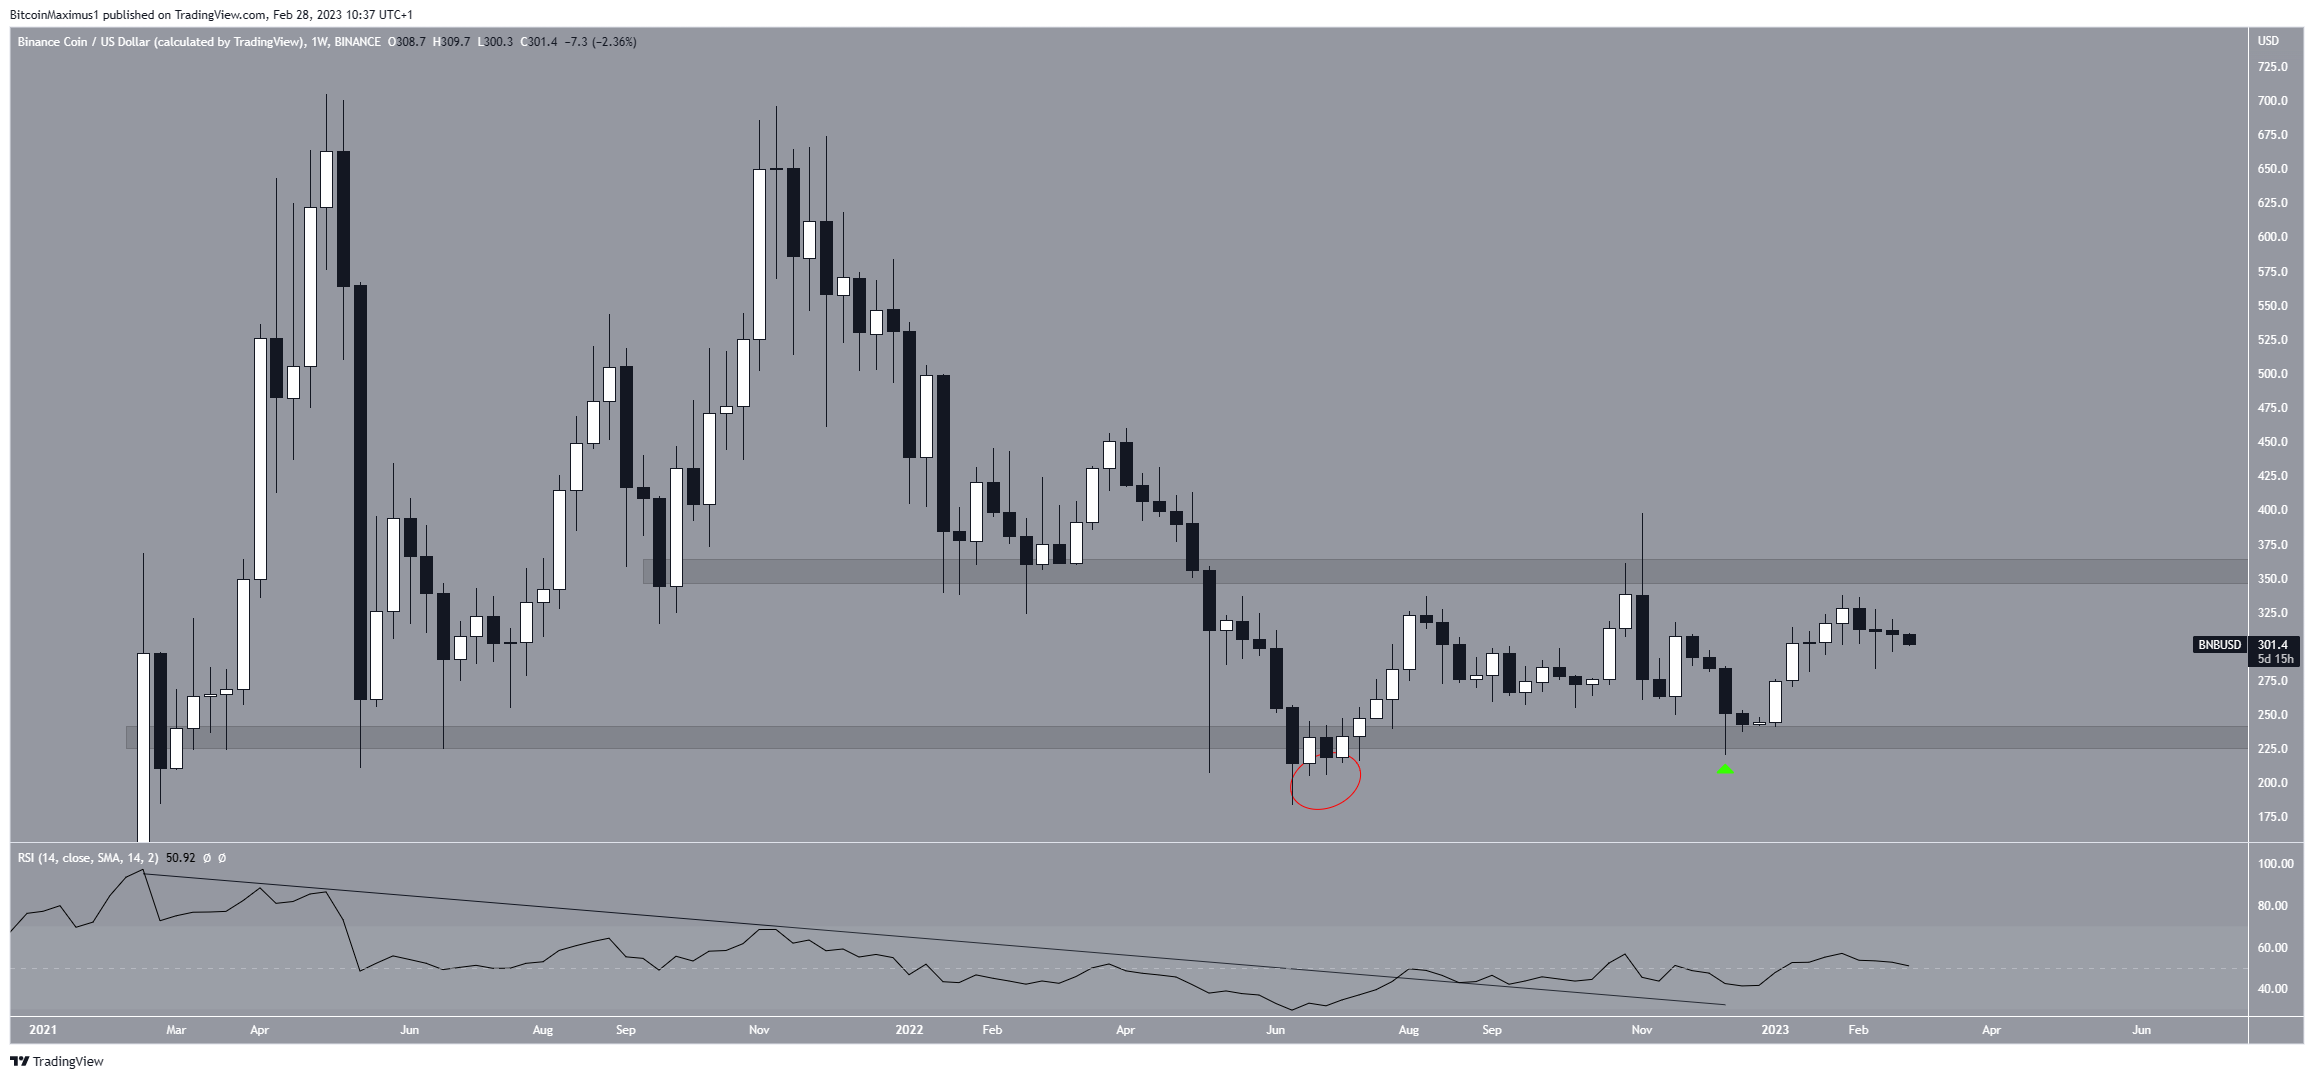
The technical analysis from the weekly time frame shows that the BNB price has traded in a range between $240 and $360 since April 2022. While the price briefly deviated below it in May (red circle), it reclaimed the area shortly afterward.
Currently, the price is trading close to the top of the range at $360 but has yet to reach it.
The weekly RSI is bullish. It broke out from a descending resistance line and moved above 50. Therefore, it supports the continuation of the upward movement.
If the BNB token price breaks out above $360, it could increase to the next resistance at $470. However, if the rally loses momentum, the price could fall back to the bottom of the range at $240.
Binance Coin (BNB) Price Searches For Support
The daily chart for BNB provides an outline for the future movement. The price has fallen alongside a descending resistance line in what is likely an A-B-C corrective structure. The entire decrease was preceded by bearish divergence in the daily RSI (green line).
Therefore, a drop to the 0.5 or 0.618 Fib retracement support levels at $278.8 and $264.9, respectively, could occur. Afterward, the long-term upward movement, as outlined in the weekly chart, could continue.
On the other hand, a breakout from the short-term descending resistance line would indicate that the correction is complete and could lead to an increase to the $360 resistance area.
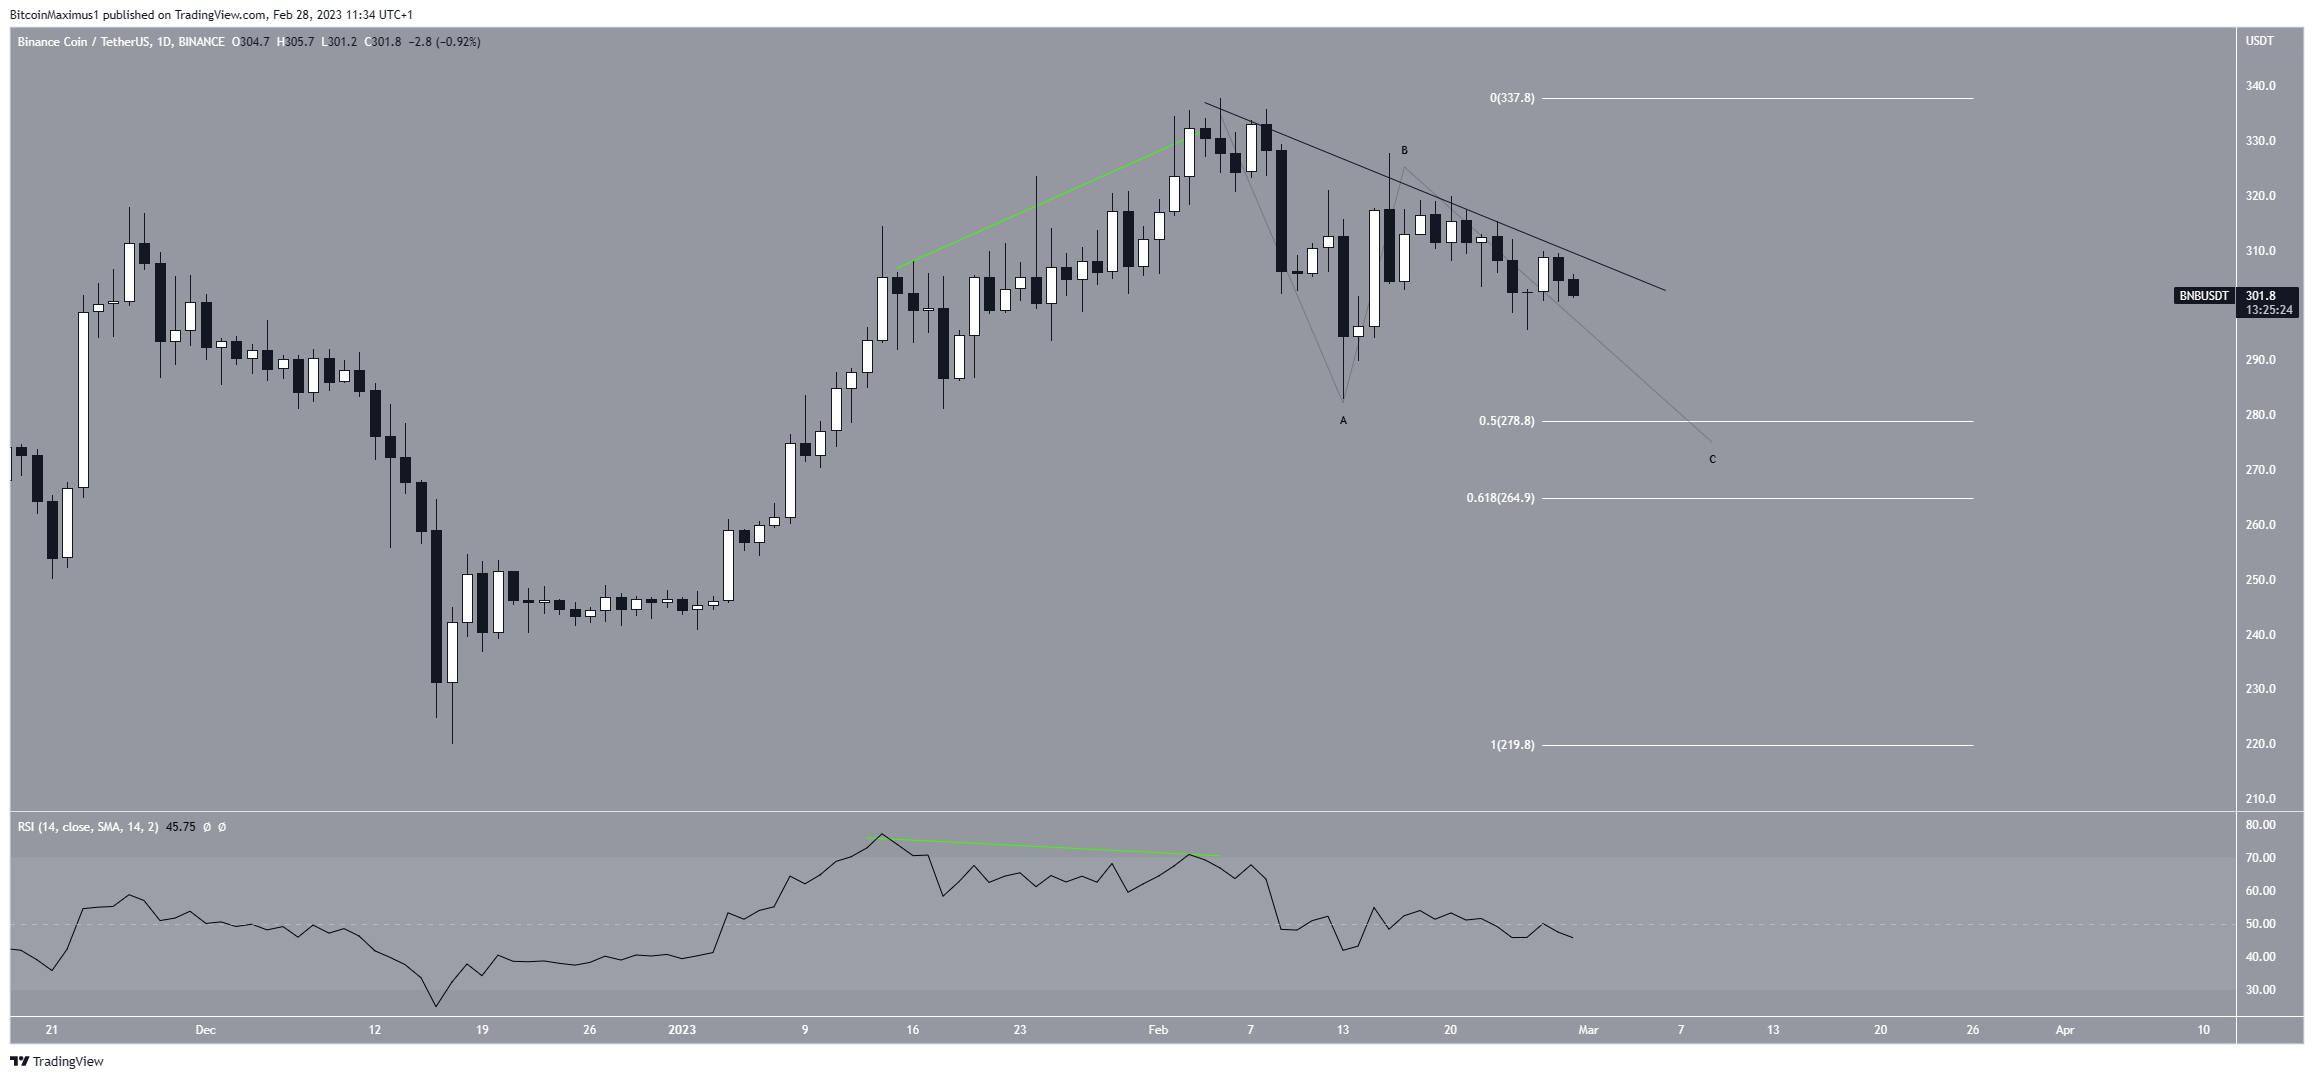
To conclude, the most likely BNB coin price forecast is a drop to $265 before the upward movement resumes. A breakout above the short-term descending resistance line would invalidate this bearish hypothesis and could lead to an increase toward the $360 resistance area.
For BeInCrypto’s latest crypto market analysis, click here.
