
Axie Infinity (AXS) has been increasing since May 28, moving upwards by 52% from its May lows.
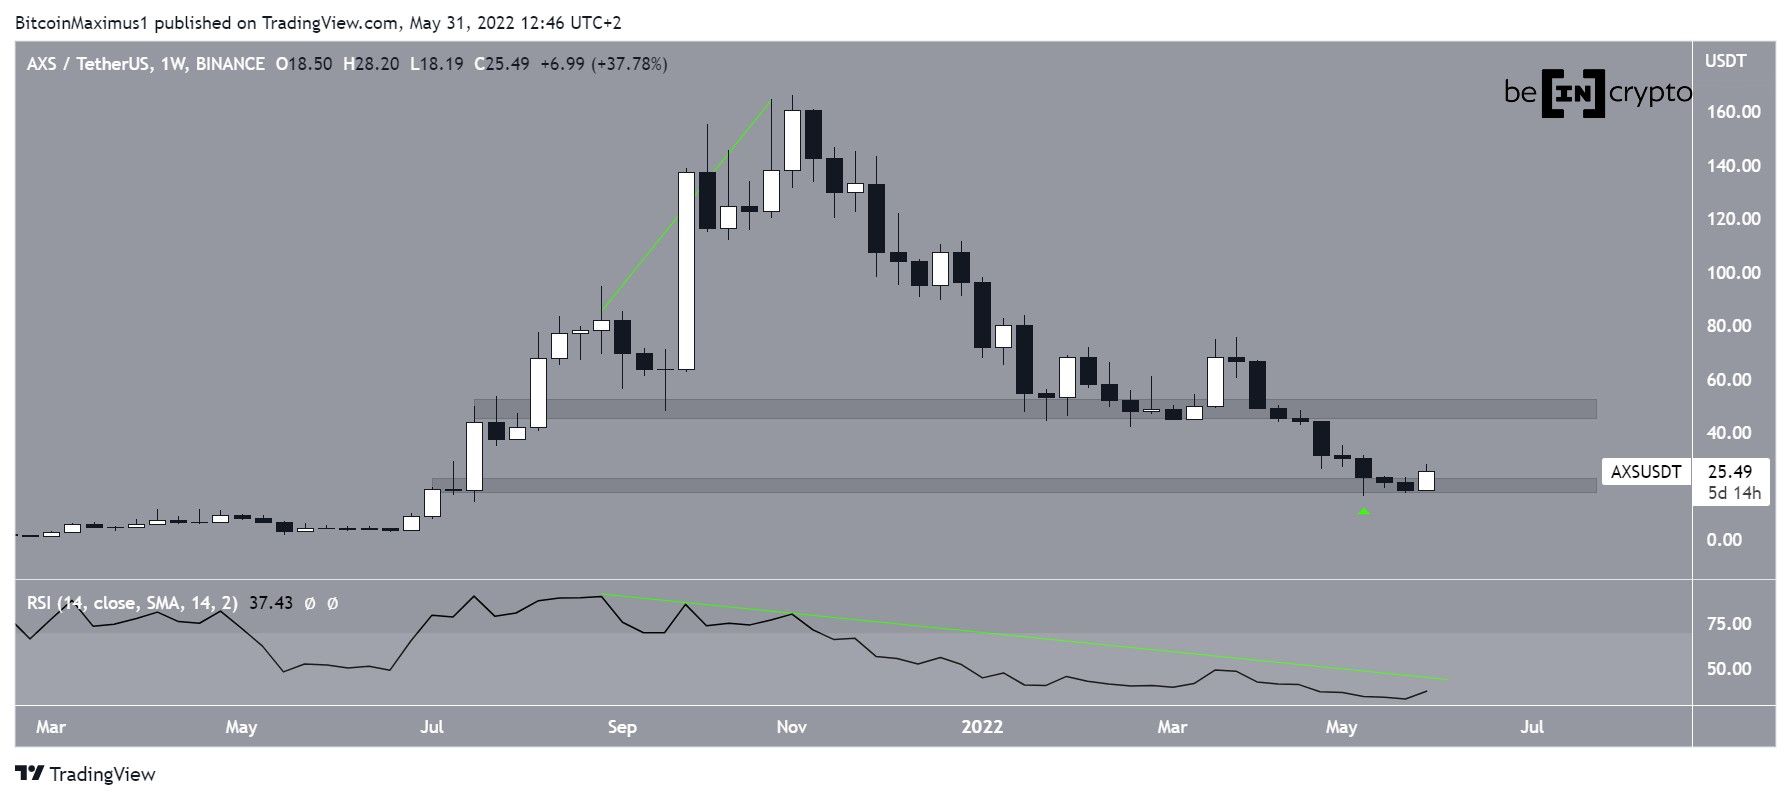
AXS has been falling since reaching an all-time high price of $166.09 in Nov 2021. The downward movement so far led to a low of $16.20 in May. The ensuing bounce (green icon) served to validate the $20 area as support. The area had previously not been reached since July 2021.
The entire downward movement was preceded by a sharp bearish divergence in the weekly RSI, whose trendline is still intact. Until this trendline is broken, the trend cannot be considered bullish. If the ongoing bounce continues, the closest resistance area would be at $50.
Double bottom leads to bounce
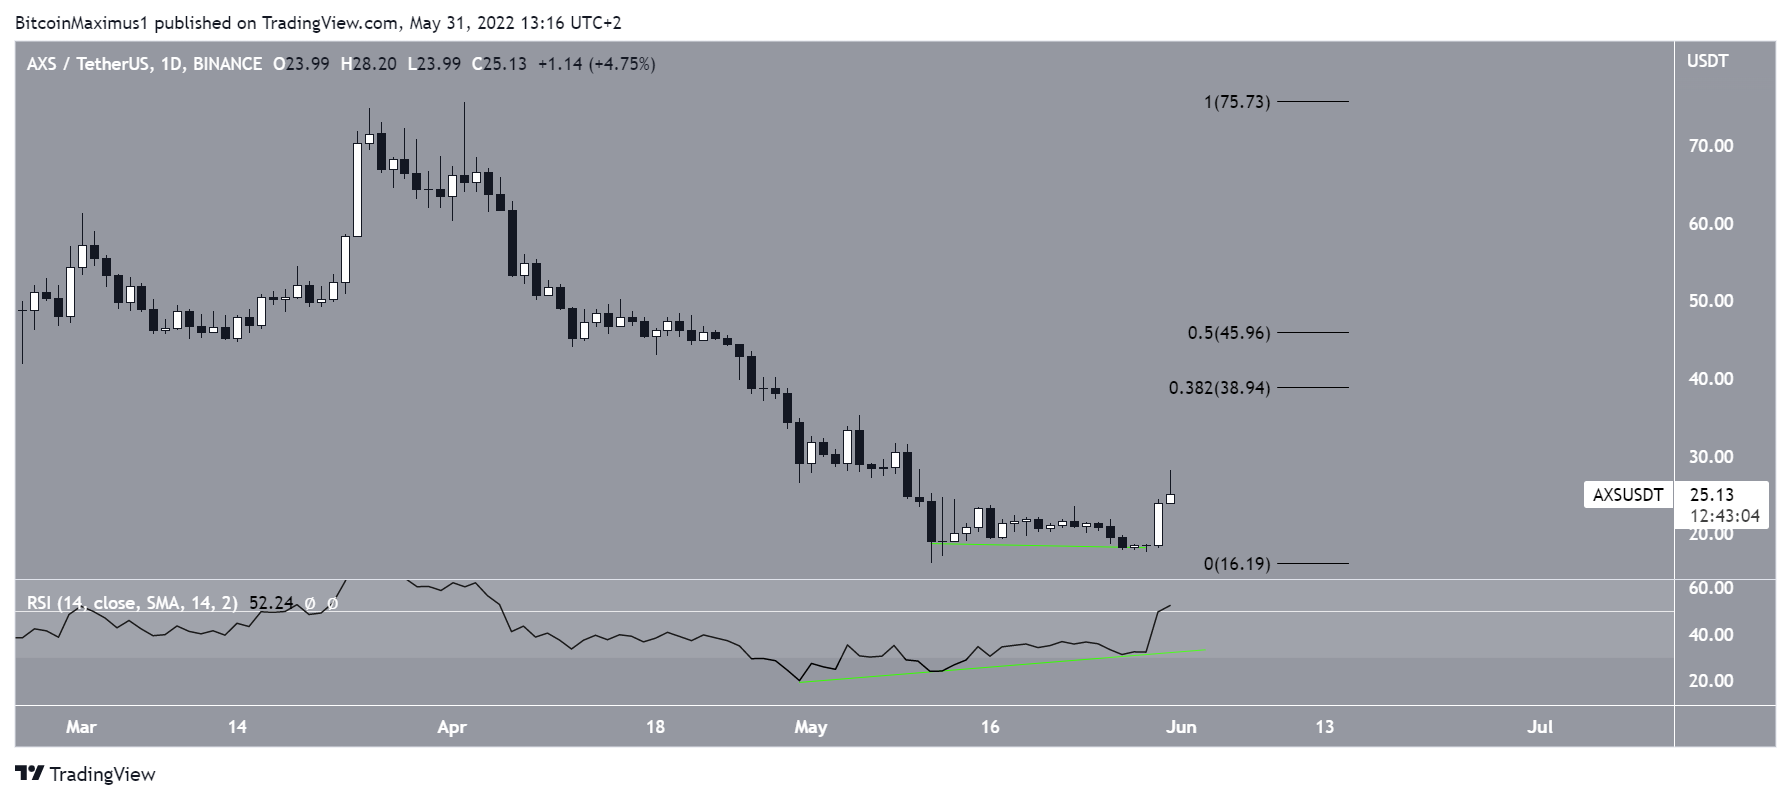
Between May 12 and 20, AXS created a double bottom, which is considered a bullish pattern. In addition to this, the pattern was combined with bullish divergence in the RSI (green line). As a result, its significance is increased. Furthermore, the RSI has now moved above 50, another sign that the trend is bullish.
As long as the trendline of the divergence is intact, it is likely that the upward movement will continue.
If it does, the closest resistance levels would be between $39 and $46, the 0.382 to 0.5 Fib retracement resistance levels.
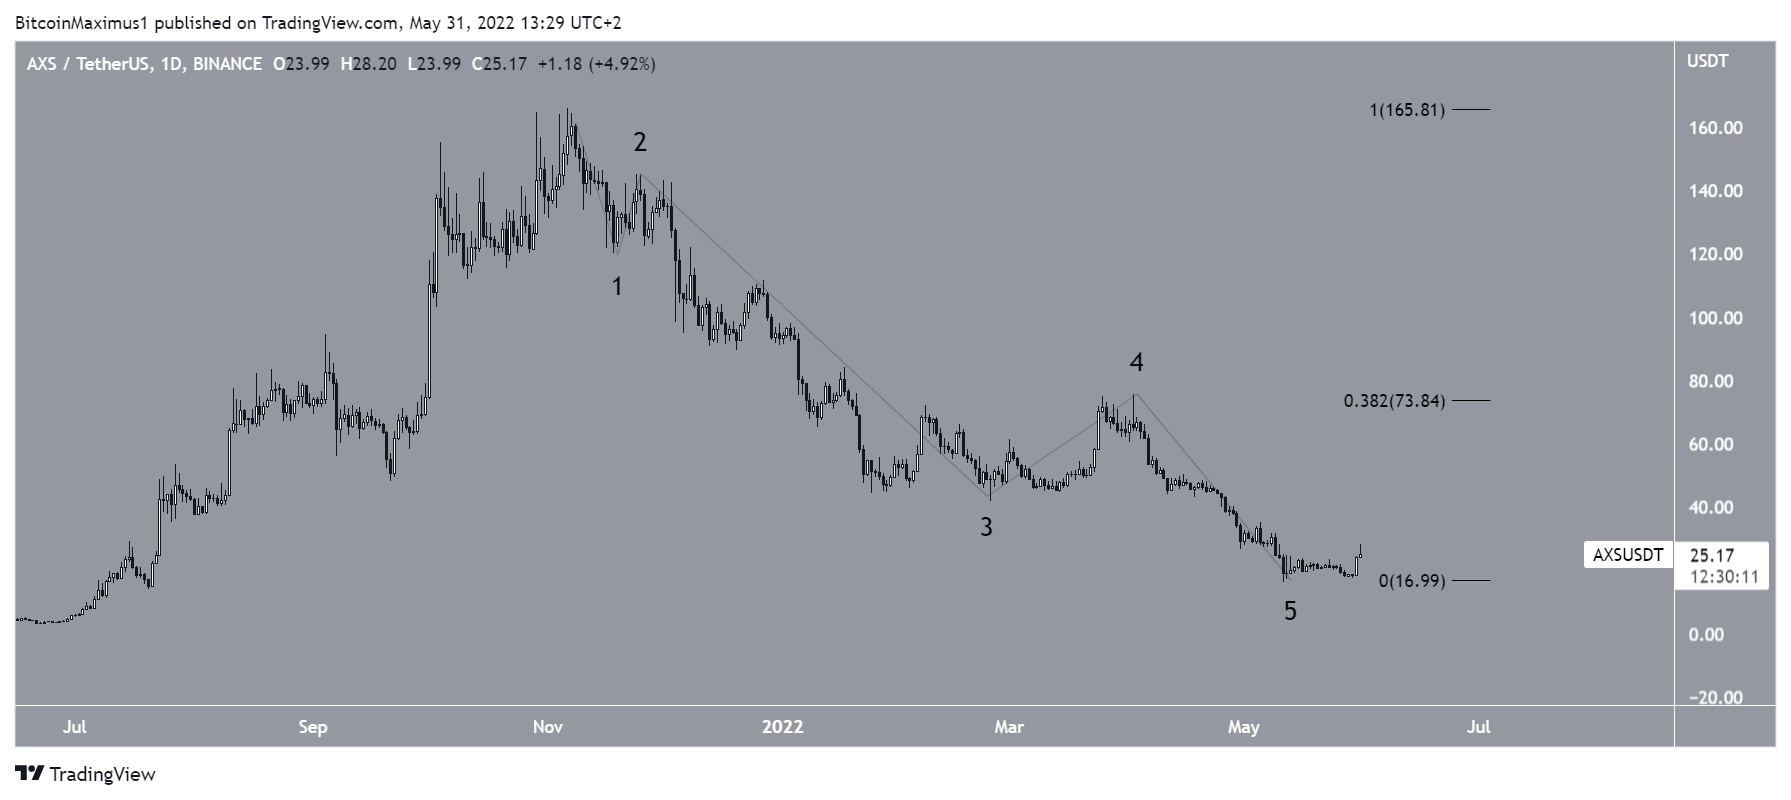
AXS wave count analysis
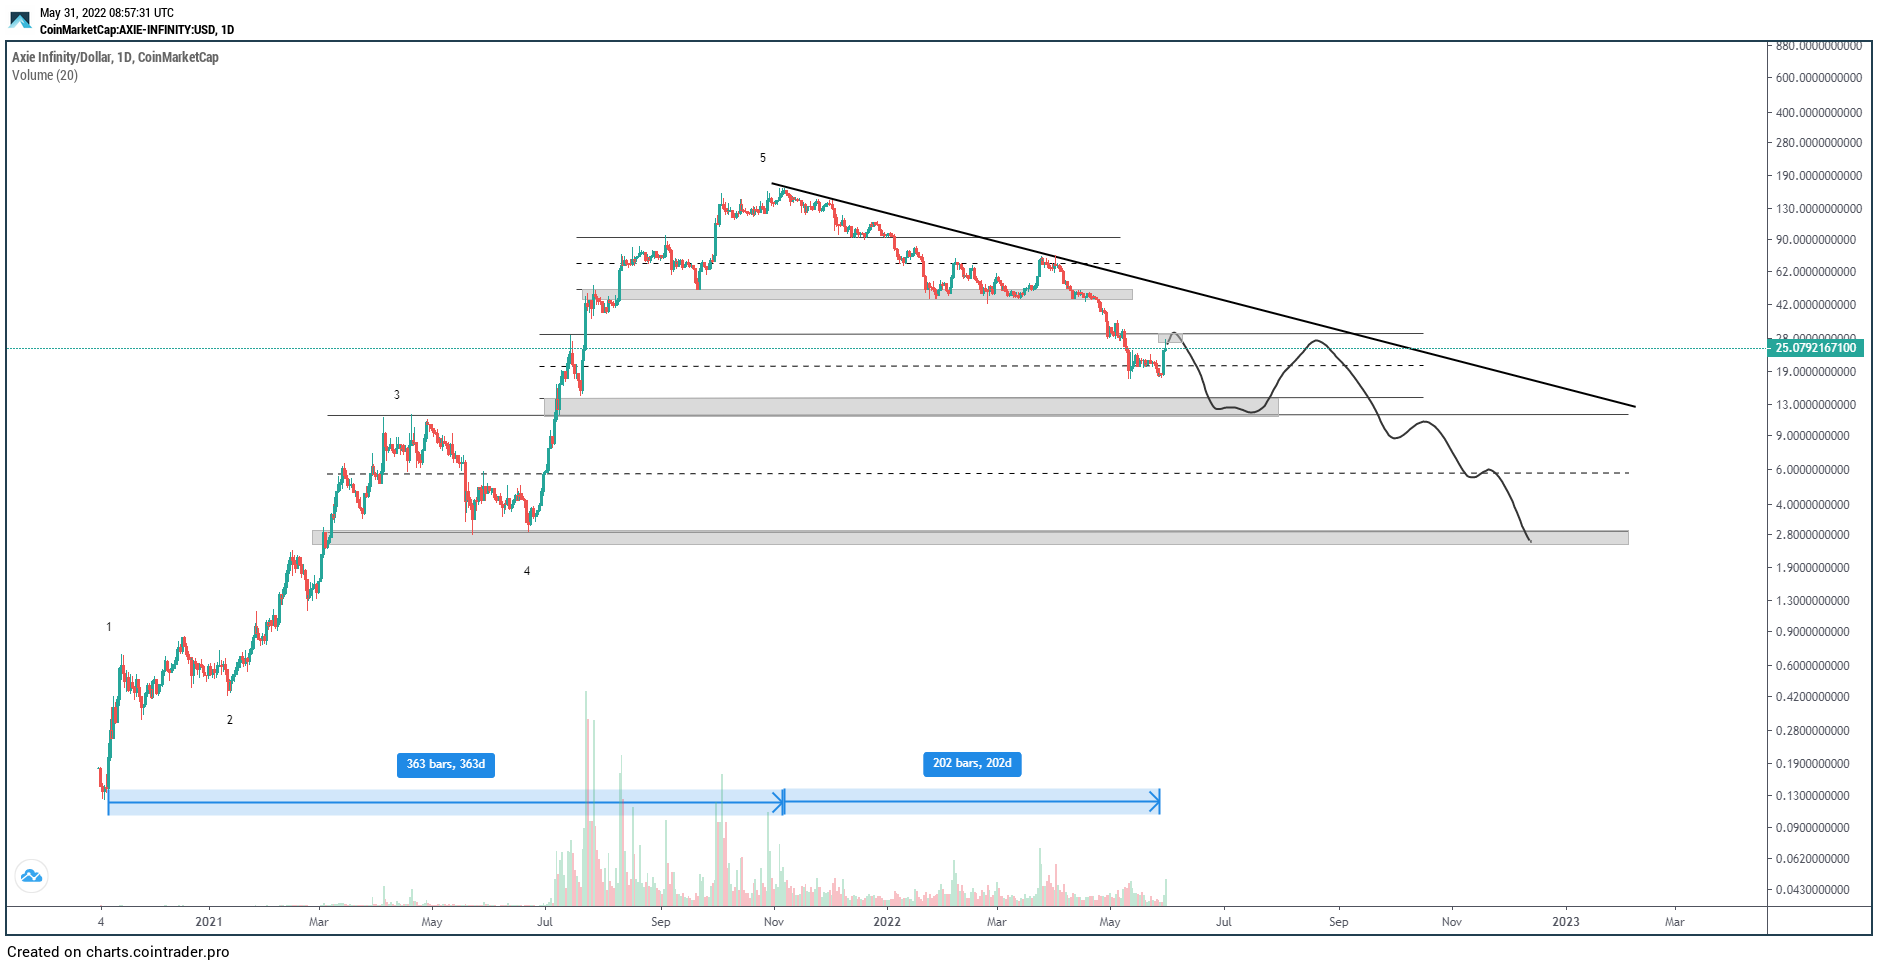
Cryptocurrency trader @Mesni_burek tweeted a chart of AXS, stating that the price is correcting after completing a five-wave upward movement.
While it seems that the price has completed a five-wave upward movement since March 2021, the count for the drop is less certain.
It is possible that the decrease is a completed A-B-C structure. But the B wave does not retrace enough relative to the A wave, and the C wave shows no relation to A.
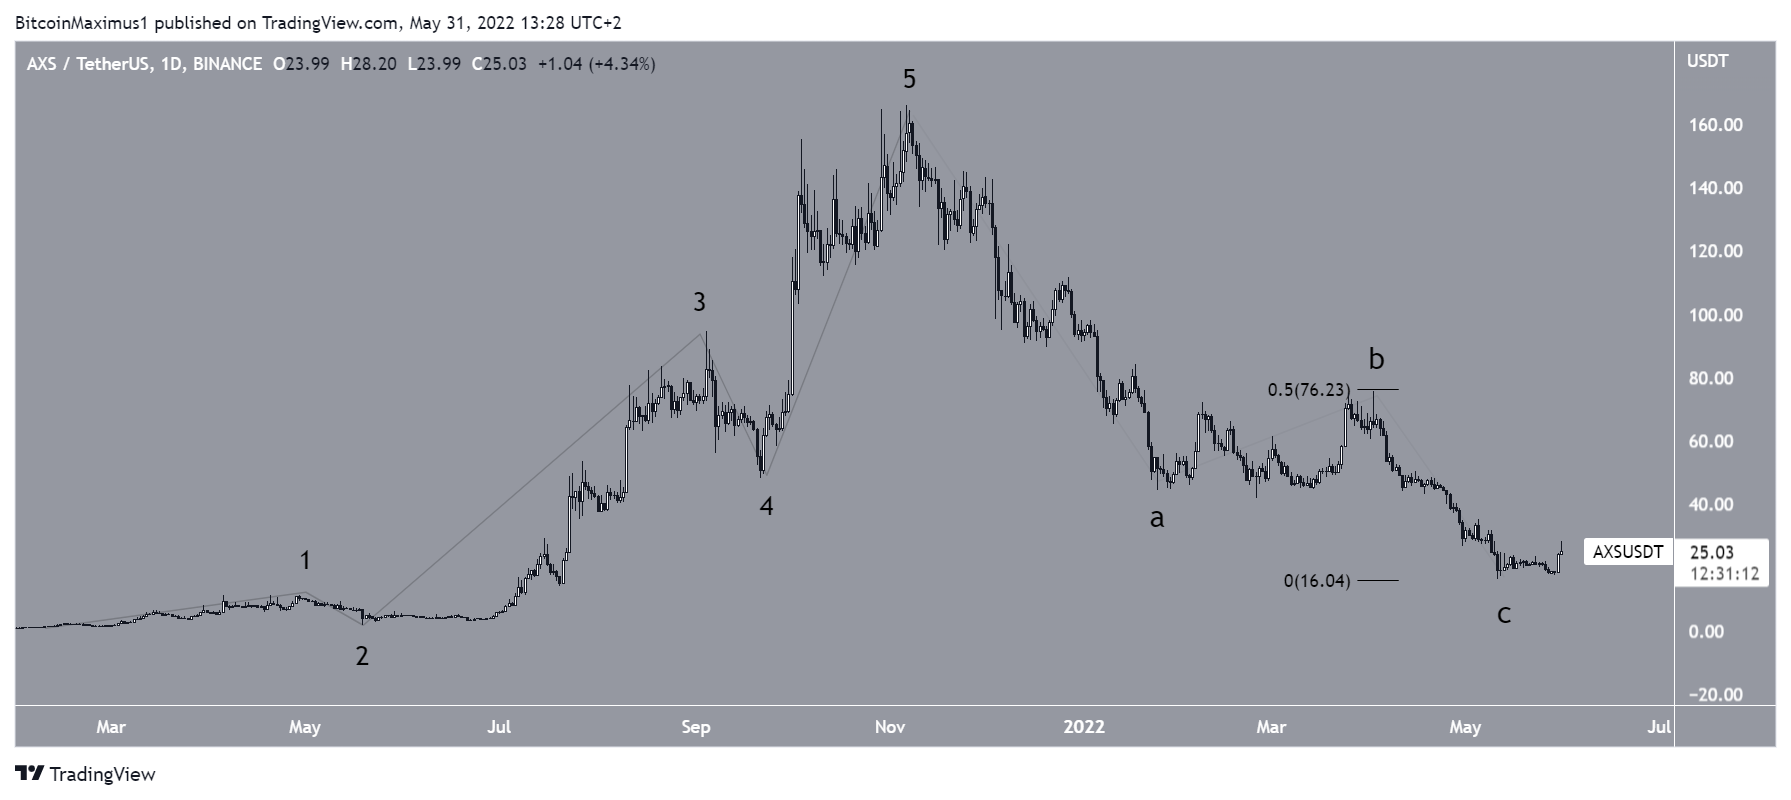
So, the alternative would be that the decrease is a completed five-wave downward movement.
While this would mean that AXS will eventually reach a lower low, the short-term movement would be the same, in which a significant bounce towards $74 would be expected.
For Be[in]Crypto’s latest bitcoin (BTC) analysis, click here
