
The Ethereum (ETH) merge went live on Thursday, but has yet to have a noticeable effect on its price. While the long-term trend is still bullish, a short-term decrease is likely to occur first.
The much-awaited Merge went live at 06:45UTC. This finally switched the consensus mechanism from proof-of-work (PoW) to proof-of-stake (PoS). With the switch to PoS, Ethereum will require 99.95% less energy to be created.
This could pave the way for environmentally conscious investors to finally jump into Ethereum. After all, it was the high carbon footprint of Bitcoin (BTC) that caused Tesla to back out of its bid to implement it as a means of payment.
However, the switch to PoS also comes with the drawback of added centralization. Currently, Lido owns nearly 31% of the total staking pool, while Coinbase owns nearly 15%.
Ongoing ETH decrease
Well-known cryptocurrency trader @CryptoCapo_ stated that he expects the ETH price to increase towards $1,800 after the Merge.
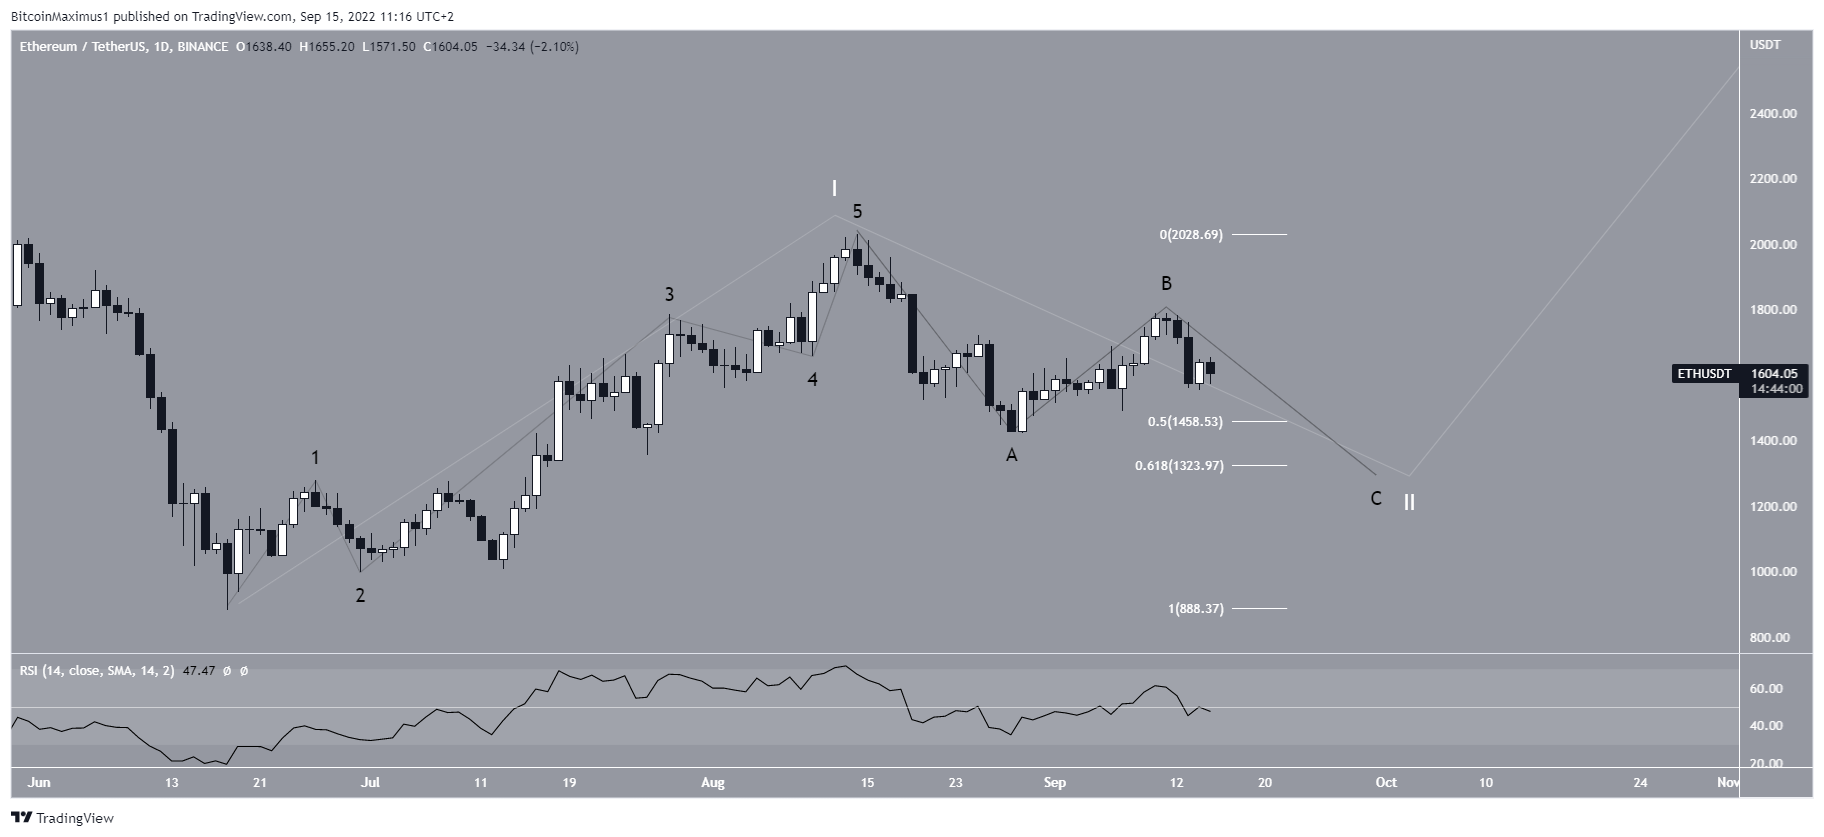
Since the Aug. 15 high, it seems that ETH has been decreasing inside an A-B-C corrective structure (black). In order for the upward movement towards $1,800 to transpire, ETH would have to still be in the B wave.
However, due to the fact that the price has been rejected by the 0.618 Fib retracement resistance level (black), it would make more sense if the B wave was already done.
The sub-wave count is given in red.
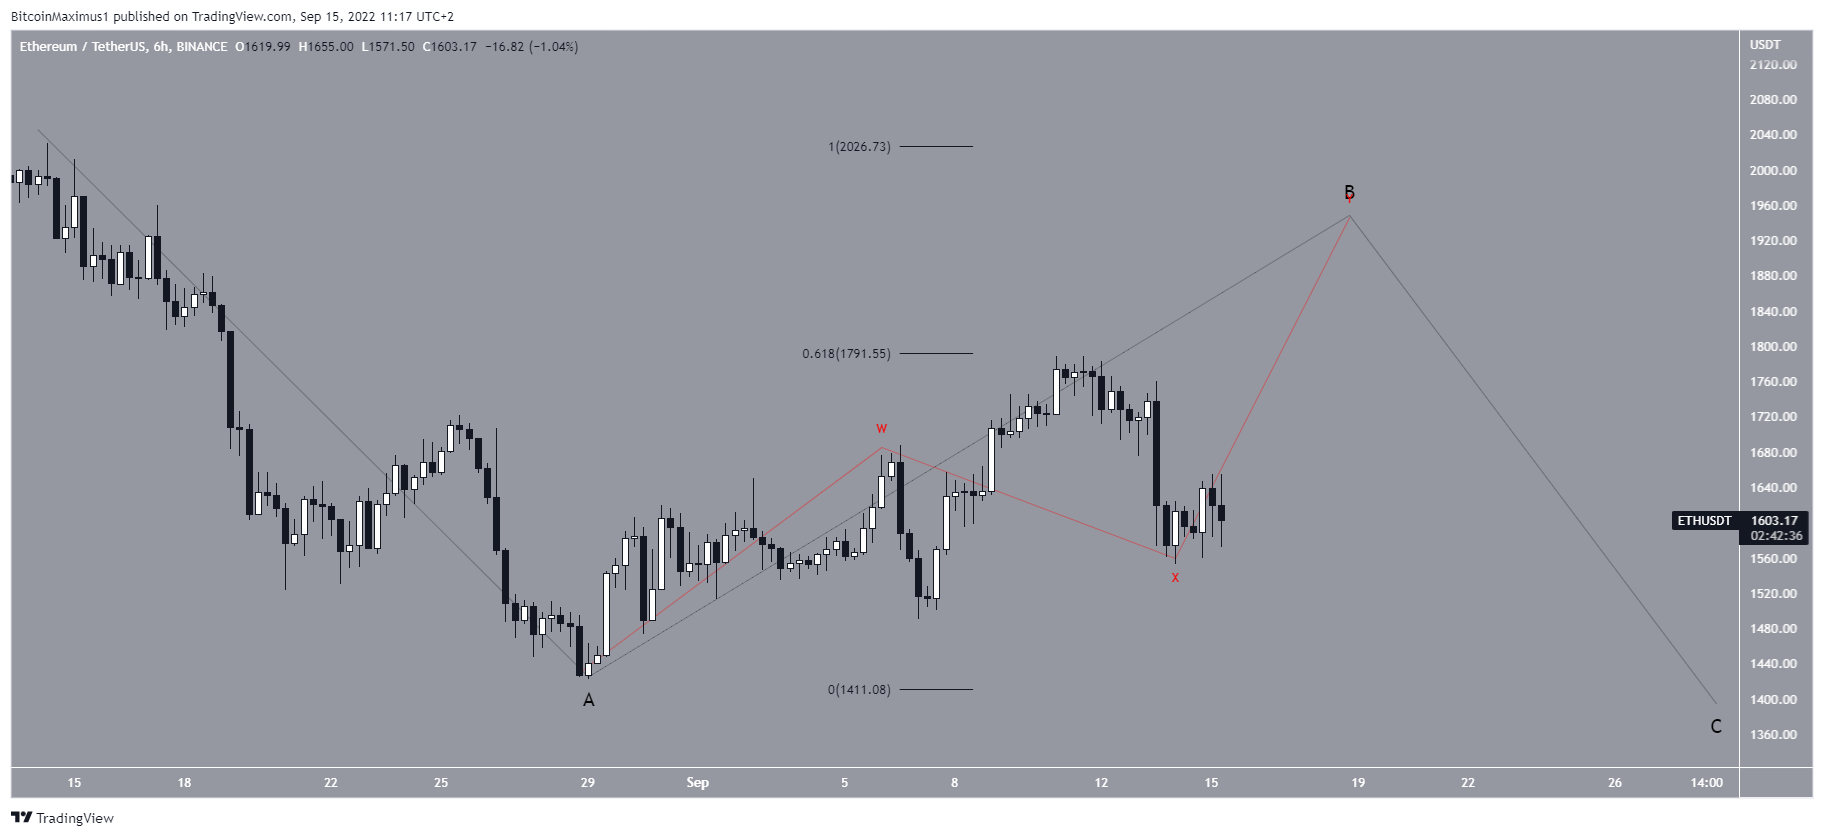
If the B wave is complete, then ETH would be in the C wave, which would be expected to end near the 0.618 Fib retracement support level (white) at $1,325.
This downward movement is supported by the fact that the daily RSI has fallen below 50.
Long-term movement
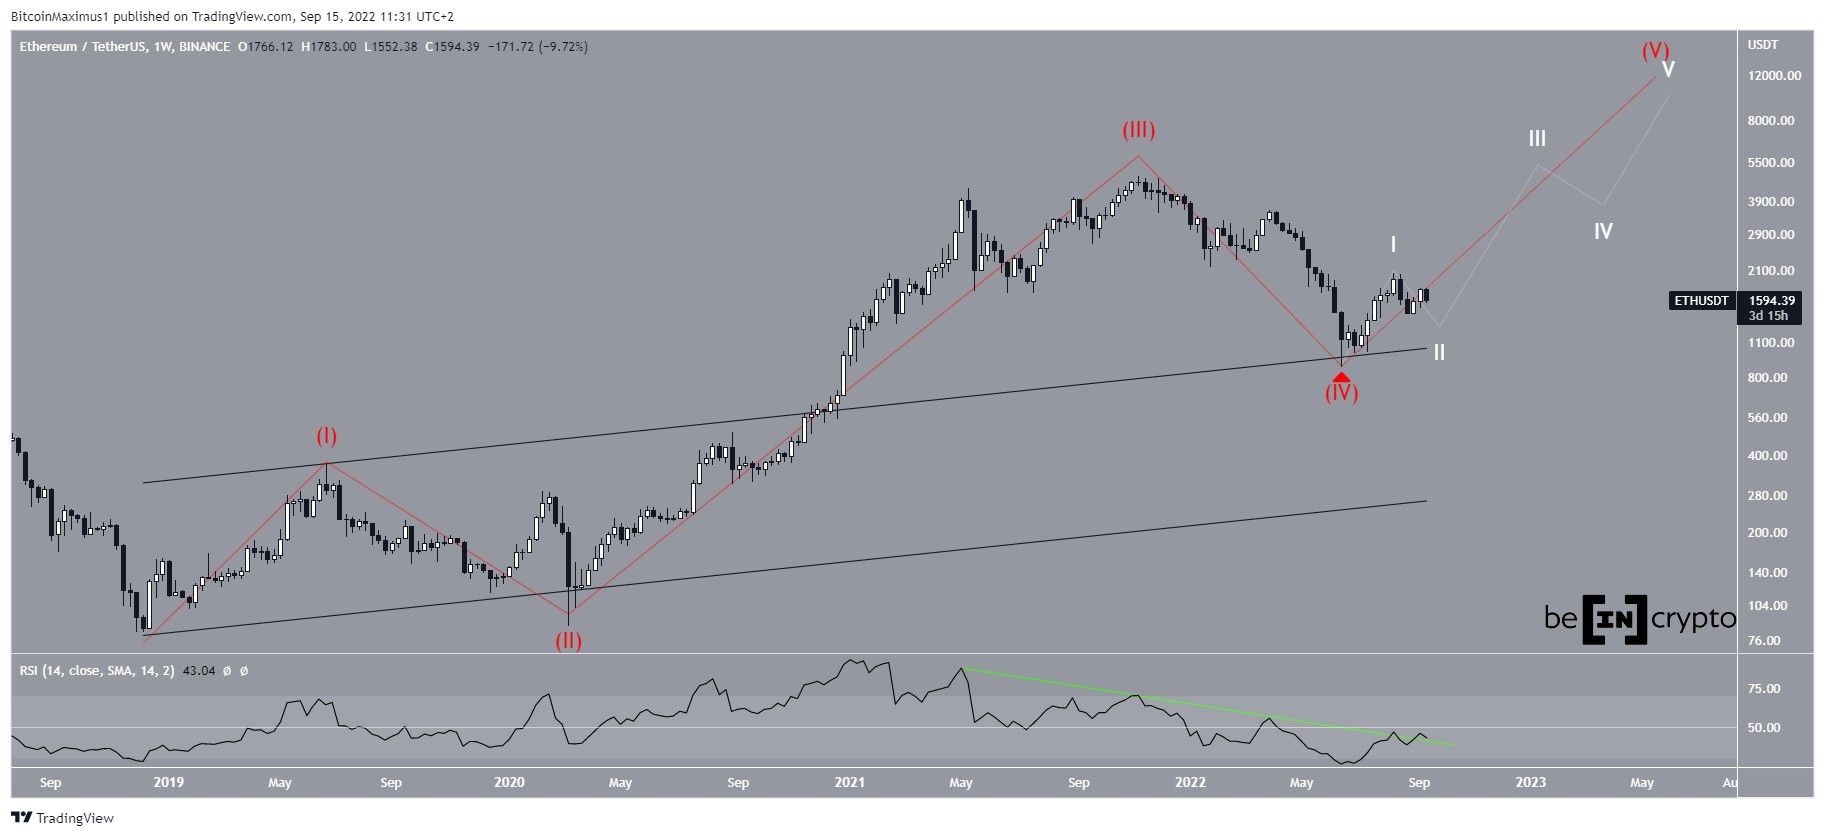
Despite the ambiguity in the daily time frame, the weekly chart is bullish, both in its price movement and technical indicators.
Firstly, the weekly RSI has moved outside its oversold territory after falling to a new all-time low in June. The previous time this occurred was in March 2020, when the entire upward movement began.
Since then, the RSI seems to have broken out from its bearish divergence trend line (green) but has yet to move above 50.
Secondly, the wave count is bullish. It seems that ETH has completed a fourth-wave pullback (red icon) and has now begun the fifth and final wave, which could take it to a new all-time high price.
A decrease below the yearly low of $881 would invalidate this potential wave count.
For Be[in]Crypto’s latest Bitcoin (BTC) analysis, click here
