


Injective (INJ), SEI, and Bitget Token (BGB) are three altcoins that reached new all-time highs today.
The increases for these three altcoins have been going on for various periods. Which ones will continue?
SEI Price Increases by 50% in Two Days
The SEI price has increased gradually since October 19, when it fell to a low of $0.10. The increase accelerated at the end of November, leading to an all-time high of $0.32 on December 5.
Afterward, the altcoin began a significant correction. This led to a low of $0.22 on December 13. Then, it began another increase yesterday, reaching a new all-time high of $0.34 today.
Elliott Wave theory involves the analysis of recurring long-term price patterns and investor psychology to determine the direction of a trend. The most likely wave count suggests that SEI completed a five-wave upward movement’s first and second waves (white). The sub-wave count is given in black.
If wave three has the same length as wave one, the altcoin can increase by another 35% and reach the next resistance at $0.44. Since wave three often extends, it may have 1.61 times the length of wave one, leading to an increase of 75% and a high of $0.58.
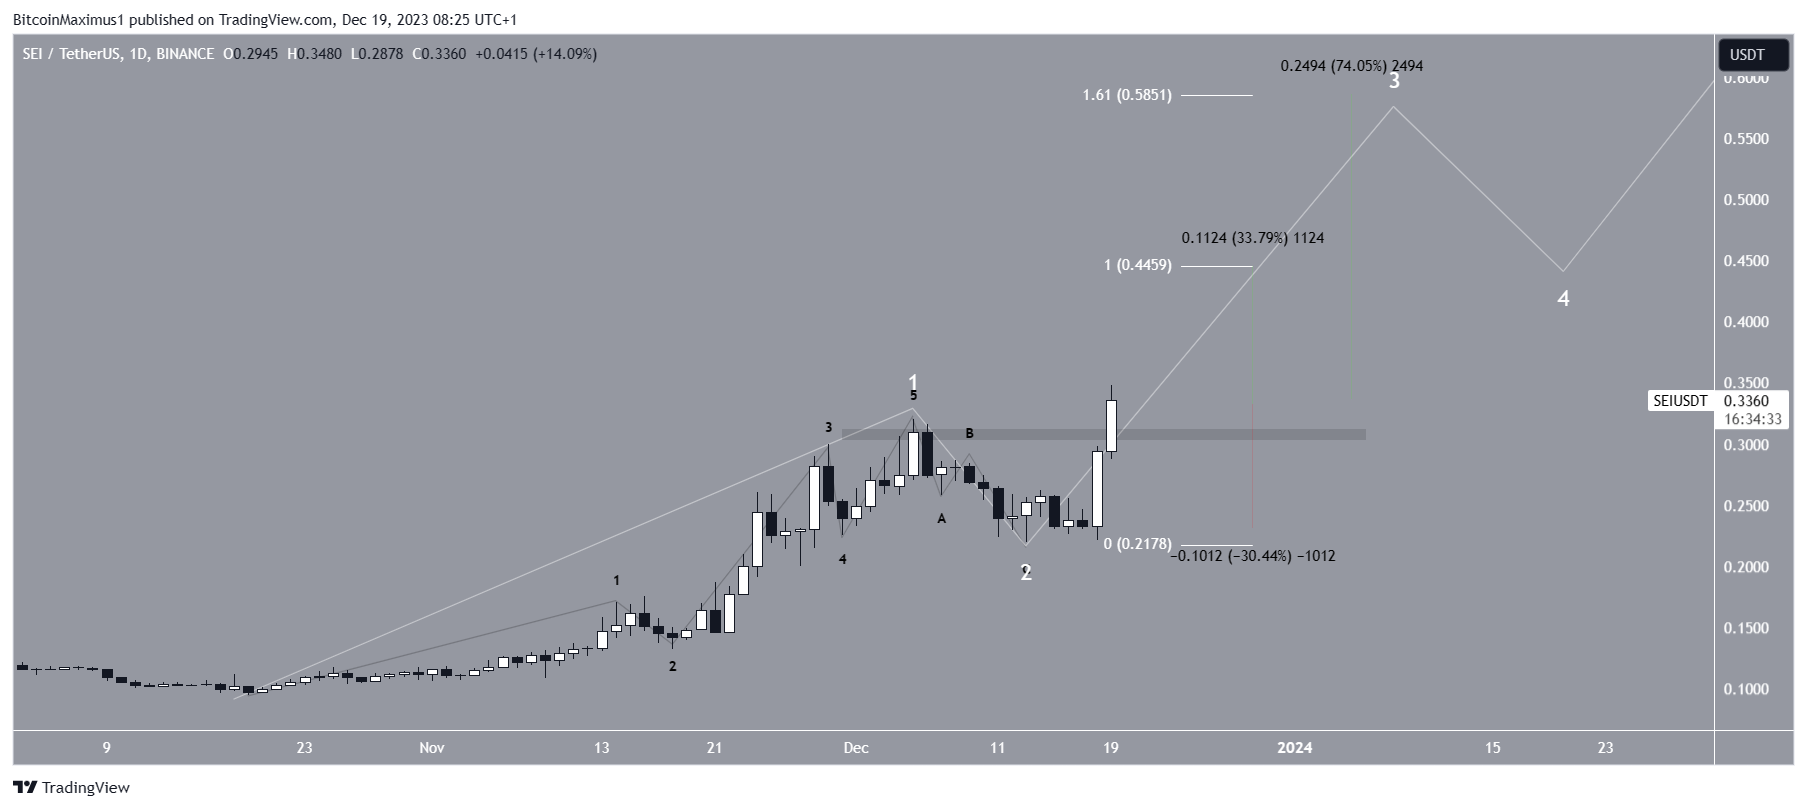
Despite this bullish SEI price prediction, a close below the $0.30 horizontal resistance area will invalidate the breakout. This can cause a 30% decrease to the closest support at $0.22.
INJ Approaches $40
The INJ price has increased swiftly since the start of the year. It reached a new all-time high of $38.80 today, an upward movement of 3,000% in 2023.
The rate of increase accelerated in October, and the price has created nine bullish weekly candlesticks in 10 weeks since then.
The wave count suggests that the INJ price is nearing the top of the fifth and final wave. Currently, wave five has had 0.618 times the length of waves one and three combined. So, a top may be reached near $40.70.
However, a breakout above this level will mean that wave five will extend further. So, the reaction to the $40.70 area will determine whether the price has reached the top.
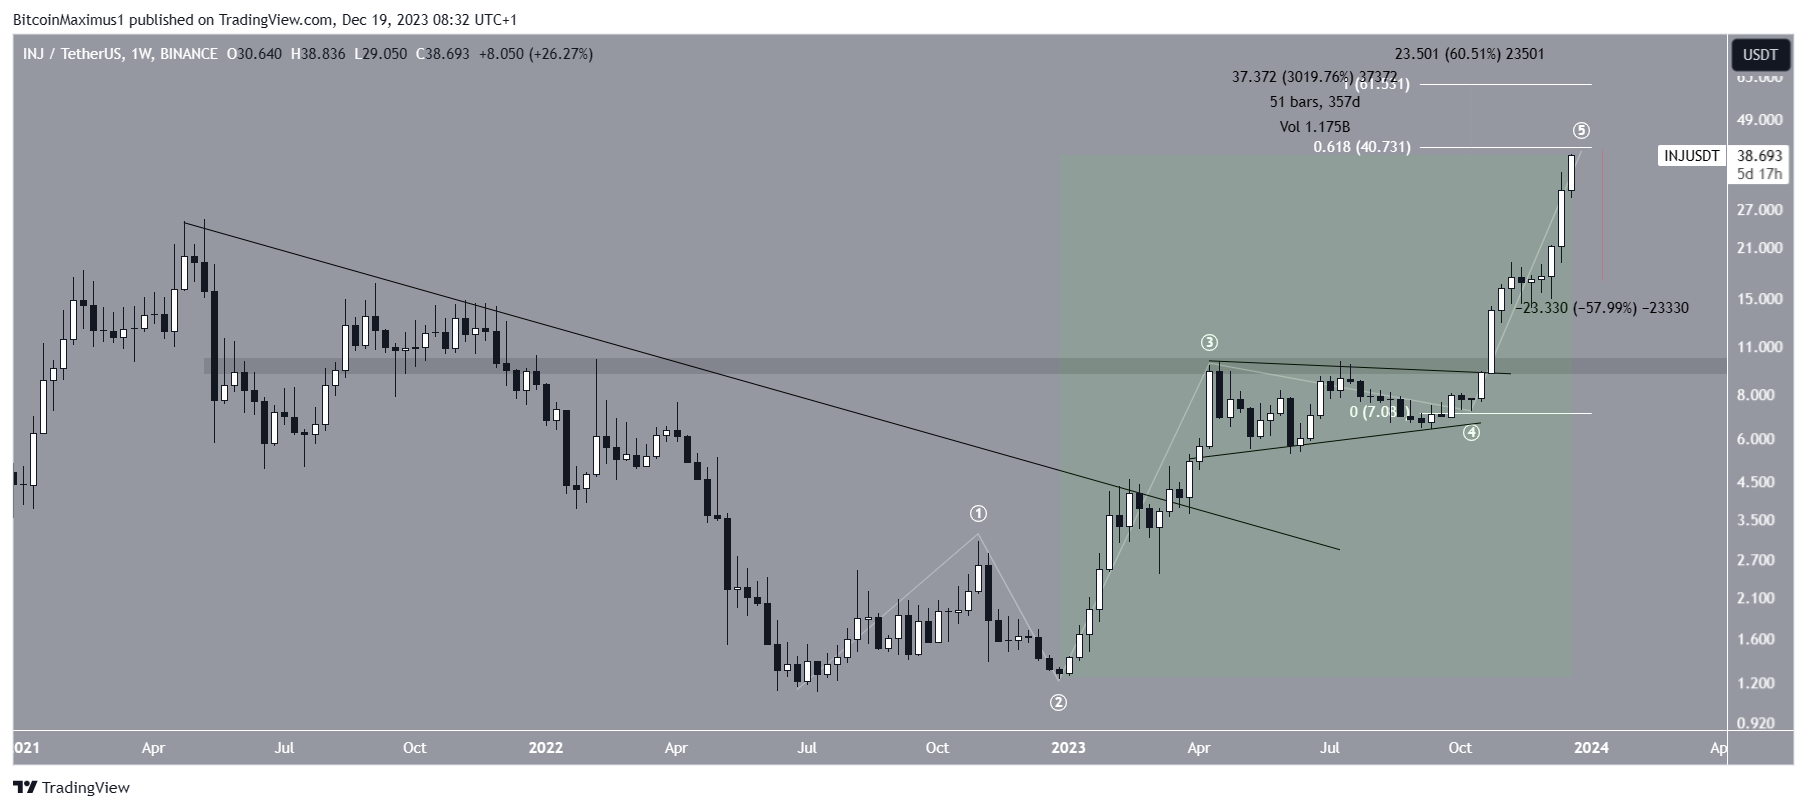
If INJ breaks out, it can increase by 60% and reach the next resistance at $61.50. However, a 60% drop to the $17 support area will be expected if it gets rejected.
Cryptocurrency analyst Tanaka noted that the price increase has been accompanied by an increased interest in the ecosystem. He tweeted:
As the $INJ token keeps breaking its ATH, the chain has experienced a significant increase in user adoption since its launch. In particular, starting from December 9th, the number of daily new wallets on Injective surged from 134 to 1328 wallets on December 18th.
BGB Clears Finals Resistance
The BGB price has gradually increased since July 2022. Since the start of the year, the price has struggled to move above the $0.50 horizontal resistance area.
Market traders use the RSI as a momentum indicator to identify overbought or oversold conditions and to decide whether to accumulate or sell an asset. Readings above 50 and an upward trend indicate that bulls still have an advantage, whereas readings below 50 suggest the opposite.
The rejections were combined with a bearish divergence in the weekly RSI (green). This is a sign of growing weakness. However, the breakout from the $0.50 area in November also coincided with a break from the divergence trend line, increasing its legitimacy.
Today, the altcoin reached a new all-time high of $0.70. The high was made above the 1.61 external retracement of the previous drop. Since it has moved above this resistance area, it will likely increase to the next resistance at $0.85, a 25% upward movement from the current price.
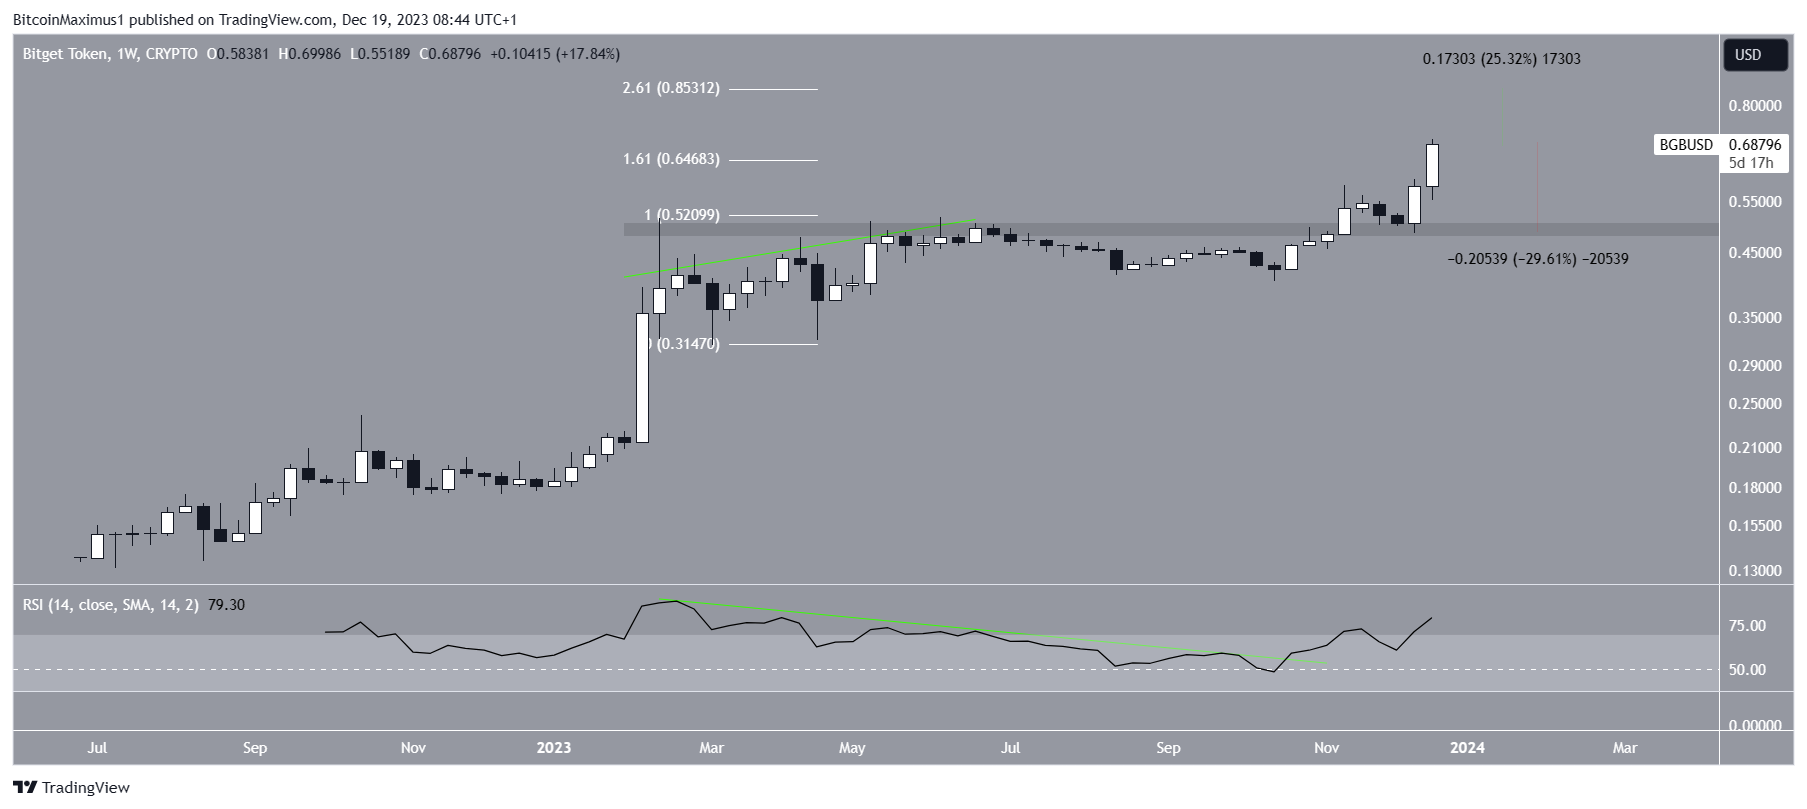
Despite this bullish BGB price prediction, a close below $0.65 can lead to a 30% decrease to the closest support at $0.50.
For BeInCrypto’s latest crypto market analysis, click here.


