


The Algorand (ALGO) price has given several bullish reversal signs after bouncing at a significant support level. The price may have begun a new bullish impulse.
Bounce From Support
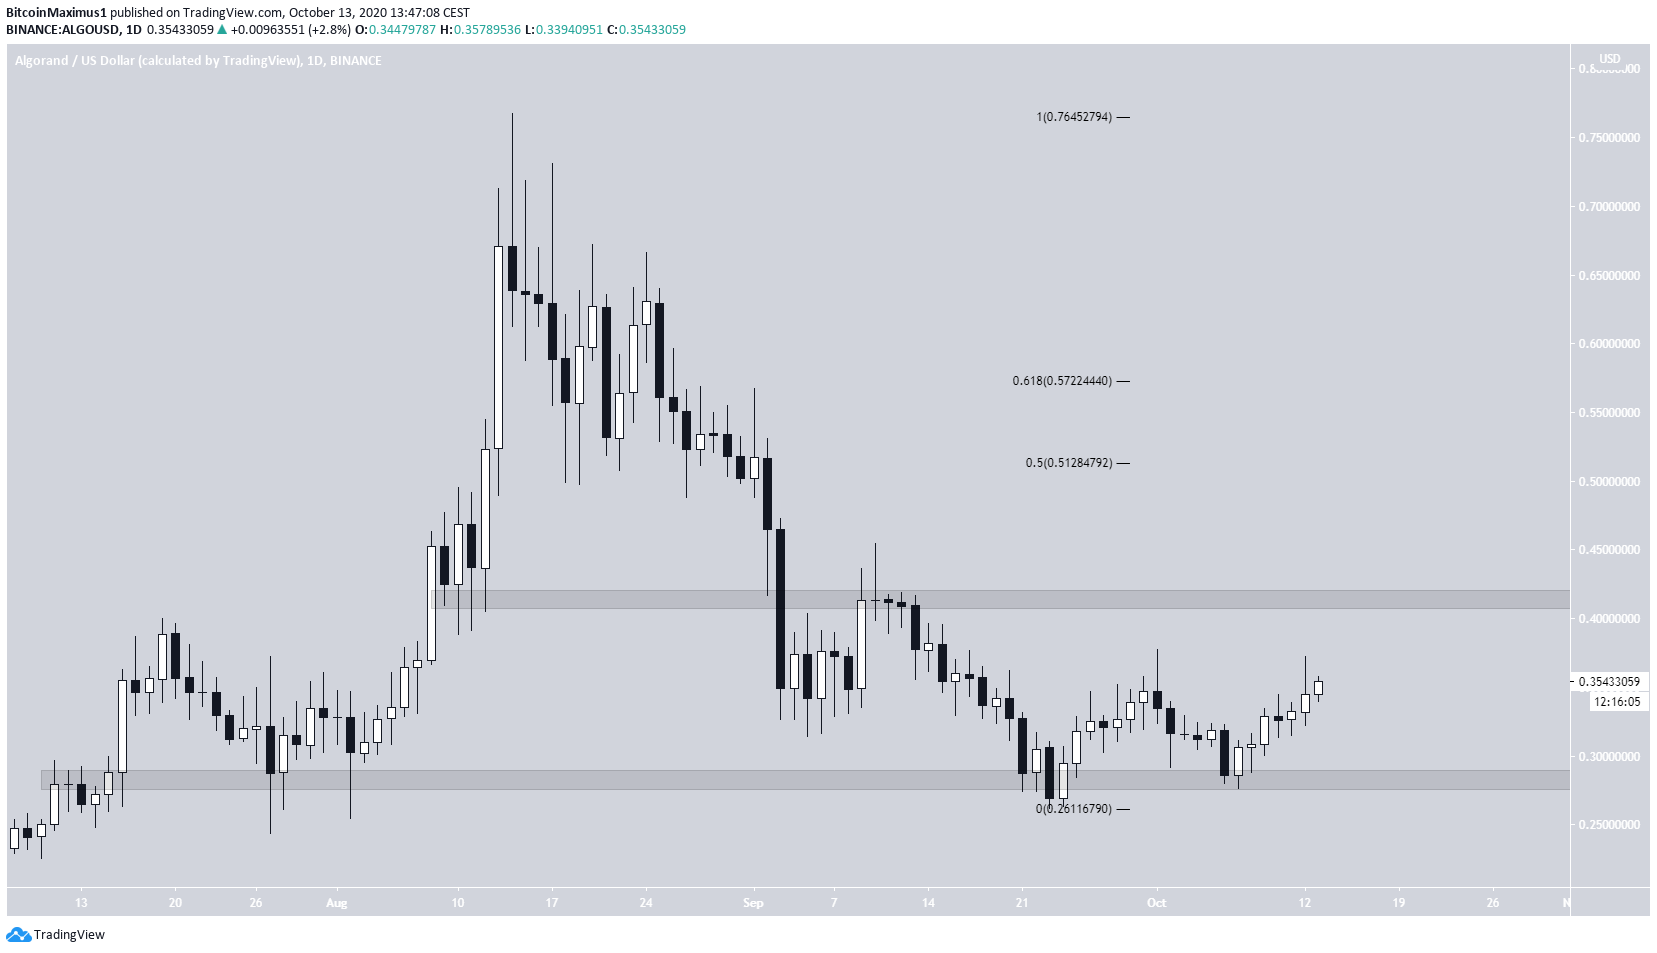
ALGO reached a high of $0.76 on Aug. 14 and has been declining since. The fall continued until Sept 23, when the price reached a low of $0.261. The price has been rising since.
The previous low caused a deviation below the $2.70 support area, but the price reclaimed it shortly afterward, confirming it as support.
The closest resistance area is found at $0.42, most recently having rejected the price on Sept 10. If the price manages to break out above, the next resistance area would be between $0.51 – $0.57, the 0.5 – 0.618 Fib levels of the entire downward move.
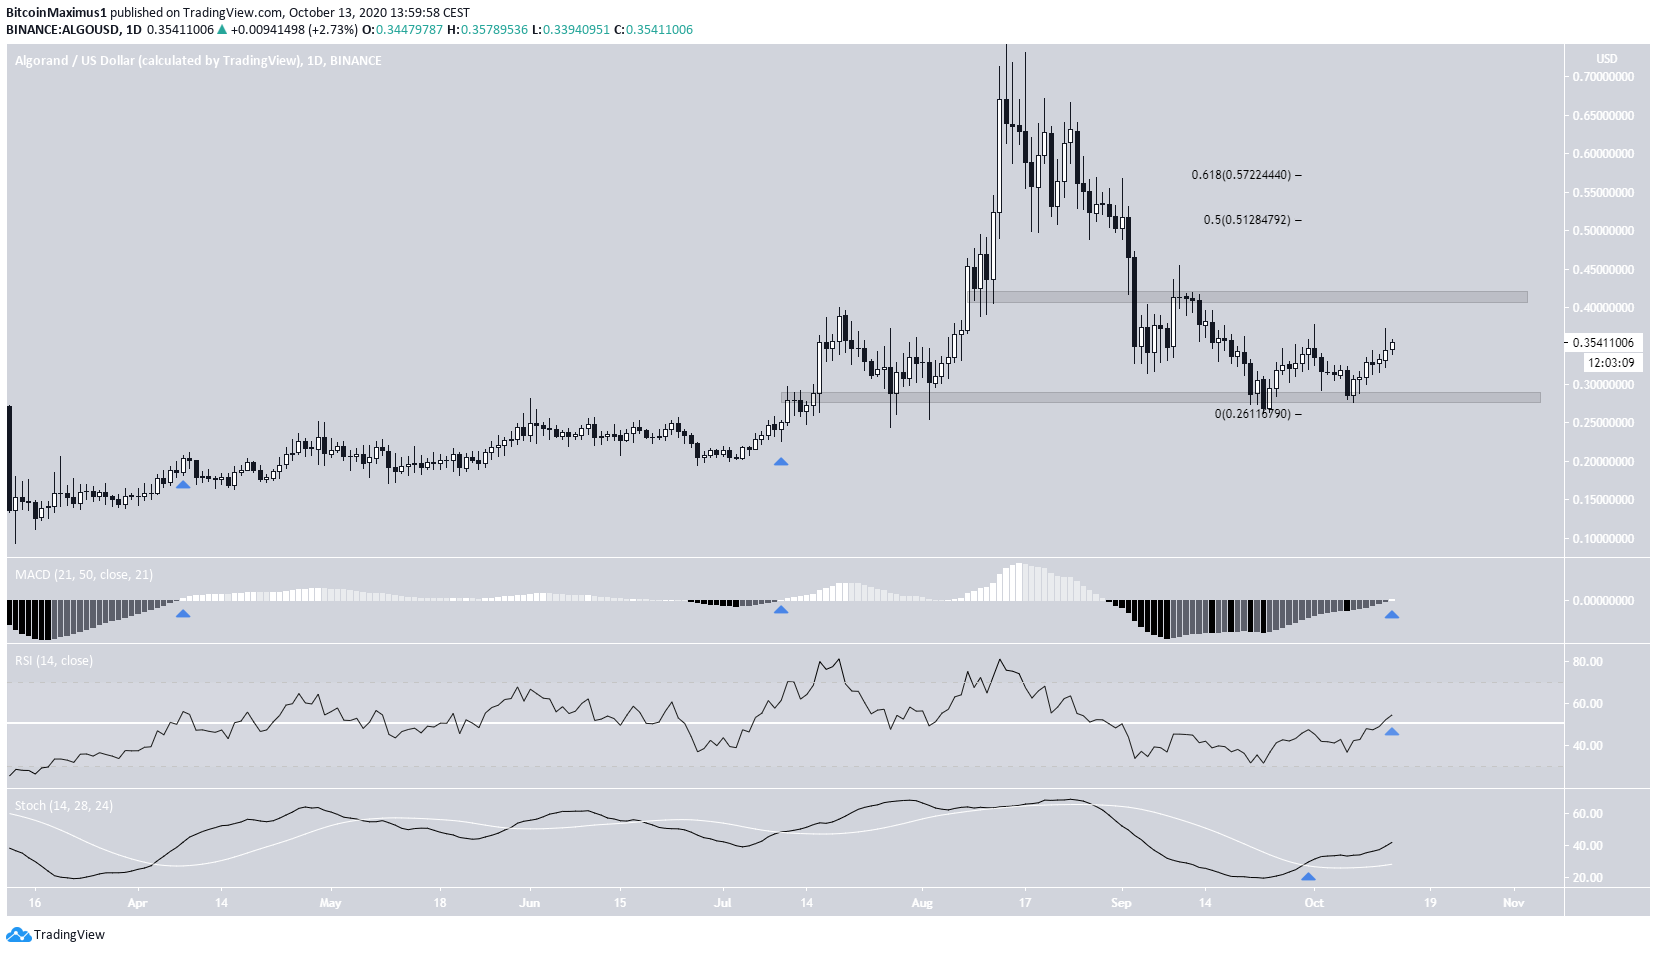
Technical indicators on the daily time-frame are bullish:
- The MACD has just crossed into positive territory. The previous two times this occurred (shown with blue arrows), significant price increases followed.
- The RSI has just crossed above 50.
- The Stochastic Oscillator has just made a bullish cross and is moving upwards.
Therefore, the price should reach the $0.42 area and possibly break out.
Wave Count
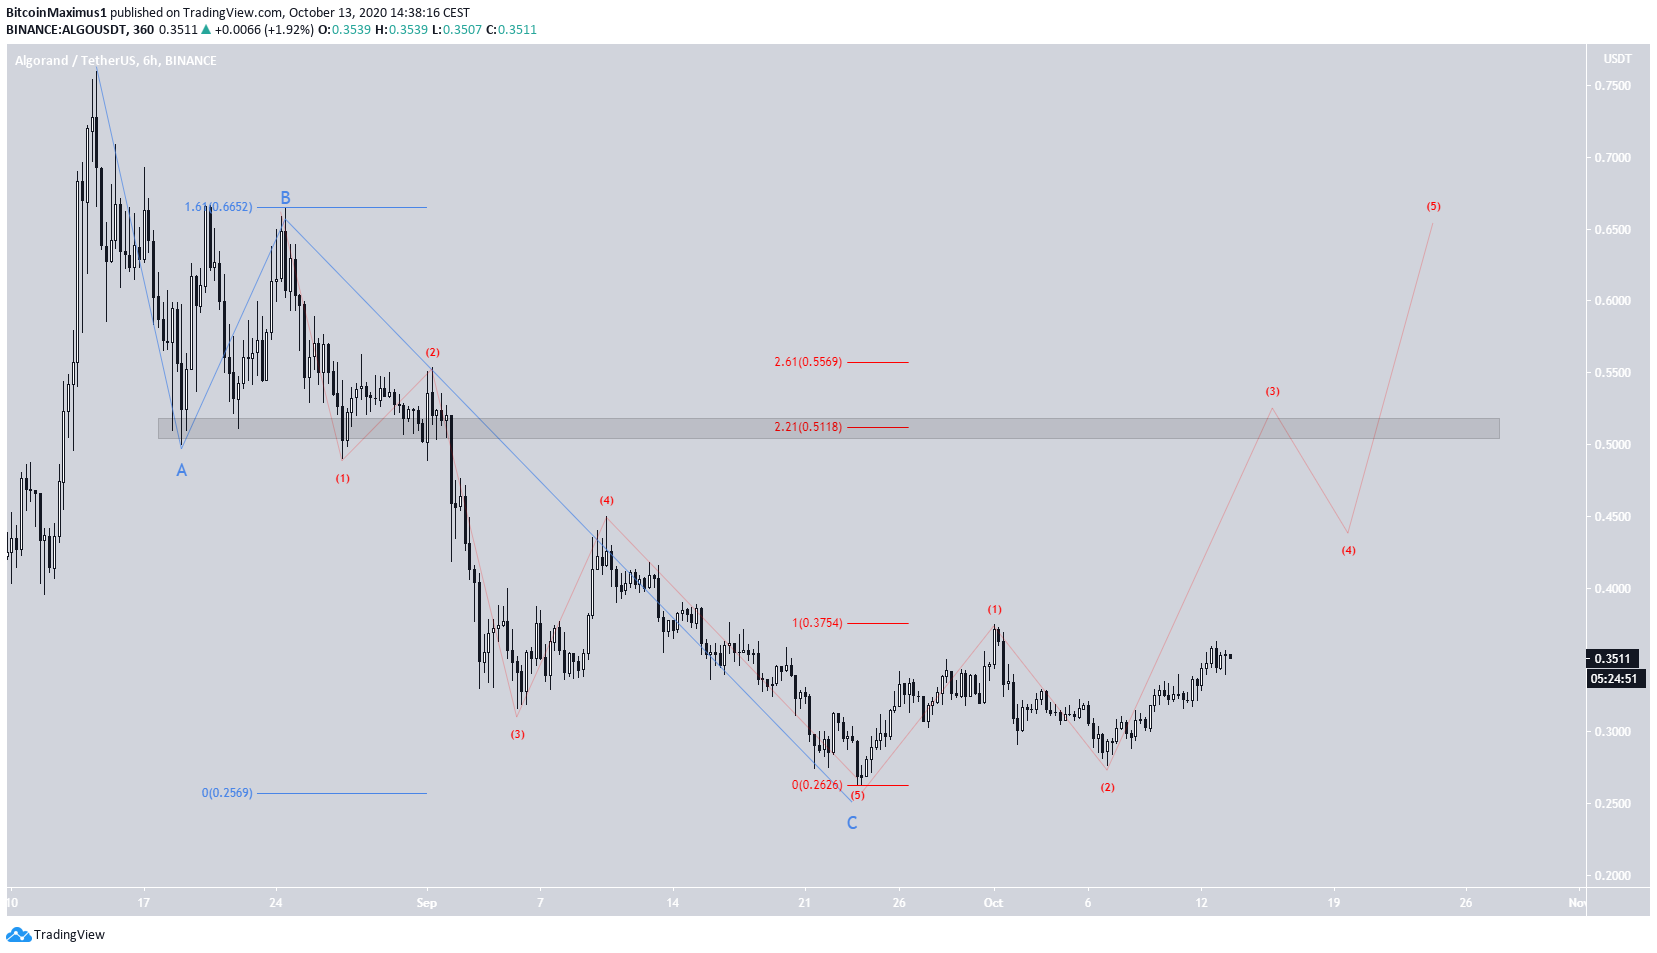
Cryptocurrency trader @TheEWguy outlined an ALGO chart, in which the price increases all the way to $0.46.
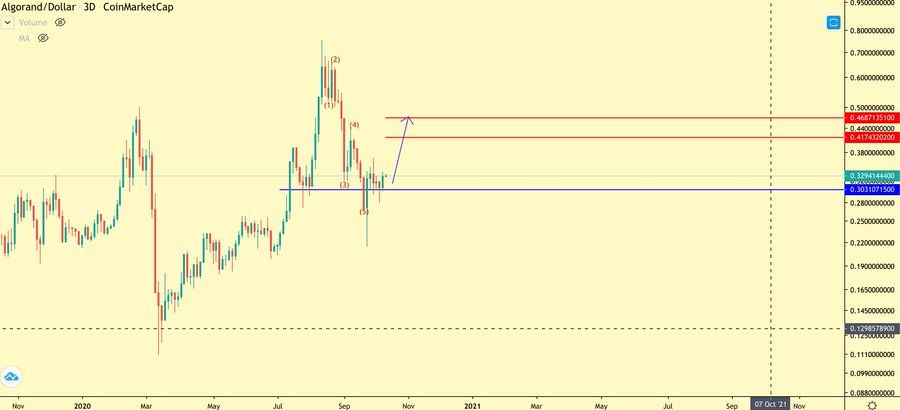
The most likely wave count seems to be that the price has completed waves 1 – 4 of a five-wave bullish impulse (shown in black below).
The fact that the bottom of wave 4 barely missed the top of wave 1 makes the formation even more likely. If correct, the first target for the top of wave 5 would be at $1.16, the 1.61 Fib level of waves 1 – 3.
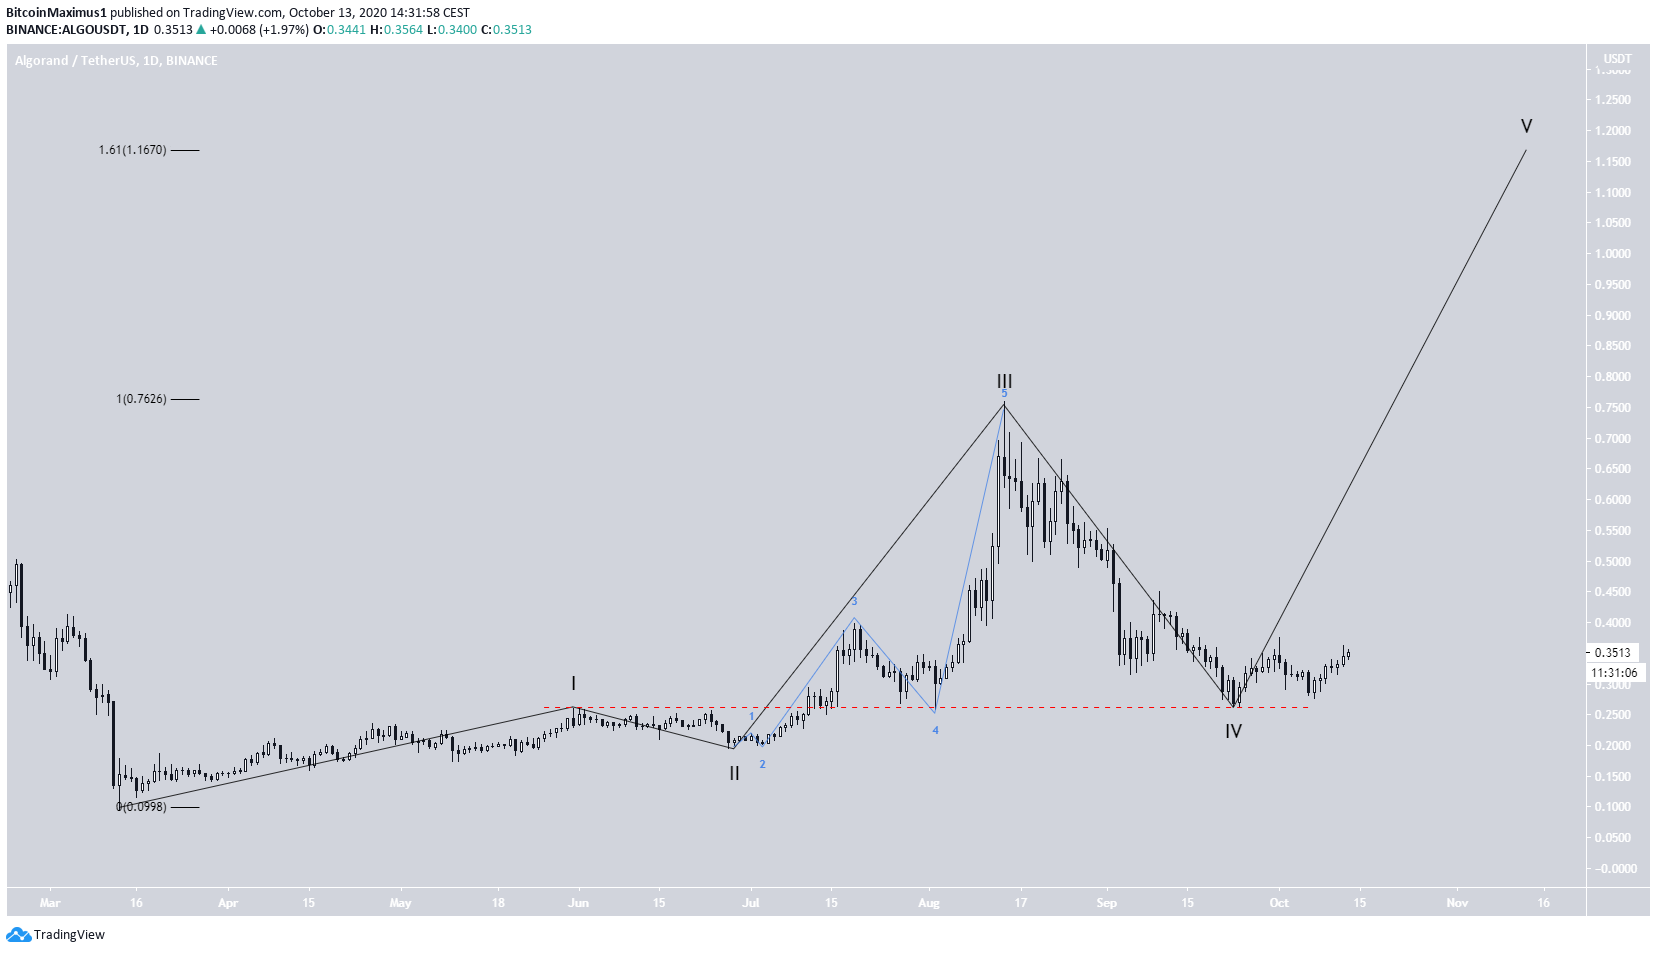
In BeInCrypto’s Sept 12 analysis, it was stated that:
“Based on the length of the A wave, a possible low could be reached at $0.256, in which case the C and A waves would have a ratio of 1.61:1.”
On Sept 23, the price reached a low of $0.261, validating the prediction and the ratio between waves A:C.
If correct, the price has begun a new bullish impulse (shown in red below) and is currently in wave 3, which could end between $0.51 and $0.55.
A fall below the wave 2 low at $0.2767 would invalidate this particular wave count.
To conclude, the ALGO price should continue rallying towards the resistance areas outlined above and possibly target $1.16.
For BeInCrypto’s Bitcoin analysis, click here!
Disclaimer: Cryptocurrency trading carries a high level of risk and may not be suitable for all investors. The views expressed in this article do not reflect those of BeInCrypto.


