


Even though the Algorand (ALGO) price has been decreasing for nearly a month, technical indicators and the most likely wave count indicate that the price is nearing a reversal.
Top Of The Trading Range
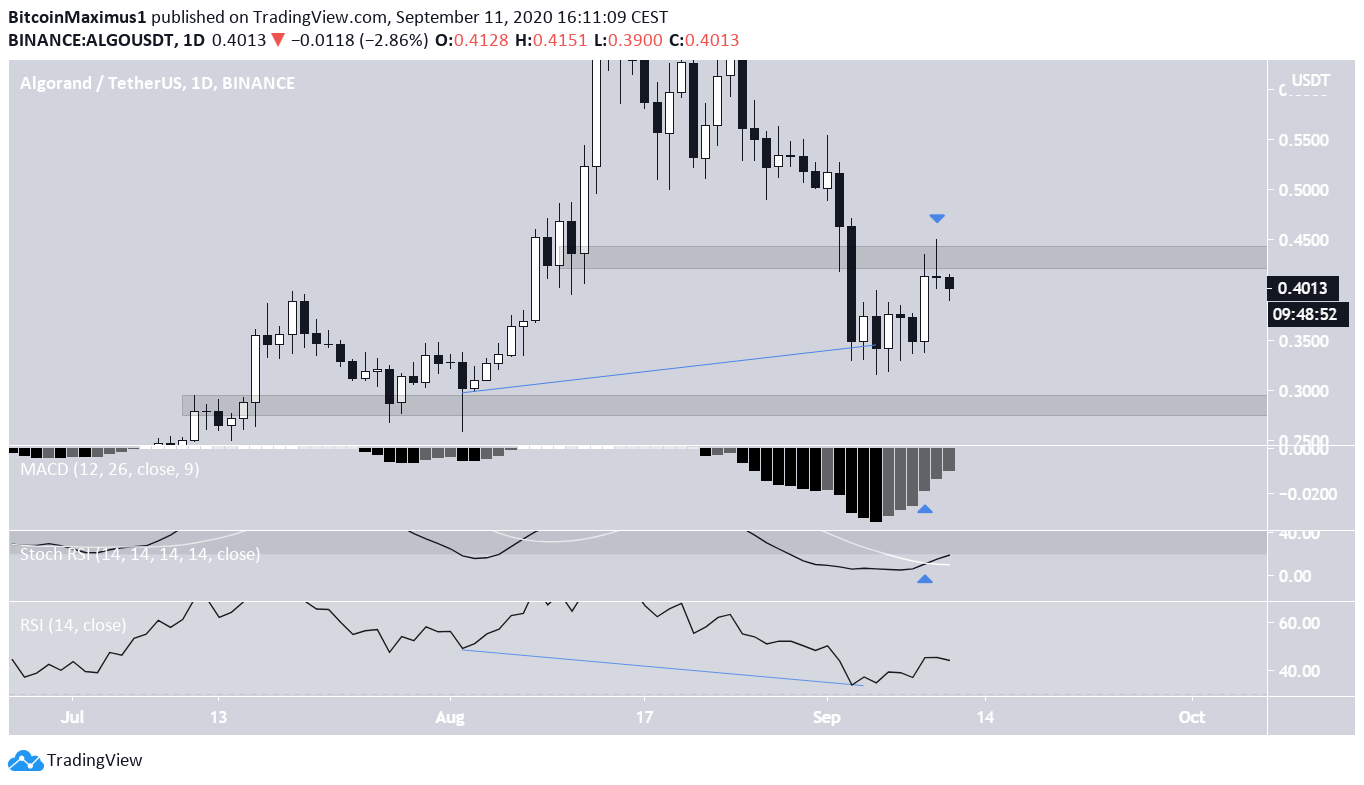
The ALGO price has been decreasing since it reached a high of $0.76 on Aug. 14. The price reached a low of $0.316 on Sept. 5 and bounced upwards.
Currently, the price is trading very close to the $0.435 resistance area, from which it was rejected yesterday. The closest support area is found at $0.285.
Technical indicators are bullish:
- The MACD is moving upwards and has almost turned positive.
- There is hidden bullish divergence in the RSI.
- The Stochastic RSI has made a bullish cross.
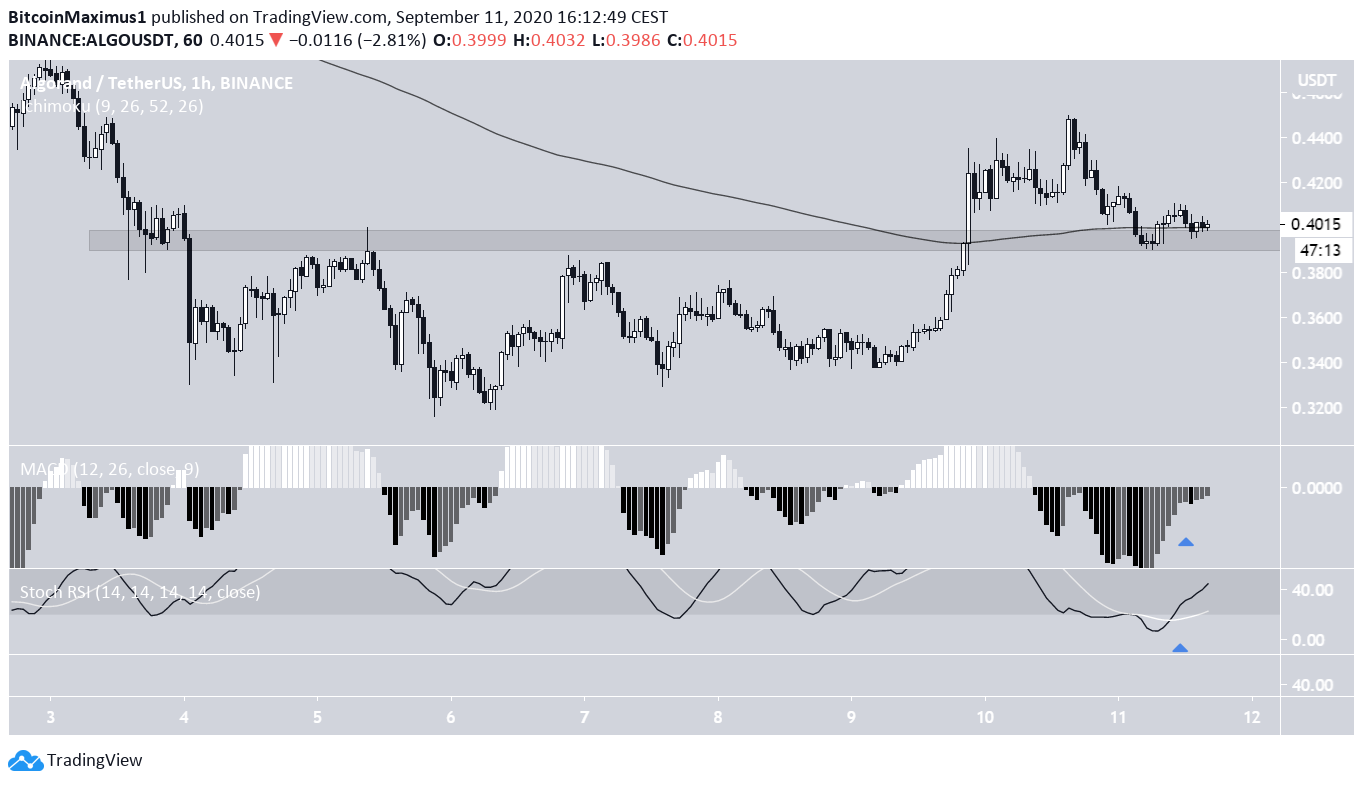
The hourly chart shows that the price has reclaimed the minor $0.40 resistance area and is in the process of validating it as support. In addition, it has done the same with the 100-hour moving average (MA).
If they get confirmed as support, a breakout from the previously mentioned $0.435 resistance area would be expected.
Wave Count
Cryptocurrency trader @Glowto1994 stated that the ALGO price will drop towards $0.33 before moving upwards once more, reaching a new high above $1.
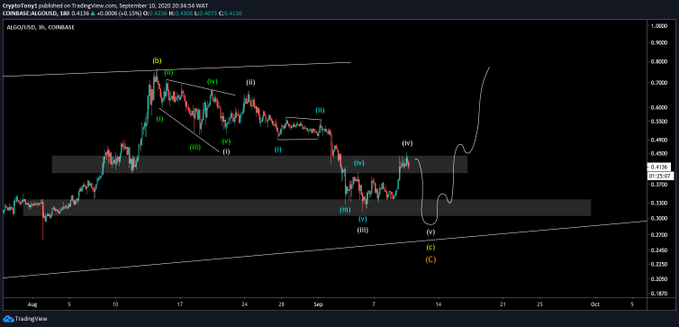
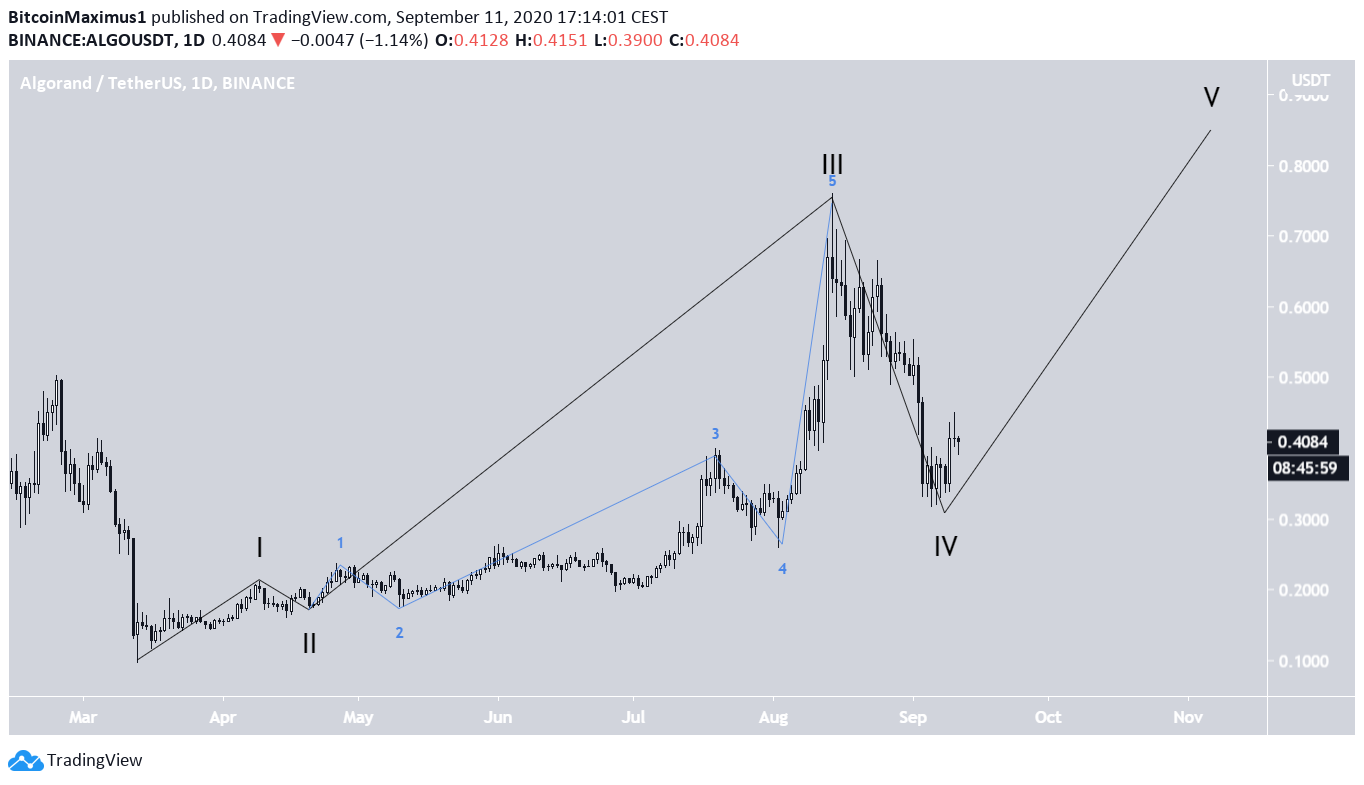
Beginning with a bottom on March 13, it seems that ALGO has begun a bullish impulsive formation (shown in black below) with an extended third wave. The aforementioned high of Aug. 14 was likely the top of the third wave, and the price has been correcting since.
If the price begins wave 5, it could take it all the way to the proposed target at $1.
Next, we will take a closer look at the fourth corrective wave, in order to determine where it will end.
A closer look at the fourth wave reveals that it is likely transpiring inside an A-B-C formation (in blue below) and is currently near the end of the C wave, which is formed by a bearish impulse (red).
Based on the length of the A wave, a possible low could be reached at $0.256, in which case the C and A waves would have a ratio of 1.61:1.
An increase above the sub-wave 1 low at $0.51 would invalidate this wave count.
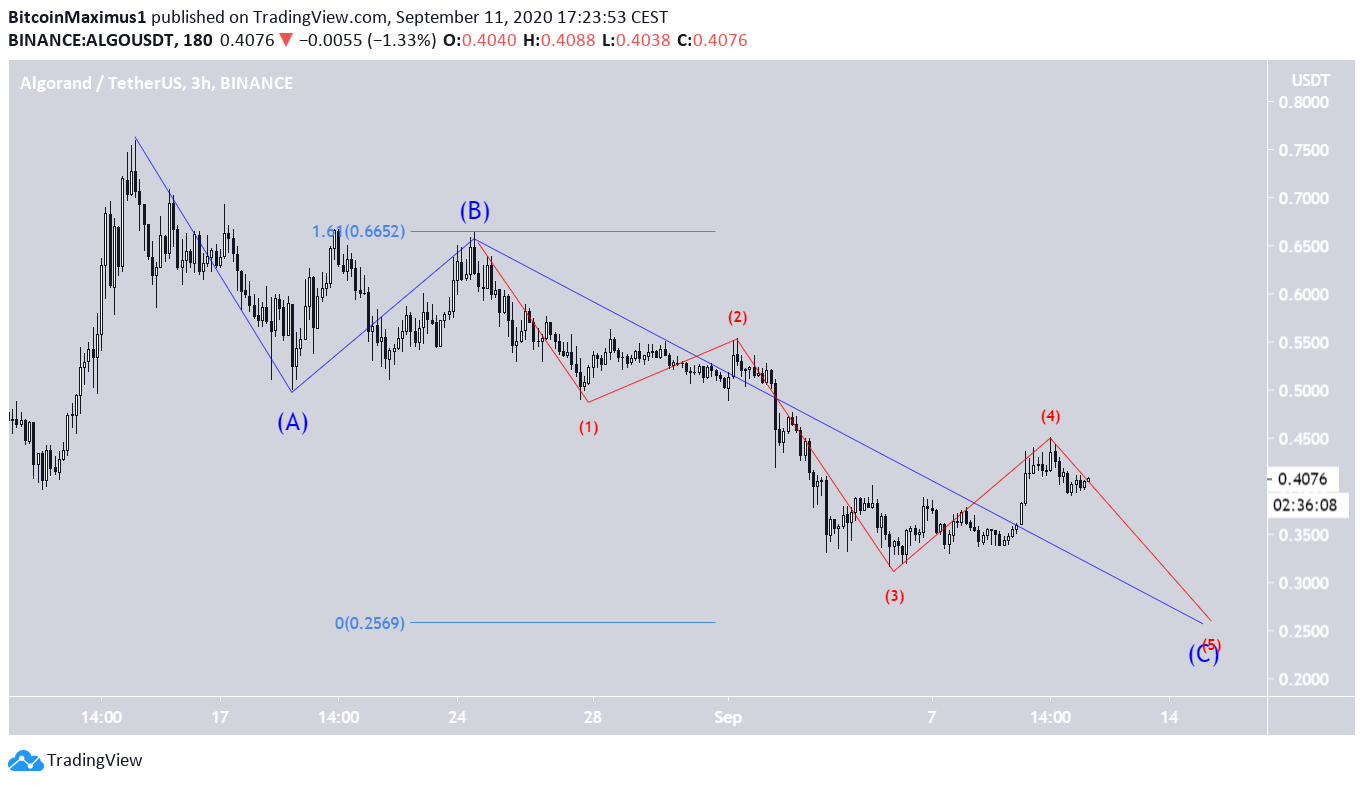
To conclude, the ALGO price is expected to decrease once more towards $0.256 and afterwards resume its upward movement.
