


Whales capitalized on the recent dip to accumulate Cardano (ADA), leading to a noticeable stabilization in ADA’s price over the last week. This accumulation period coincided with a reduction in short-term traders holding ADA, suggesting a potential decrease in price volatility.
Concurrently, the EMA lines for ADA price demonstrate a consolidation pattern, hinting at market equilibrium. Despite this, there’s an anticipation of a golden cross in the near future, a technical signal often associated with bullish momentum. This could indicate a positive turn for ADA’s price, suggesting that the current stabilization might be the precursor to an upward movement.
Whales Bought the Dip
From March 11 to March 20, the price of Cardano experienced a decrease, moving from $0.71 to $0.57. In this timeframe, the count of addresses holding over 10,000,000 ADA saw a slight increase, climbing from 397 to 403. This shift suggests that whales capitalized on the dip to bolster their ADA holdings.
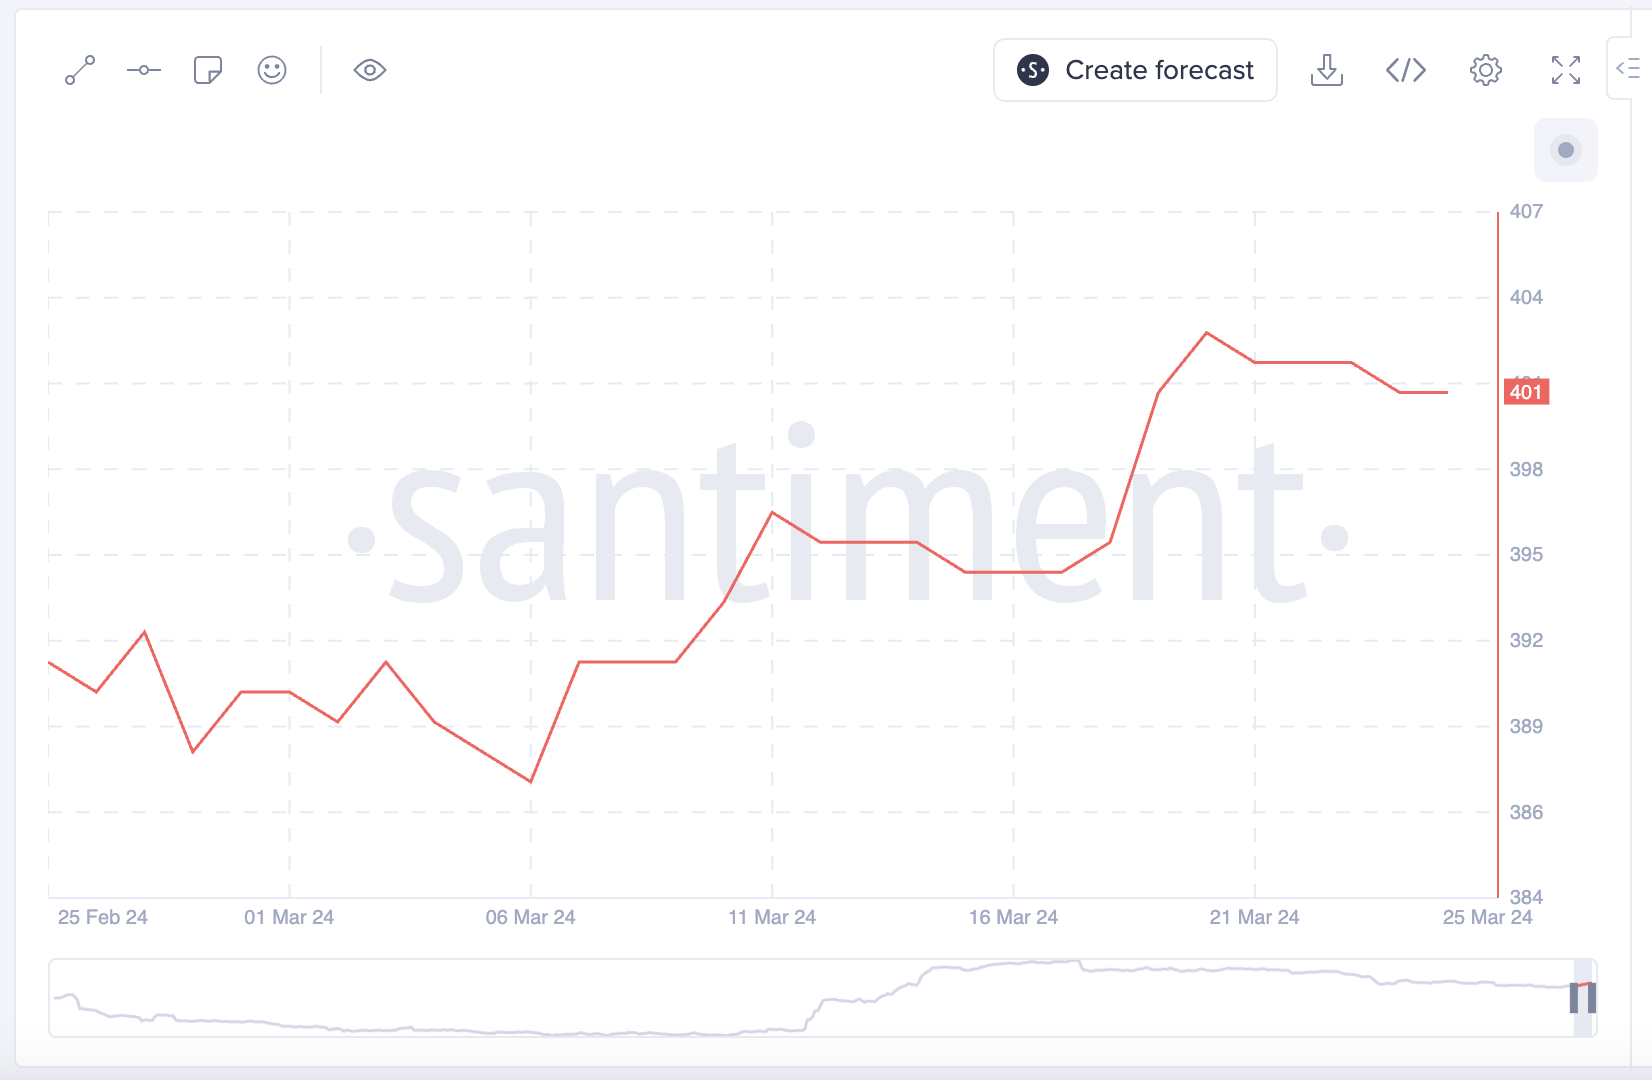
After hitting $0.57 on March 20, however, this trend of accumulation came to a halt, and the quantity of such high-volume ADA addresses remained largely unchanged. A silver lining appeared despite the stagnation in whale numbers over the following week.
Between March 20 and March 25, ADA’s price rebounded to $0.66, offering a potential profit margin for those whales who had recently increased their stakes. This halt in accumulation post-March 20 might hint at a strategic pause by the whales, as they now possibly observe market dynamics closely, awaiting further price fluctuations to inform their next moves.
Read More: How To Stake Cardano (ADA)
The Number of Traders Is Declining
Traders, identified as addresses that retain an asset for a duration shorter than one month, saw a noticeable increase for ADA, with their numbers surging from 244,000 on February 1 to 303,000 by March 18. During this same timeframe, the price of ADA rose from $0.49 to $0.69.
This rise in the population of short-term holders is typically linked with heightened volatility for the asset, given these participants’ propensity to engage in frequent buying and selling actions.
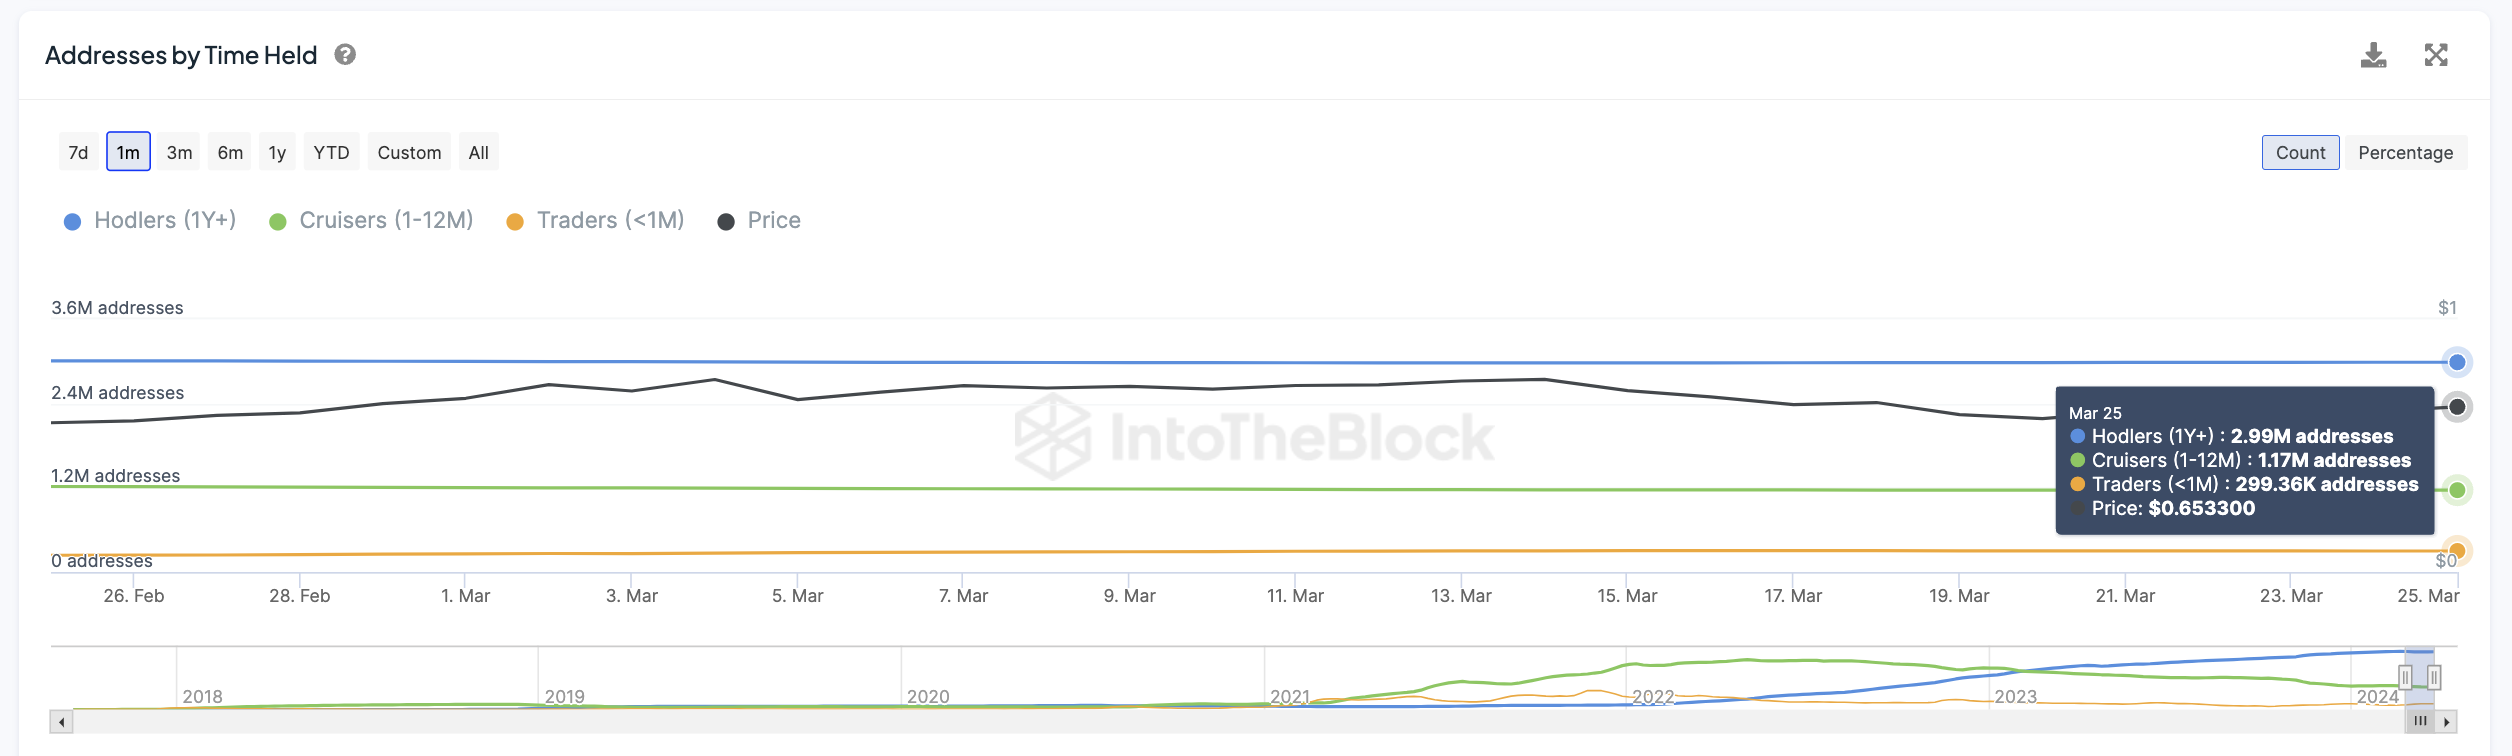
Yet, a notable shift occurred starting March 19, as the number of such traders began to taper off. From that date onwards, there has been a steady reduction in the count of ADA addresses categorized as Traders. This number has marginally decreased to 299,000 from the peak of 303,000 observed a week earlier. Though this reduction might seem minor, it is significant enough to suggest potential upcoming trends in market behavior.
Specifically, a reduction in the number of short-term traders could signal a move towards reduced price volatility for ADA. This change could indicate a stabilizing market environment, as fewer traders engaging in rapid transactions may lead to a more steady and predictable price movement for ADA.
ADA Price Prediction: Will The Uptrend Continue?
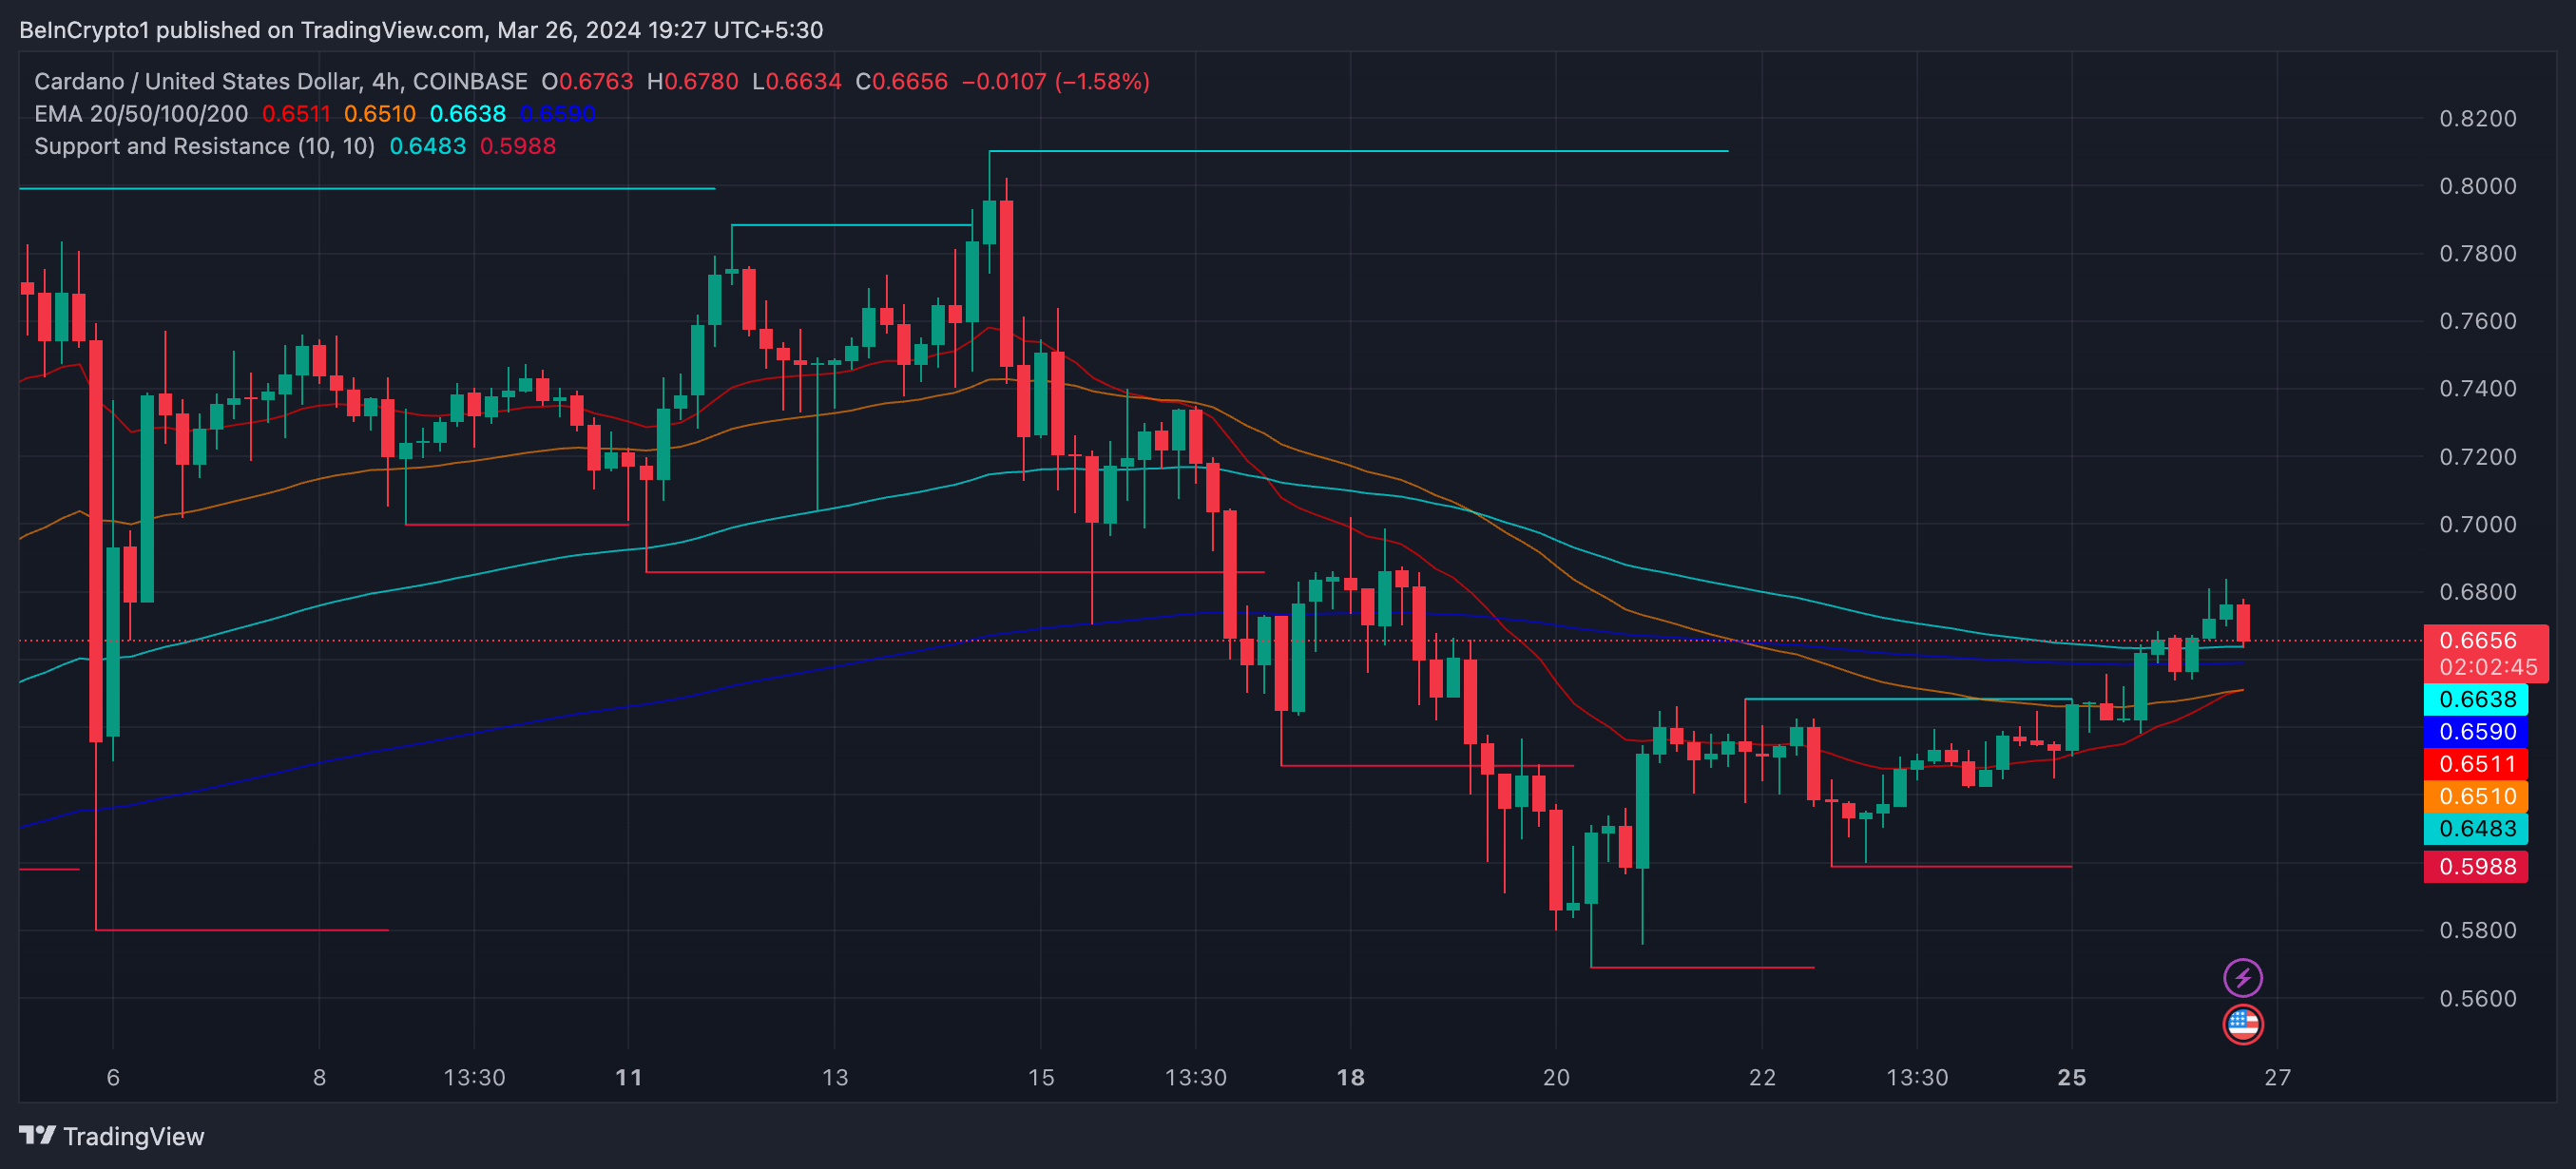
ADA price grew 14.24% in the last six days. The big question is: Will the uptrend continue? Analyzing the 4-hour price chart, we see that the price line is currently above all EMA (Exponential Moving Average) lines, which is a bullish signal.
When a short-term EMA line crosses above a long-term EMA line, which is almost happening with the ADA price chart, it’s often interpreted as a bullish signal. This indicates that recent price momentum is outpacing the longer-term trend and could lead to an upward price movement.
This specific crossover event is known as a “Golden Cross,” a widely recognized indicator suggesting a potential long-term bullish breakout.
EMA lines are tools in technical analysis used to smooth out price data over specified periods, providing a clearer view of the price trend. Unlike simple moving averages, EMAs place greater emphasis on recent prices. That makes them more responsive to changes in the market and valuable for identifying trend directions and potential reversal points.
Read More: How To Buy Cardano (ADA) and Everything You Need To Know
If the uptrend continues, ADA price could surge to test and break the resistance at $0.82 very soon. However, if the Golden Cross is not sustainable and a downtrend starts, its price could retract to the $0.56 zone.


