


The Cardano (ADA) price is trading inside an important resistance area which has not been broken since 2018. However, technical indicators are showing weakness, making it likely that the price will not yet break out.
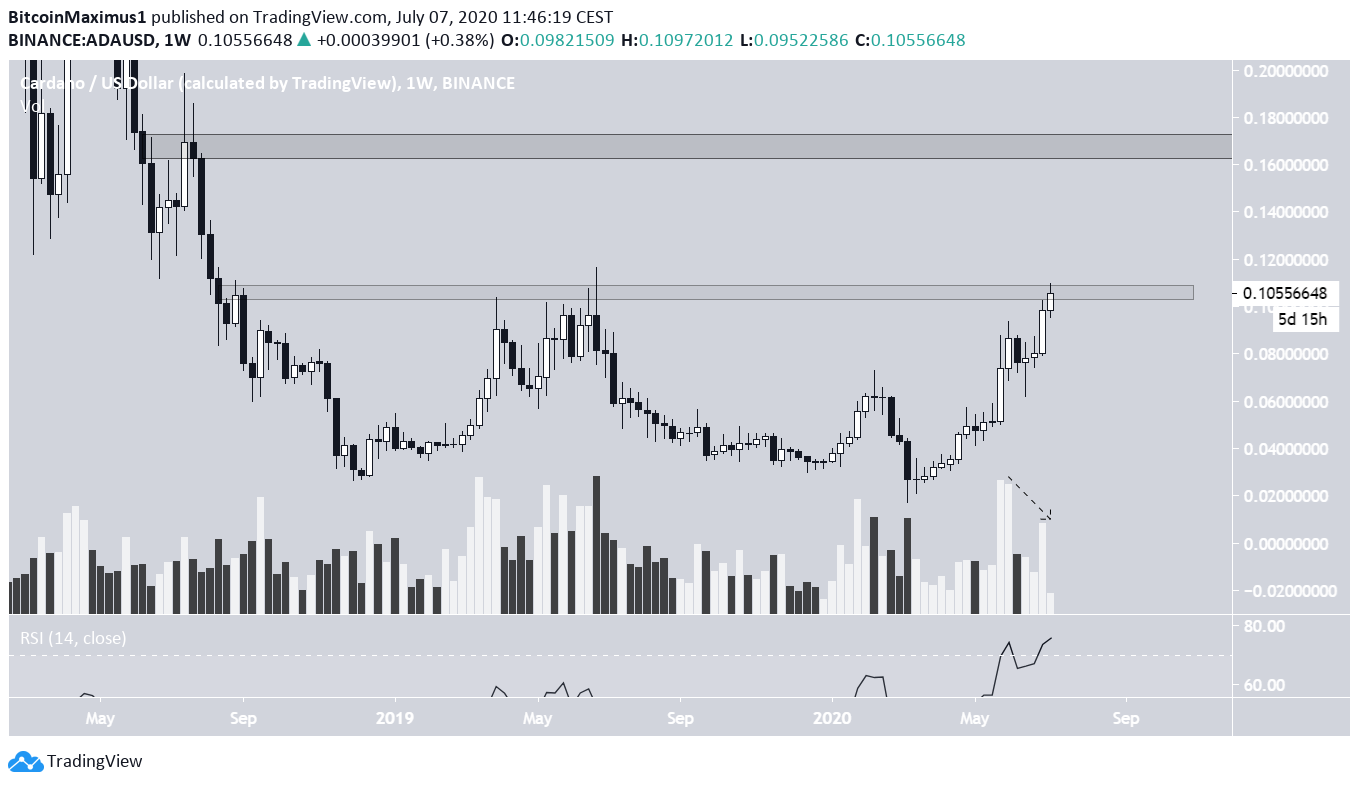
The weekly chart shows that ADA is trading inside the $0.105 resistance area, which has been in place since September 2018. While the price reached a wick-high above this resistance in 2019, it failed to reach a close above.
Weekly ADA Outlook
The RSI is in overbought territory but has not generated any divergence yet. While volume has been decreasing since the beginning of the upward move in March 2019, this alone is not sufficient to predict a reversal.
In order to do so, a look at lower time-frames is required.
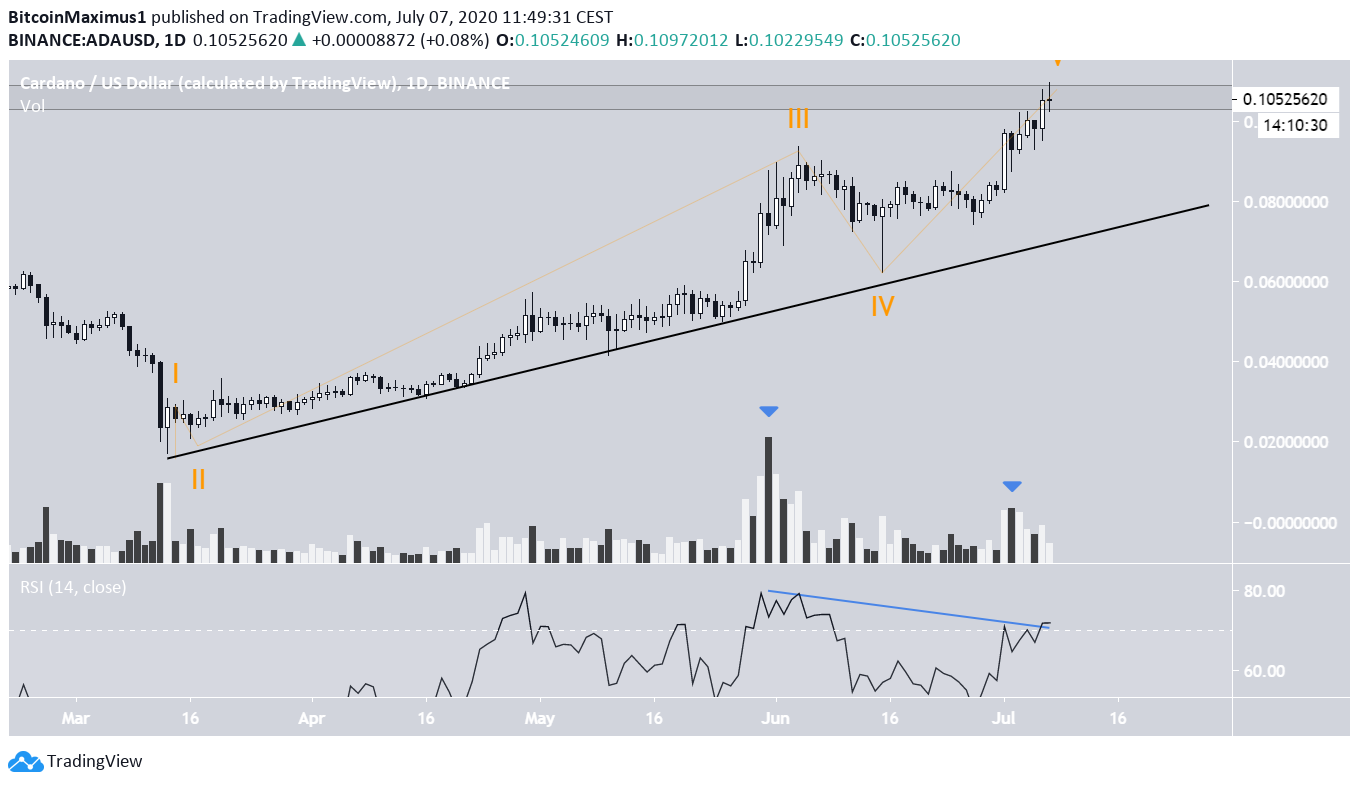
Daily Outlook
The daily chart reveals that since the upward move began, the price has been following an ascending support line. Furthermore, the movement throughout the support line closely resembles a five-wave Elliott formation, inside which the price is likely in the fifth and final wave.
Technical indicators are bearish, especially the RSI. There are numerous bearish divergences developing in the daily time-frame.
Also, the highest volume registered has been on two bearish candlesticks, which is a bearish sign, especially during an upward trend.
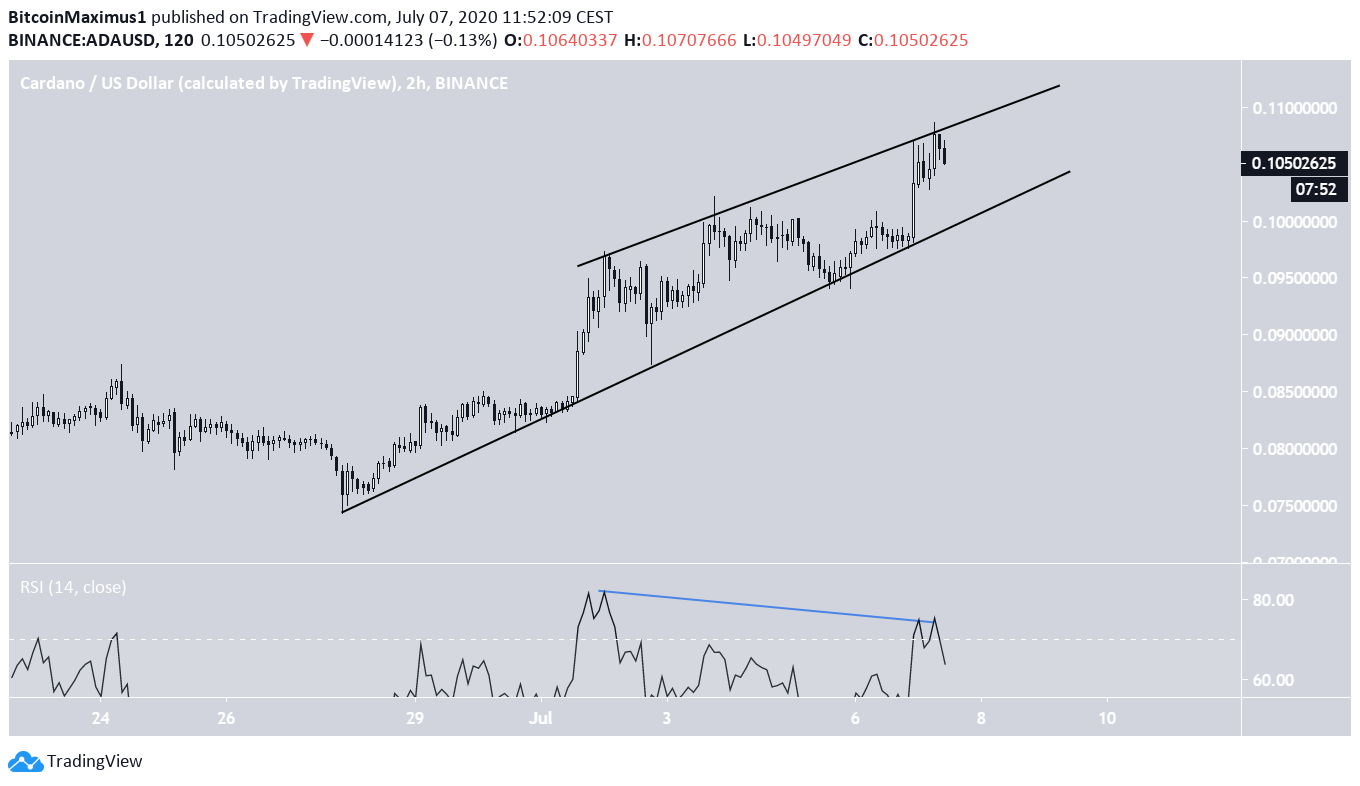
Ascending Wedge
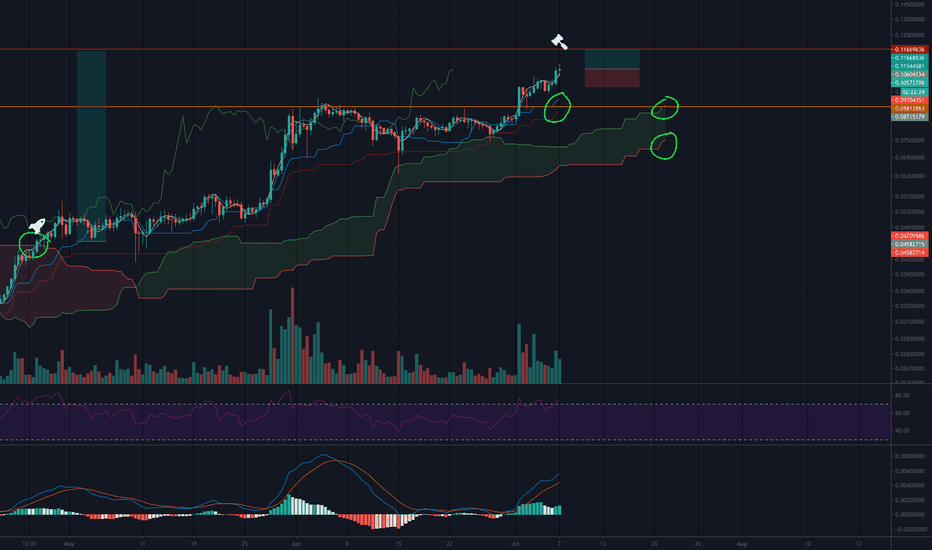
Cryptocurrency trader @Ideasprime stated that ADA could continue increasing for another 10%.
However, in the short-term, the price is trading inside either an ascending channel or a wedge and has generated some short-term divergence. A breakdown from this wedge would indicate that the fifth wave has ended and the price should begin a correction.
For the aforementioned 10% increase to occur, ADA would likely have to first fall to the support line of the wedge before increasing towards the resistance. However, it seems that the price is close to reaching its top.
To conclude, the ADA price is trading inside an important resistance area and has shown considerable weakness, indicating that it will likely not be successful in breaking out.


