


The Bitcoin (BTC) price increased considerably on July 6, creating a bullish engulfing candlestick with considerable volume.
This caused the price to move all the way to an important resistance area, a breakout above which would be a major bullish development.
Bitcoin’s Bullish Engulfing Candlestick
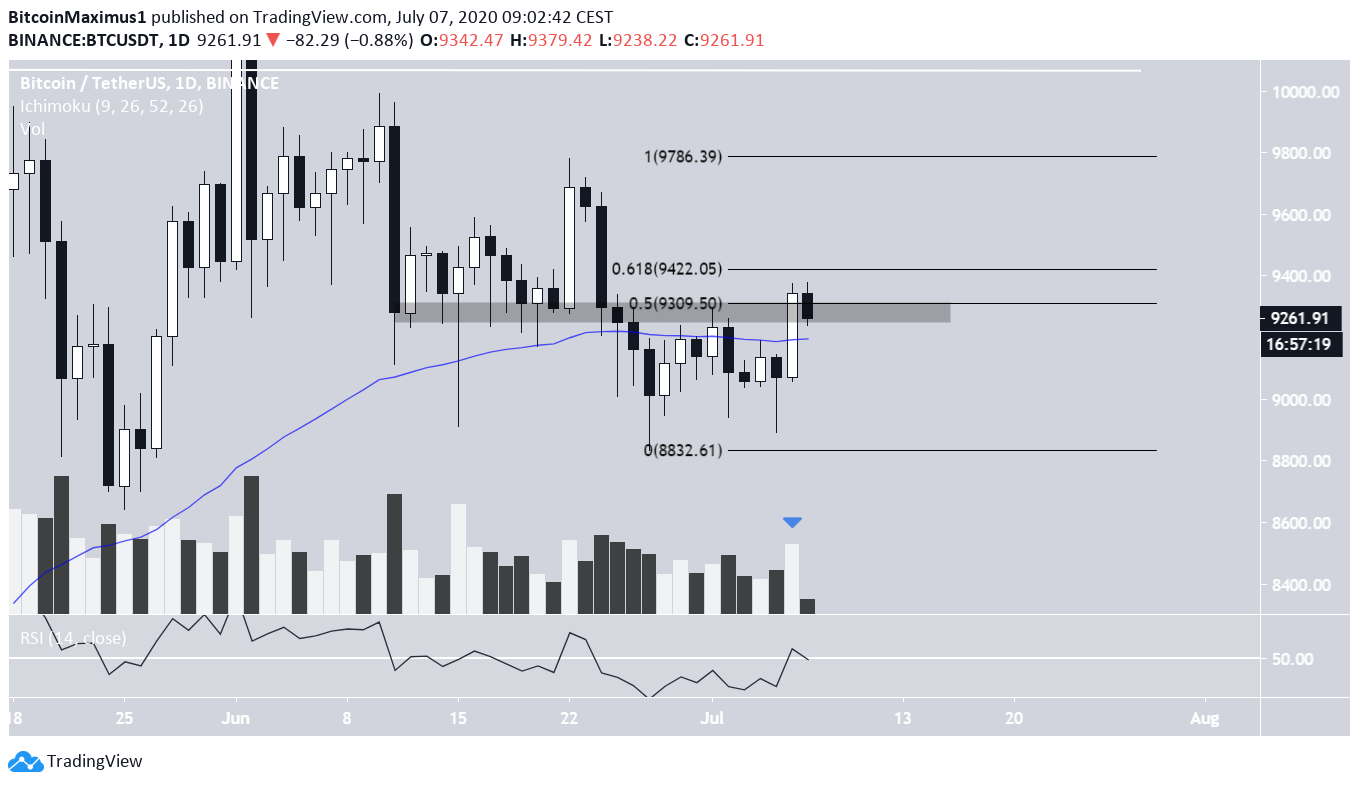
On July 6, the Bitcoin price increased considerably, going from $9,055 to $9,375, creating a bullish engulfing candlestick. Furthermore, the price reached a daily close above the 0.5 Fib level of the entire move at $9,309, the $9,300 resistance area, and the 50-day moving average (MA).
Volume was considerable but not extreme during this increase. Also, the daily RSI is right at 50, a decisive breakout above which would be bullish, while a rejection bearish.
While the bias in the daily time-frame is now slightly leaning bullish, the price and technical indicators appear to be very close to a decisive point, so a price decrease would confirm the rejection.
If the price were to make another similar increase today, it would negate the bearishness. In order to decide if it will, we will take a closer look at lower time-frames.
Short-Term Movement
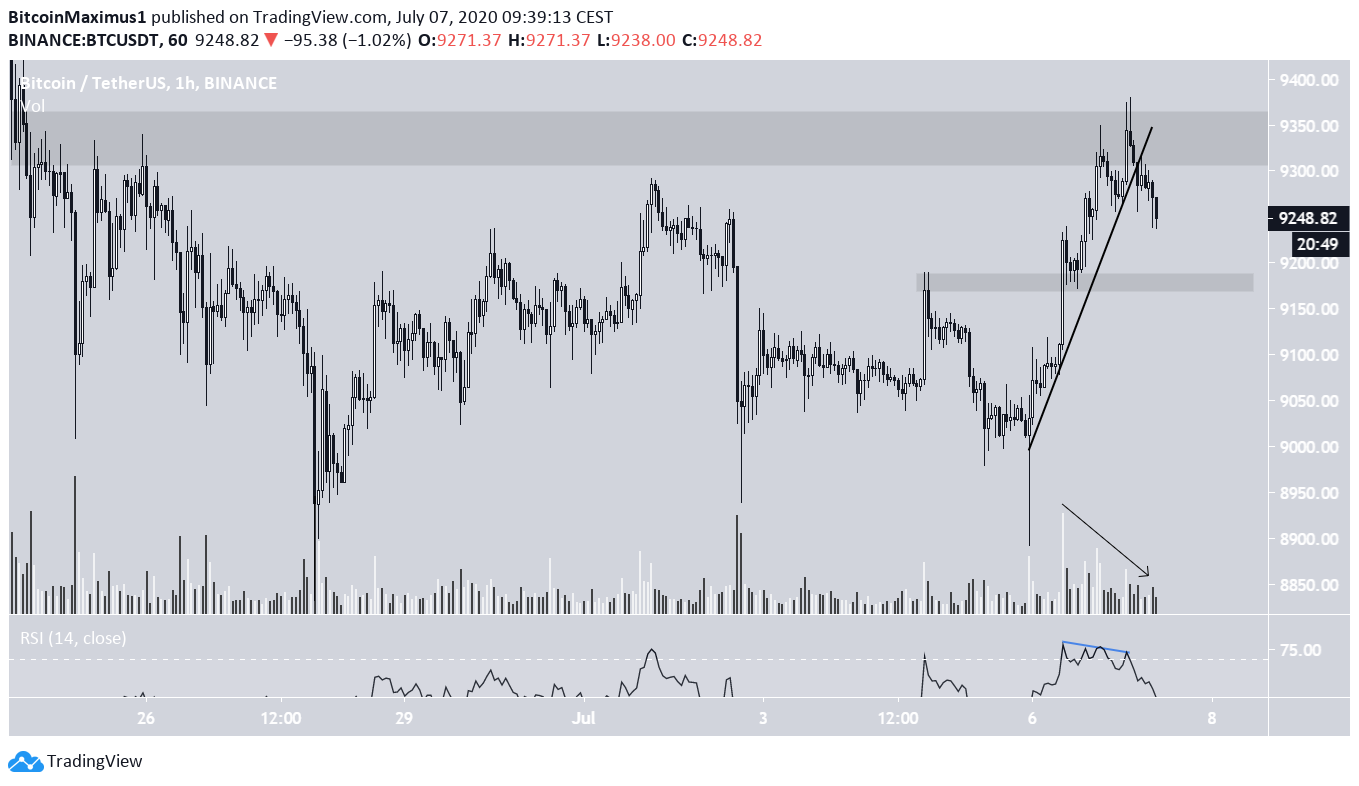
The hourly chart warns of an impending decrease.
First, the price has broken down from a short-term ascending support line, which had an extremely steep slope. The breakdown was preceded by a bearish divergence in the hourly RSI, and a decrease in volume near the end of the move.
As it stands, it seems that BTC will decrease towards the minor $9,180 support area.
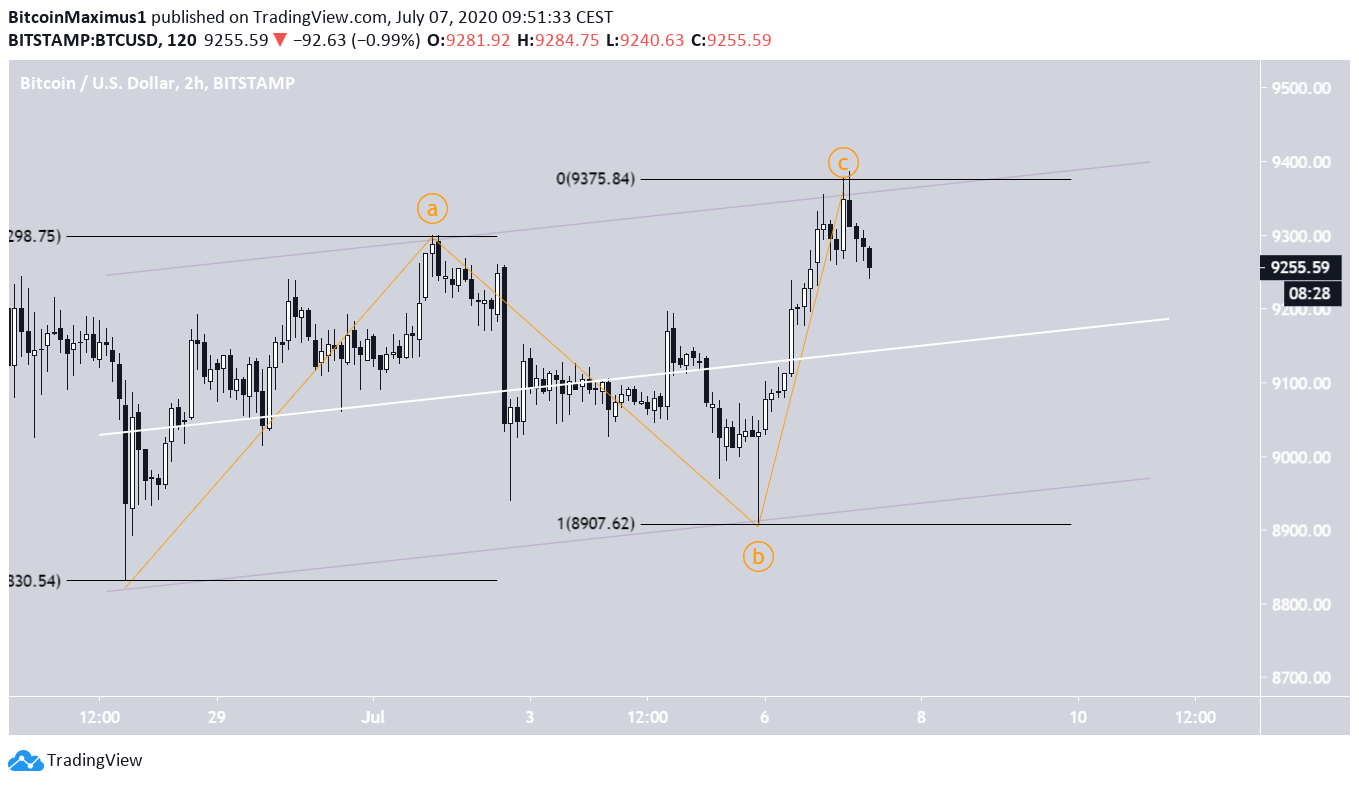
Currently, it seems that the price is trading inside an ascending parallel channel, which means that this is likely to be a corrective movement.
Furthermore, the length of waves A and C has been identical, and the fact that wave C ended right at the resistance line of the channel makes this a very likely place for the move to end.
This would be confirmed by a decrease below the middle of the channel at $9,190, which would take the price to the support line of the channel at $9,000.
For our previous analysis, click here.


