The Bitcoin price has broken out from a short-term descending resistance line.
There is resistance at $9,650 and $9,820.
The price is trading inside a longer-term descending wedge.
promo
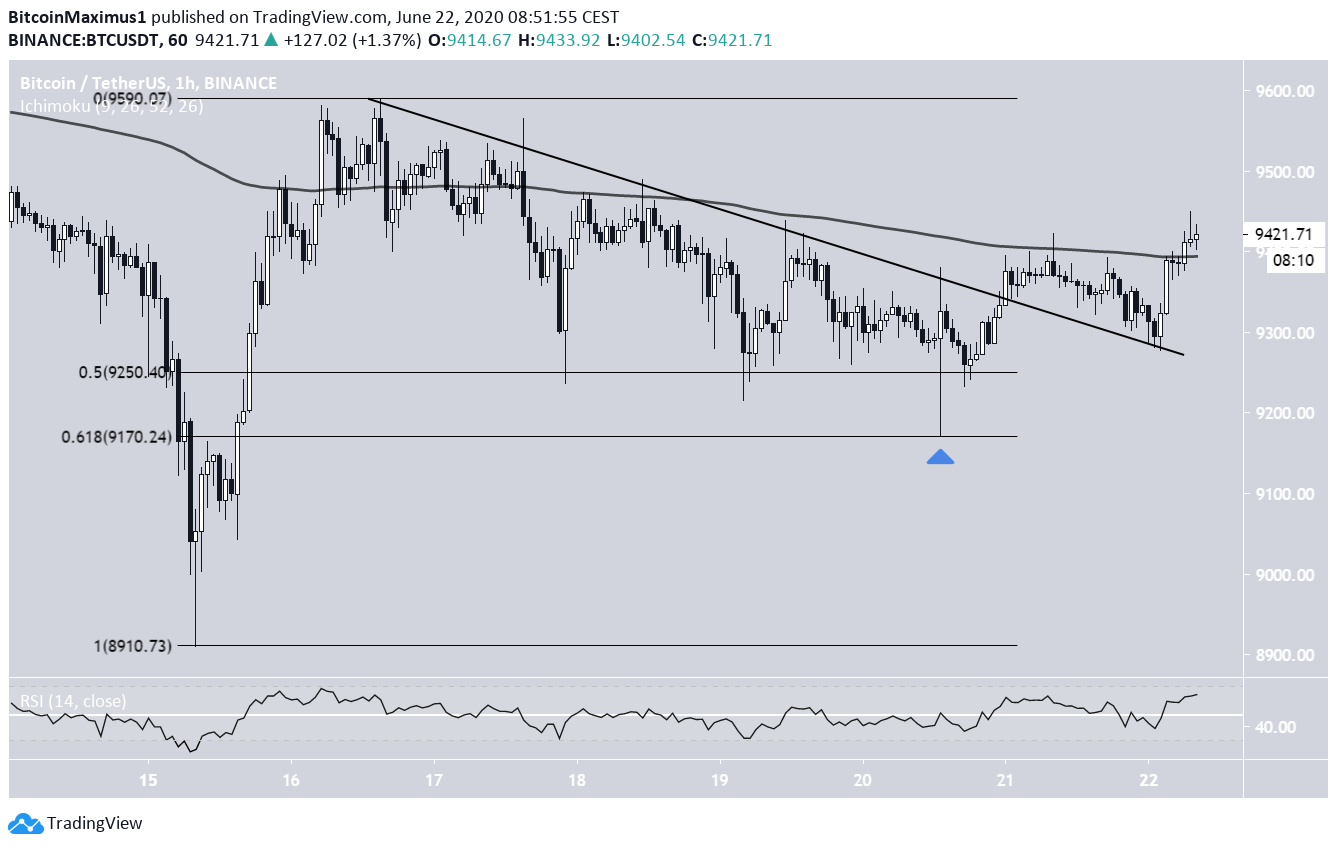
On June 21, the Bitcoin (BTC) price broke out from a descending resistance line that had been in place since July 16. This opens the way for an increase that could carry the price upwards of $9,600.
The Bitcoin price had been following a descending resistance line since June 16. The price decreased at the rate predicted by the line, which was also strengthened by the presence of the 200-hour moving average (MA), making numerous unsuccessful attempts at breaking out.
Short-Term Bitcoin Breakout
On June 20, the price bounced at the 0.5 Fib level of the entire previous upward move, creating a long lower-wick that reached the 0.618 Fib level before breaking out. At the time of press, BTC was in the process of flipping the 200-hour MA as support and continuing its upward movement.
Besides a minor resistance level at $9,450, the road to $9,600 and the top of the descending resistance line seems clear.
Bitcoin Chart By Tradingview
Long-Term Movement
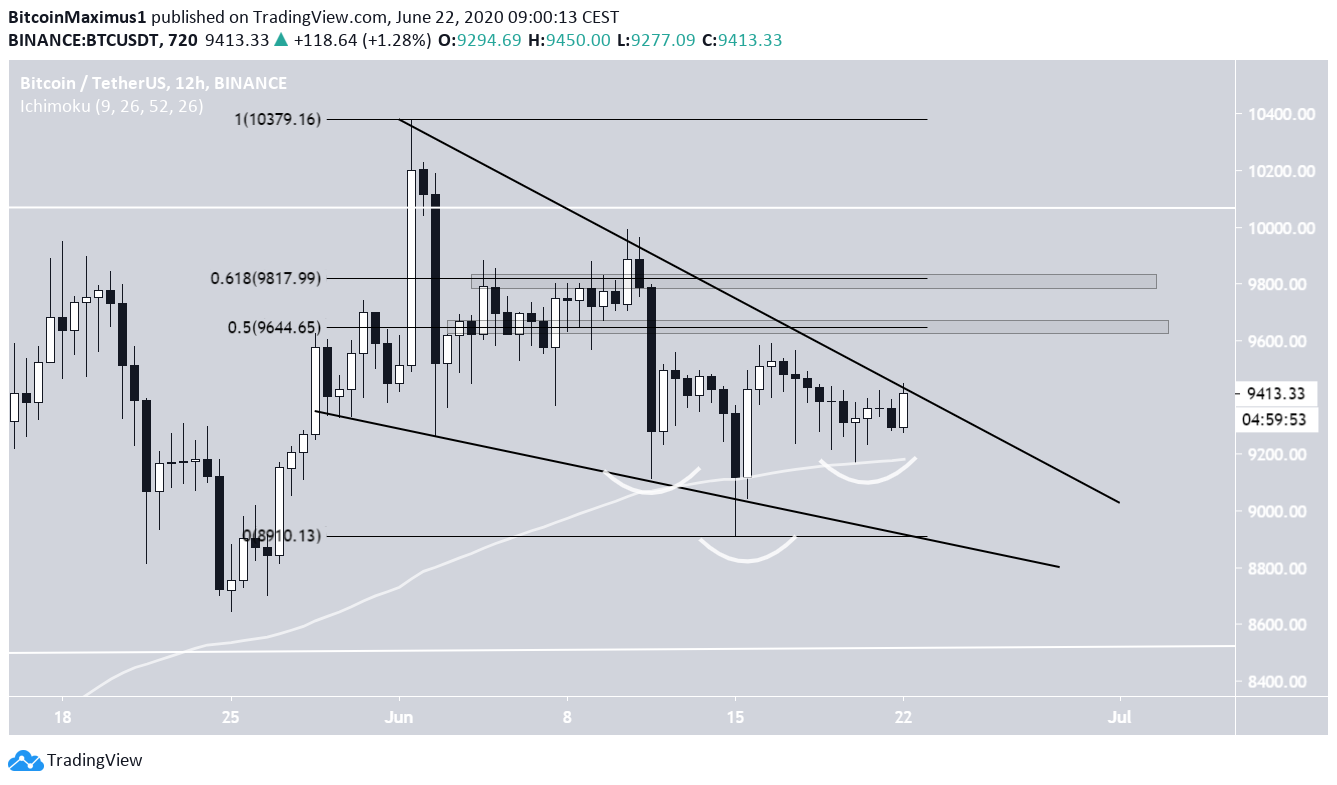
In the longer-term, BTC has been trading inside a descending wedge since June 1, currently being directly under the resistance line. In addition, it seems that the price has completed what resembles an inverse head-and-shoulders pattern, which is considered bullish. Therefore, there is a bullish reversal pattern inside a bullish reversal pattern.
If the price breaks out, the two closest resistance levels would be found at $9,650 and $9,820.
Bitcoin Chart By Tradingview
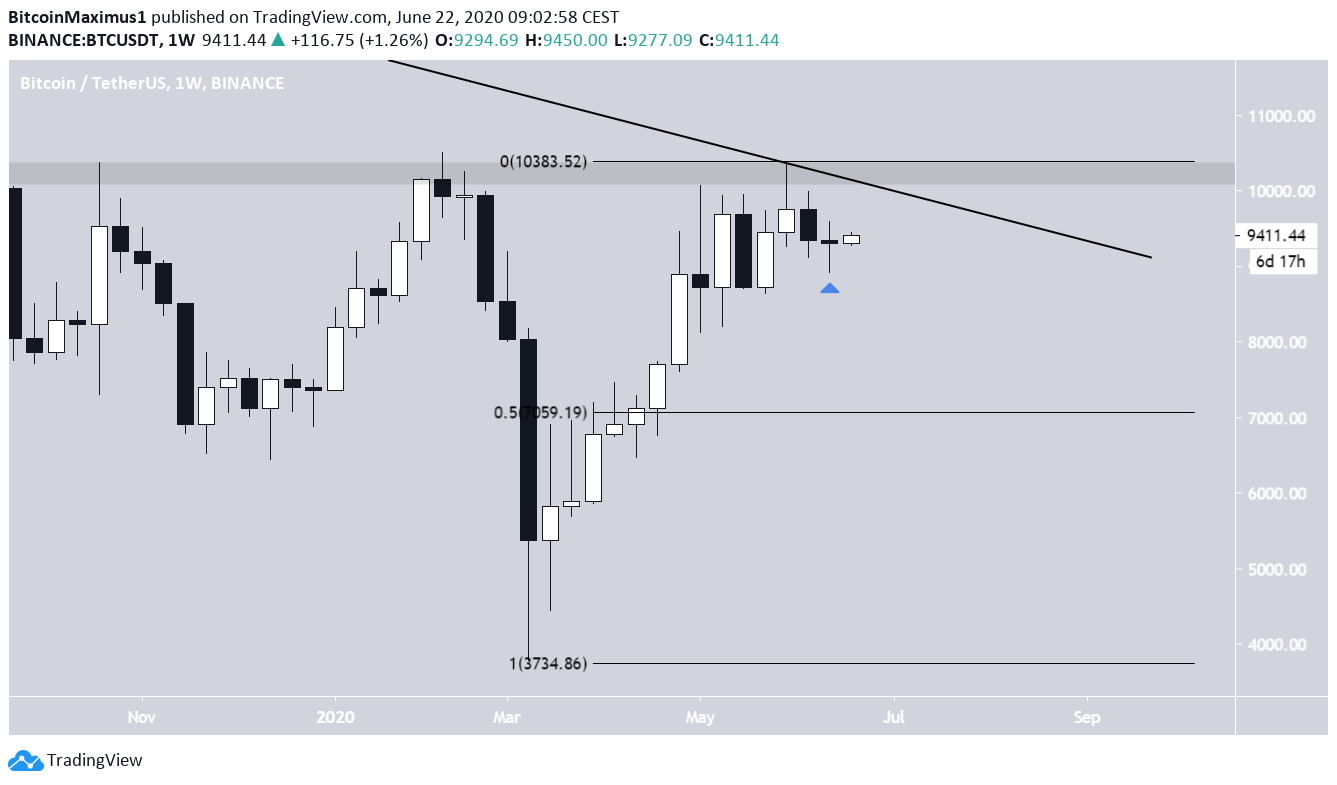
However, the weekly chart does not paint a bullish picture. The price has been decreasing since it was rejected by the long-term descending resistance line and the $10,400 resistance area on June 1.
Last week, BTC created a Doji candle, which when coming after a decrease usually indicates that the trend is becoming neutral. The price movement cannot be considered bullish until BTC breaks out from both the long-term resistance line and $10,400 resistance area, and validates them as support.
Bitcoin Chart By Tradingview
To conclude, the Bitcoin price has broken out from a short-term resistance line and is in the process of breaking out from a bullish pattern. However, the long-term trend cannot be considered bullish until BTC breaks out from the long-term descending resistance line and $10,400 resistance area.
For our previous analysis, click here.
Sponsored
Sponsored
Top crypto platforms in the US
Don’t invest unless you’re prepared to lose all the money you invest.
This is a high-risk investment and you should not expect to be protected if something goes wrong.
In line with the Trust Project guidelines, this price analysis article is for informational purposes only and should not be considered financial or investment advice. BeInCrypto is committed to accurate, unbiased reporting, but market conditions are subject to change without notice. Always conduct your own research and consult with a professional before making any financial decisions. Please note that our Terms and Conditions, Privacy Policy, and Disclaimers have been updated.
Valdrin discovered cryptocurrencies while he was getting his MSc in Financial Markets from the Barcelona School of Economics. Shortly after graduating, he began writing for several different cryptocurrency related websites as a freelancer before eventually taking on the role of BeInCrypto's Senior Analyst.
(I do not have a discord and will not contact you first there. Beware of scammers)