


On June 18, the Bitcoin (BTC) price failed to break out from its current pattern and fell to the $9,250 support area instead.
This area is the middle of the long-term trading range BTC has been stuck in since May. Movement above or below can be helpful in determining the longer-term trend.
Current Bitcoin Support
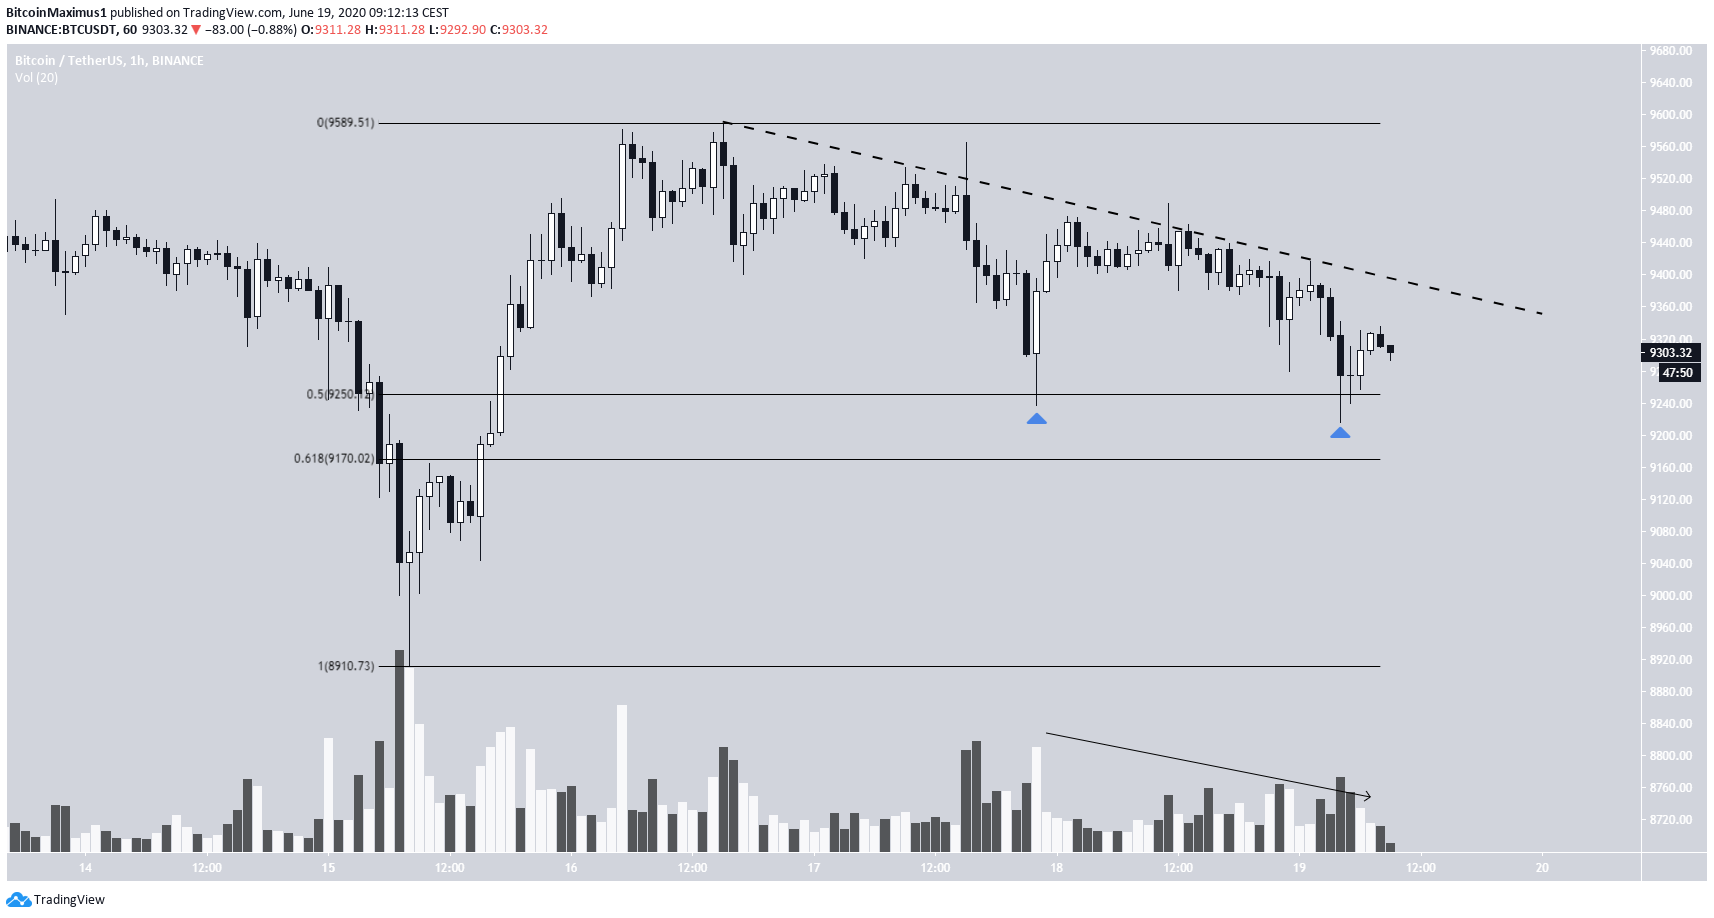
The Bitcoin price is currently trading very close to the $9,250 support area, which is the 0.5 Fib level of the entire upward movement that started on June 15. The price reached this area on June 17 and immediately bounced upward with above-average volume.
The current bounce is noticeably weaker, both in magnitude and volume. This is a bearish sign that indicates that the bulls might be losing strength.
Even though this can be seen as a double-bottom pattern, there is no bullish divergence in the RSI to indicate an impending increase. Combined with the lack of a bounce relative to the first bottom, this makes it less likely that the price will move upwards.
Unless the price breaks out above the current descending resistance line, BTC is expected to eventually decrease below this support level.
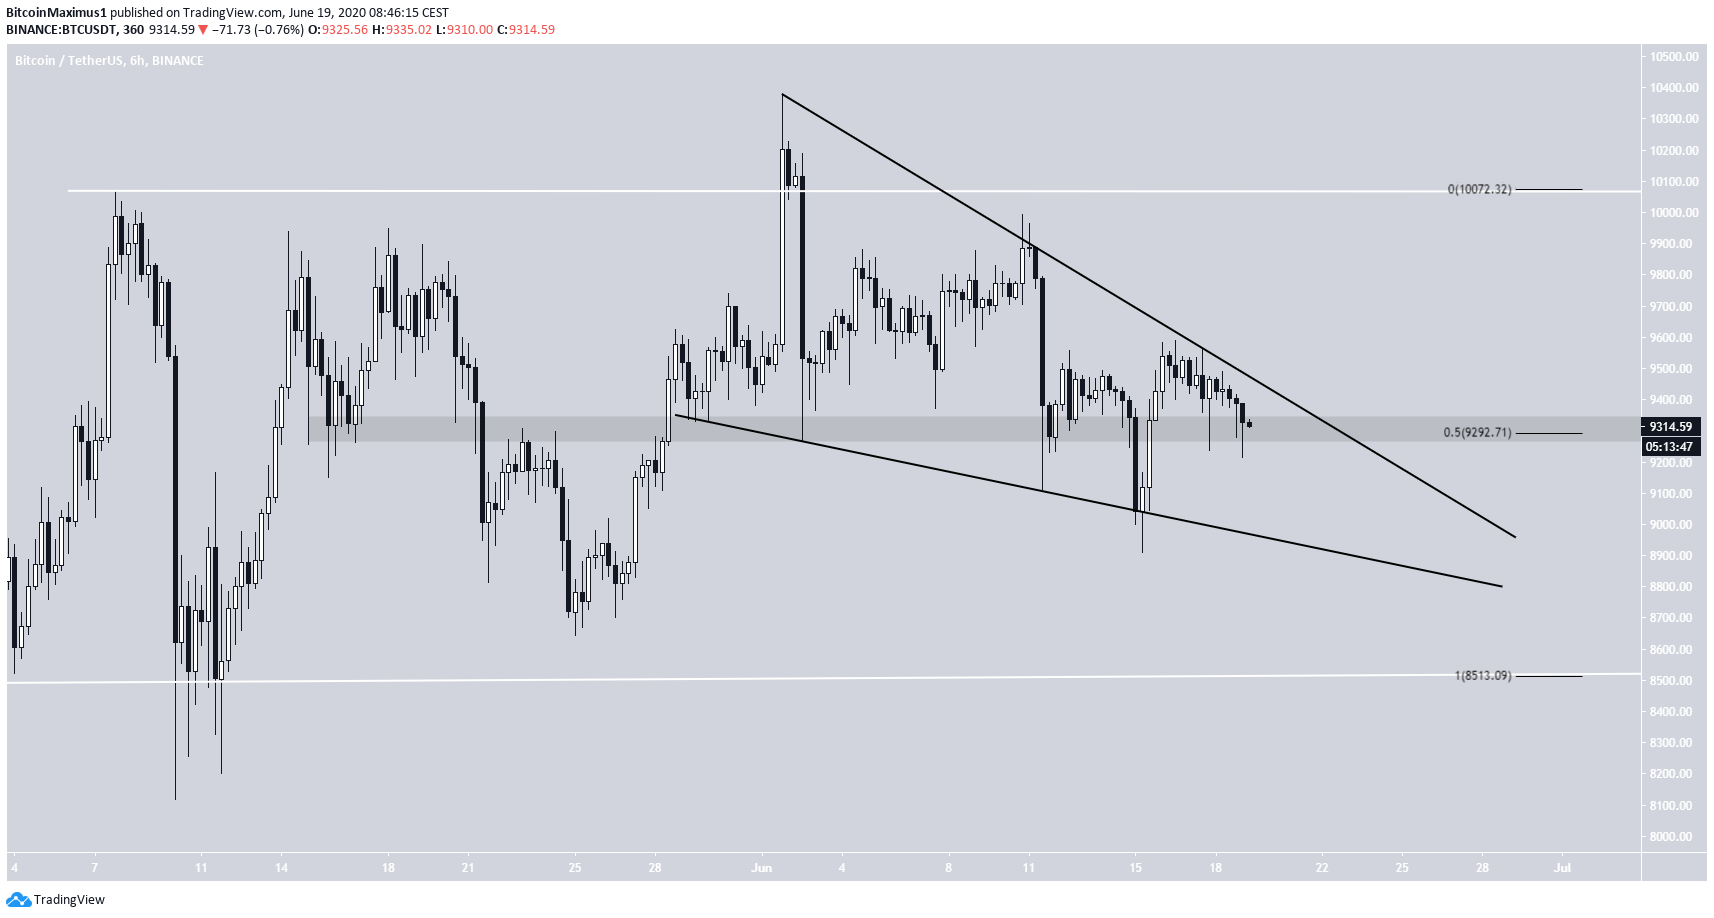
A slightly longer-term chart reveals that the price has possibly been trading inside a descending wedge since June 11, currently being very close to the resistance line of the pattern.
In addition, the $9,250 area is also the 0.5 Fib level of the entire trading range between $8,500-$10,100, which has been in place since May 3. Therefore, a decrease below this level would be a major bearish development that could trigger a decrease all the way to the bottom of the range at $8,500, or at least to the descending support line at $8,800.
Long-Term Range
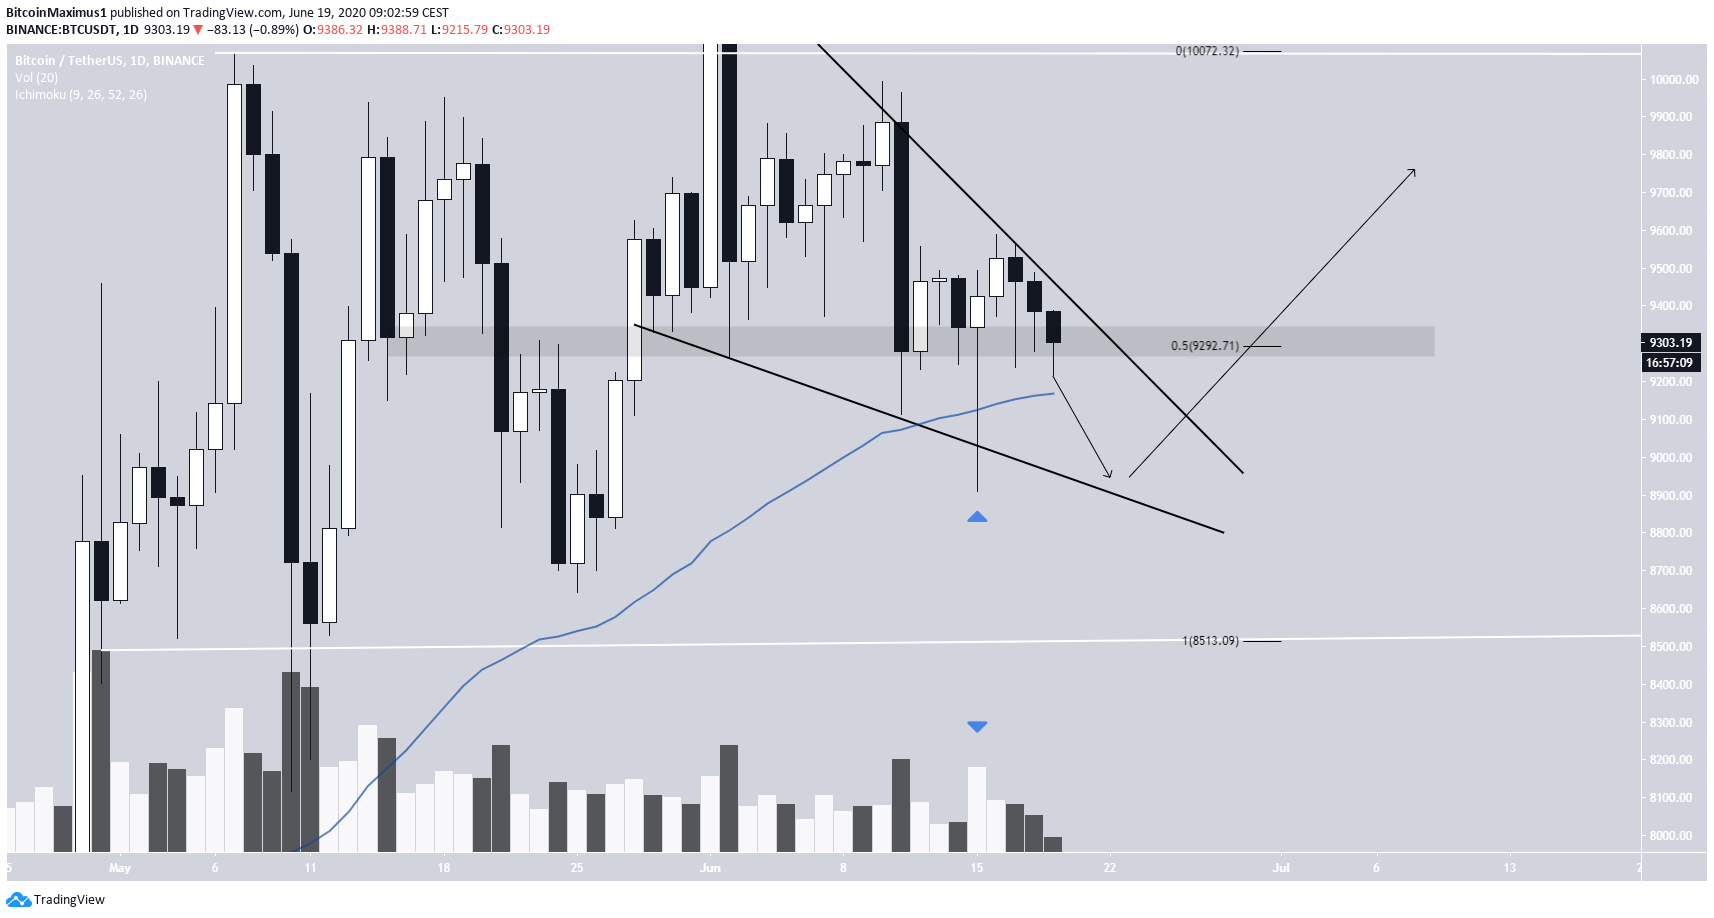
The daily chart reveals that the longer-term outlook can still be considered bullish. The bullish hammer created on June 15 had considerable volume and shows considerable buying pressure near $8,900. This is also the level of the 50-day MA, which caused a bounce.
Therefore, if the price approaches the levels of the long lower-wick, it would be expected to find support, and eventually break out from the descending wedge.
For our previous analysis, click here.


