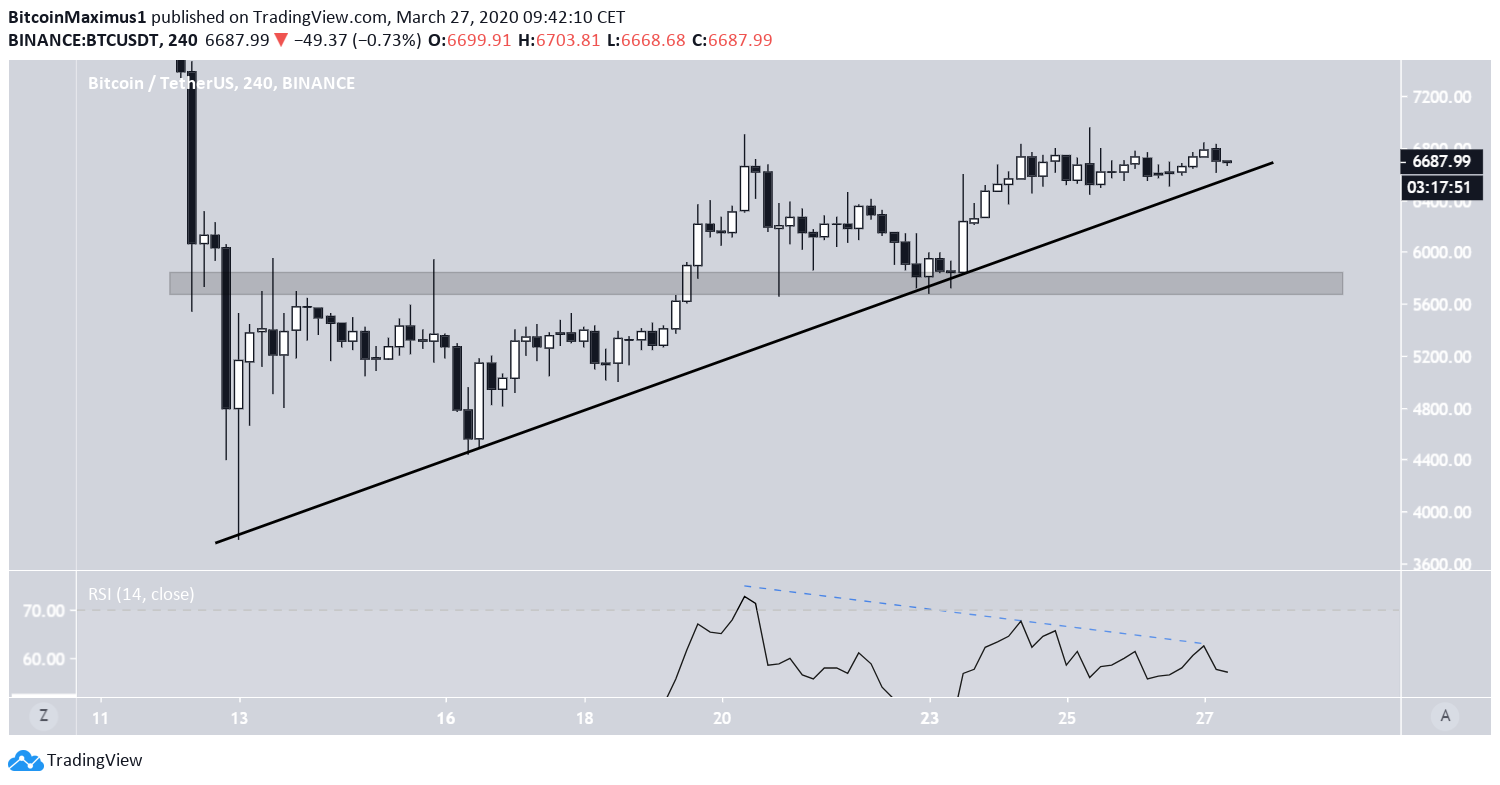
Over the past three days, the Bitcoin price has been trading in a range between $6,500-$6,900 and has made several unsuccessful attempts at breaking out above the latter. It has possibly created a short-term bearish pattern.
Bitcoin Ascending Support Line
The Bitcoin price has been following an ascending support line since March 13. At the time of publishing, it was very close to validating this support for the fourth time. Throughout riding this ascending support line, the price has reached a high of nearly $6,900 three times. However, the RSI-highs have been smaller each time. This is known as bearish divergence and often precedes price decreases. Finally, the trend-line of the bearish divergence has yet to break down. In addition, candlestick values near $6,900 have been characterized with long upper wicks, a bearish sign that supports further price movements to the downside. If the price breaks down, the closest support area is found around $5,700.

Long-Term Outlook
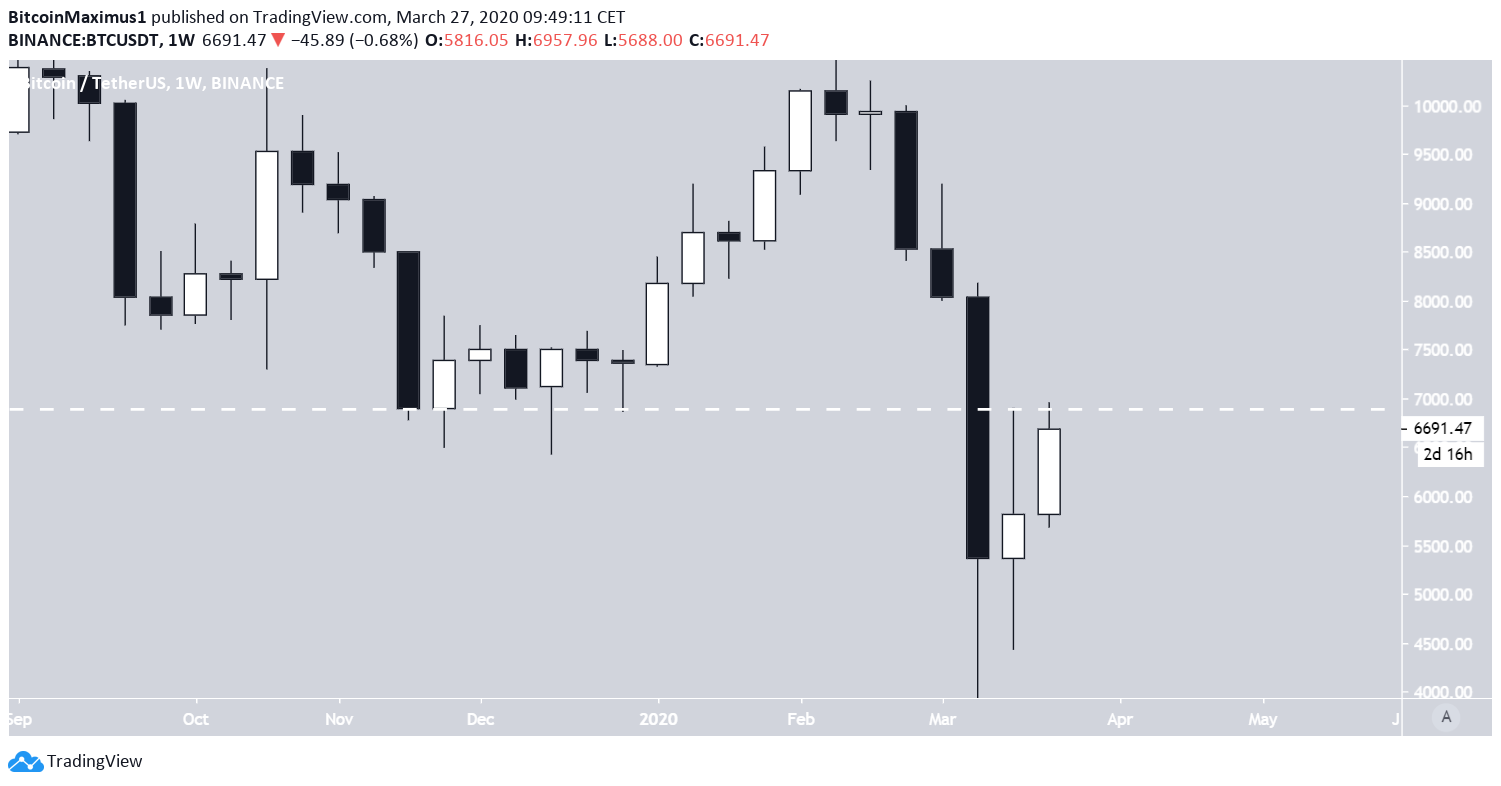
A look at the weekly time-frame reveals the main resistance level that the price has yet to flip at $6900. In addition, just by looking at the size of the current two weekly candlesticks relative to the previous bearish ones, we can see that this is much more likely to be a retracement before the beginning of a new upward movement. Until the price is able to reach a weekly close above this $6,900 level, the directional bias remains bearish.
Disclaimer
In line with the Trust Project guidelines, this price analysis article is for informational purposes only and should not be considered financial or investment advice. BeInCrypto is committed to accurate, unbiased reporting, but market conditions are subject to change without notice. Always conduct your own research and consult with a professional before making any financial decisions. Please note that our Terms and Conditions, Privacy Policy, and Disclaimers have been updated.

Valdrin Tahiri
Valdrin discovered cryptocurrencies while he was getting his MSc in Financial Markets from the Barcelona School of Economics. Shortly after graduating, he began writing for several different cryptocurrency related websites as a freelancer before eventually taking on the role of BeInCrypto's Senior Analyst.
(I do not have a discord and will not contact you first there. Beware of scammers)
READ FULL BIO
Sponsored
Sponsored

