


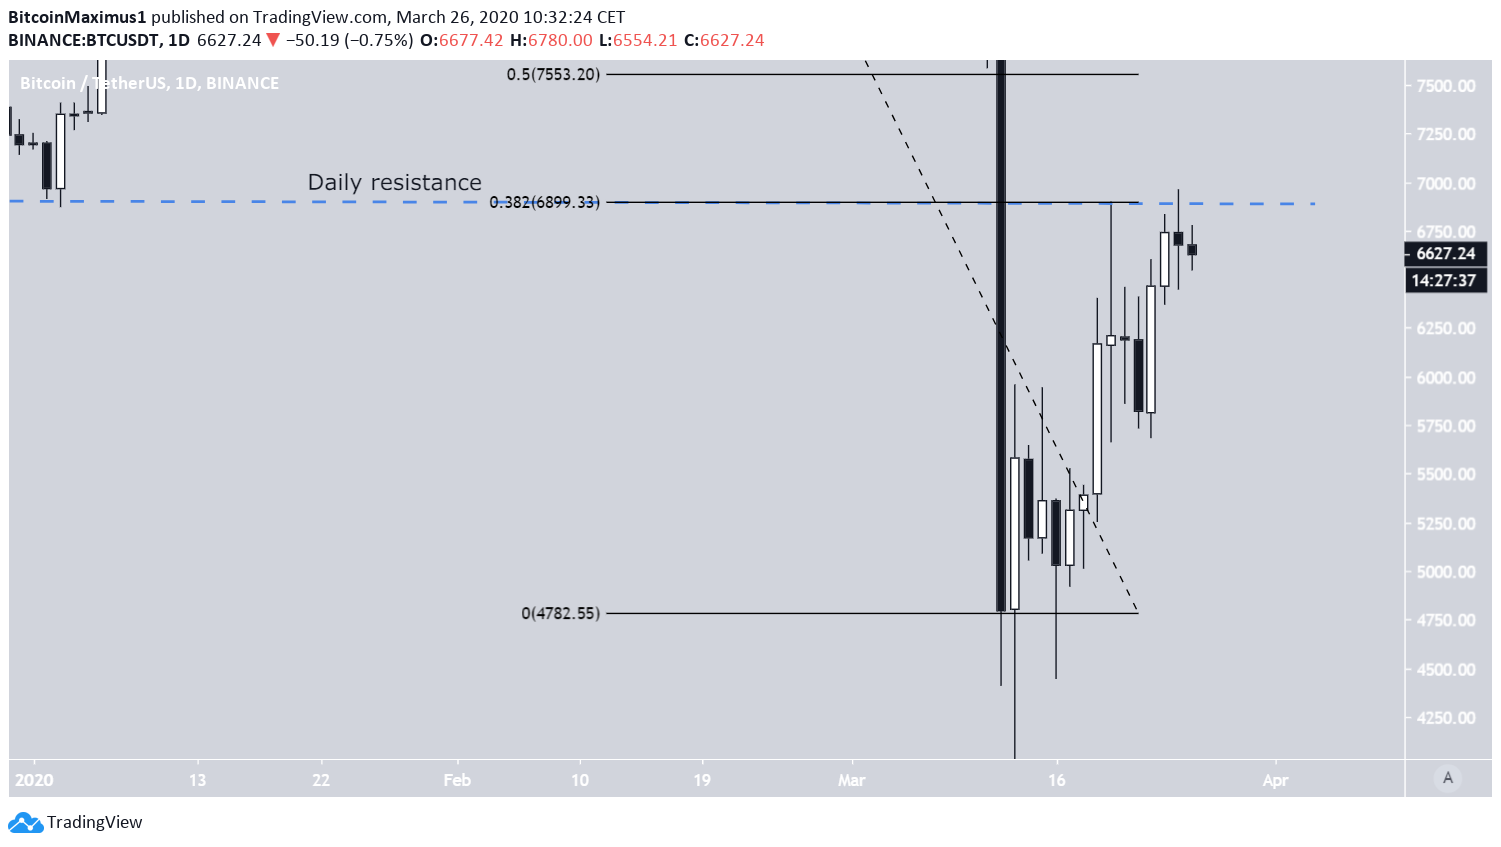
On March 24, the Bitcoin price reached a daily close of $6,731 and continued its increase the next day, reaching a high of $6,975. However, the higher prices could not be sustained, and the BTC price failed to close above the major resistance area of $6,900.
On the contrary, it created a bearish Doji candlestick and has been gradually decreasing since.
Main Resistance Area
On March 25, the Bitcoin price reached the $6,900 resistance level, which is both the closest significant daily resistance level and the 0.382 Fib level of the entire previous decrease. The price was unable to break out above this level, and instead created a bearish Doji candlestick and decreased slightly.
Previously, the price had reached this level on March 20, but created a very long upper-wick and decreased significantly afterward.
Therefore, until it is able to successfully break out above this level, the BTC price movement is considered bearish in the medium-term.
Double-Top
Lower time-frames reveal that the price has created a bearish reversal pattern — the double top. The candlesticks forming the second top have been characterized with long upper wicks, a bearish development. The double-top is combined with a significant bearish divergence in the RSI, a sign that the price might soon initiate a rapid decrease.
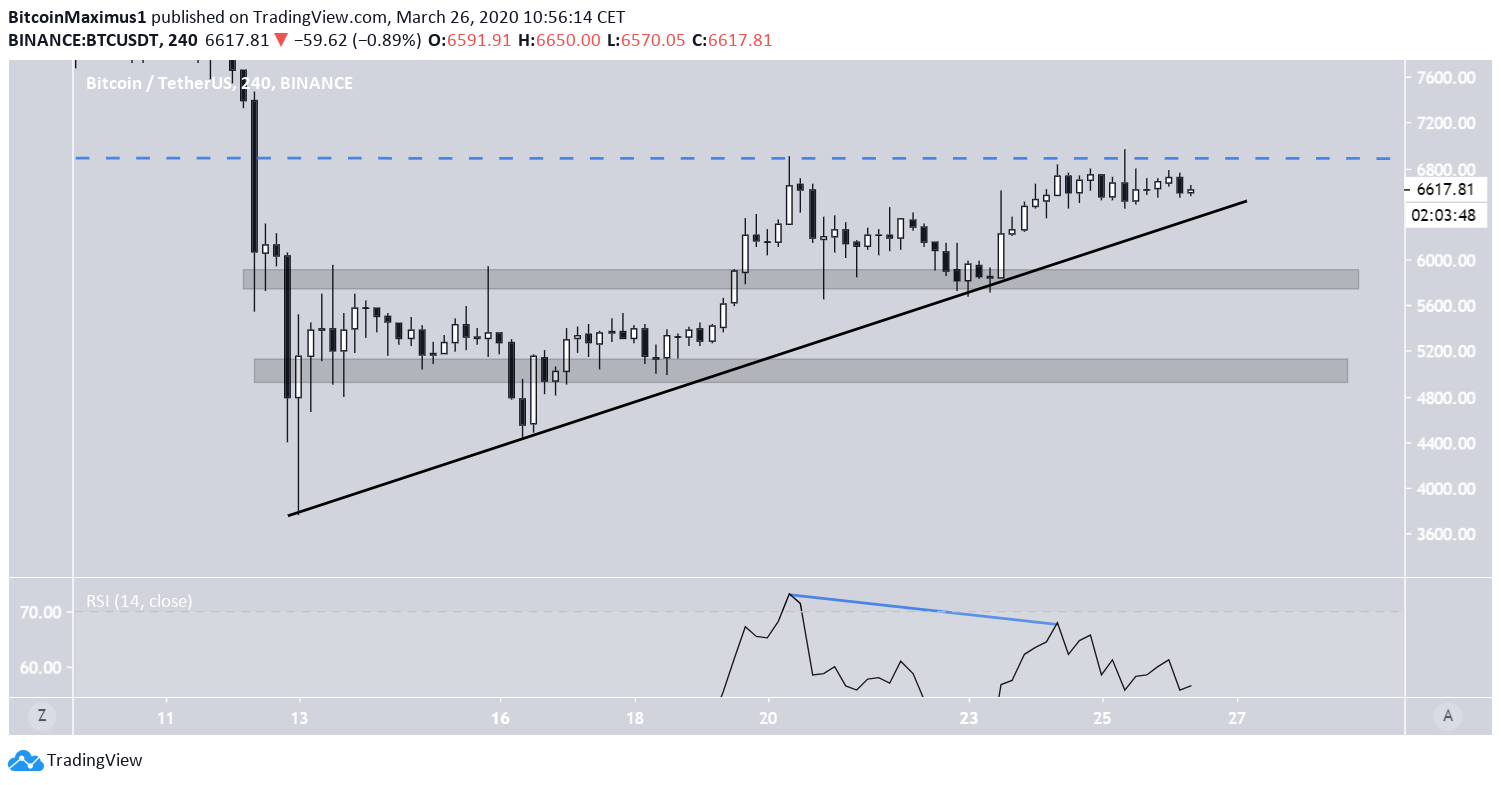
In addition, BTC is following an ascending support line, currently being very close to it. A breakdown from this pattern could trigger the aforementioned decrease.
If that happens, the closest support levels are found at $5,750 and $5,000.
To conclude, the BTC price has created a double-top, which is considered a bearish reversal pattern. If the price completes the pattern and breaks down from the current ascending support line, it is expected to decrease rapidly towards $5,750 and eventually $5,000.
For those interested in BeInCrypto’s previous Bitcoin analysis, click here.



