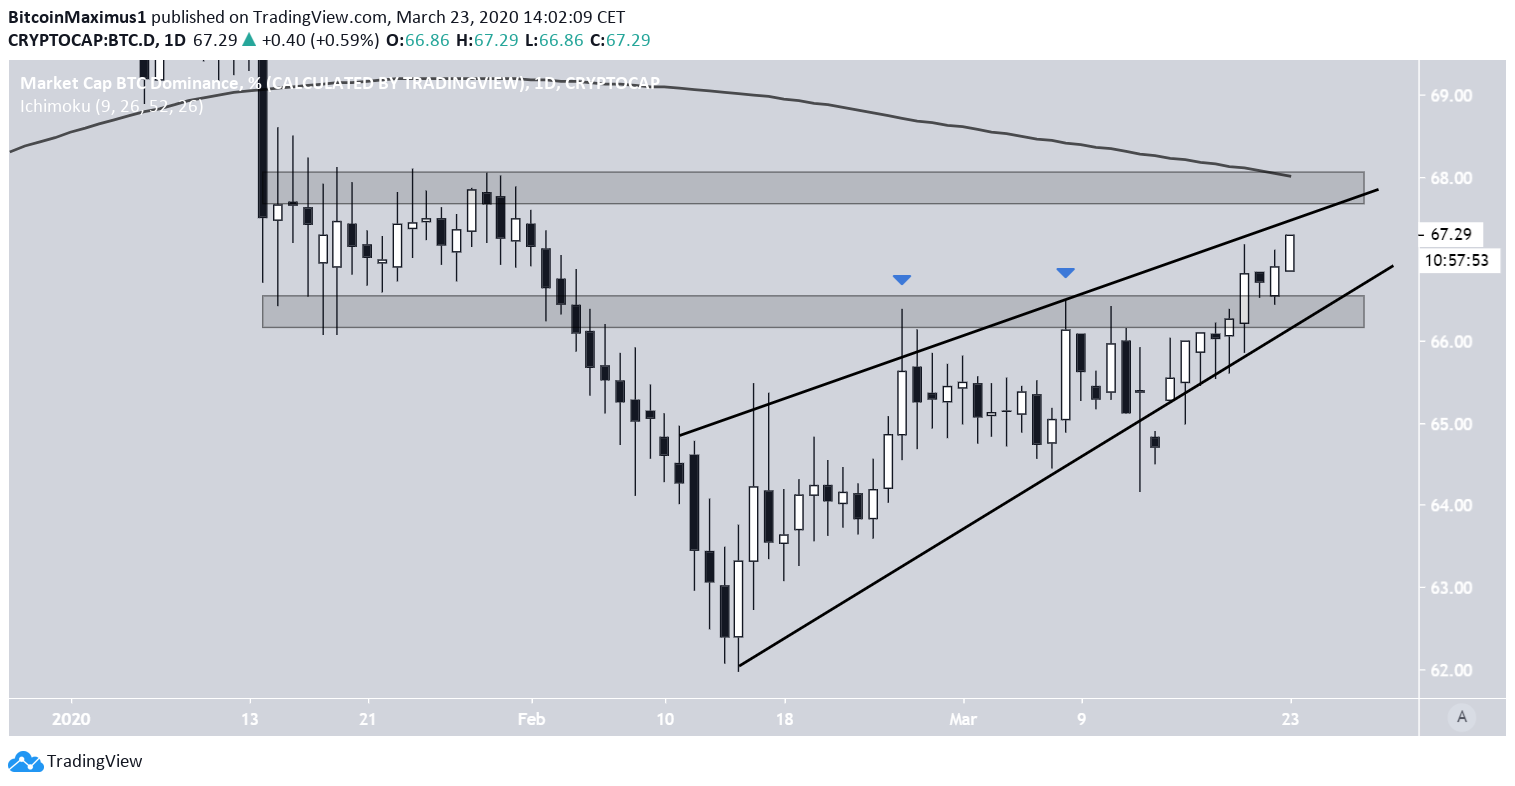
On Feb. 15, the BTC dominance rate reached a low of 61.78%. This came after a period of a sustained decrease that had begun in early January, leading many altcoins to post significant increases. However, the trend reversed afterward and the Bitcoin dominance rate has been increasing ever since, recently breaking out above a crucial resistance area.
The resistance area was found at 67.5%, and the price had been struggling to move above it for the majority of March. However, the price has not confirmed its bullish tendencies yet.
Market analyst and trader @Galaxytraging tweeted a Bitcoin dominance chart that shows the rate mired inside an ascending wedge, which is considered a bearish reversal pattern. He hopes that the price will break down, allowing for altcoins to post gains against their BTC pairs.
Will the Bitcoin dominance rate break down or will it continue to decrease as it has done since February? Continue reading below if you are interested in finding out.$BTC dominance
— GalaxyTrading🅡 (@GalaxyTraging) March 23, 2020
We all hope for that to happen, so alts have their time again.#Bitcoin #BTC #cryptocurrency #trading #altcoin #alts pic.twitter.com/gVZbvhtZpI
Ascending Wedge
The Bitcoin dominance rate is seemingly trading inside an ascending wedge, having done so since Feb. 15. There are two important developments worth keeping an eye on. First, the 65.5% area, which is possibly acting as support. The price failed to reclaim it numerous times in March before finally being able to do so on March 20. Secondly, there is the 68% resistance area. This area coincides with both the ascending resistance line of the wedge and the 200-week moving average (MA). Therefore, if the price is successful in reclaiming it, we could state with confidence that it is in a bullish trend.
Ascending Support Line
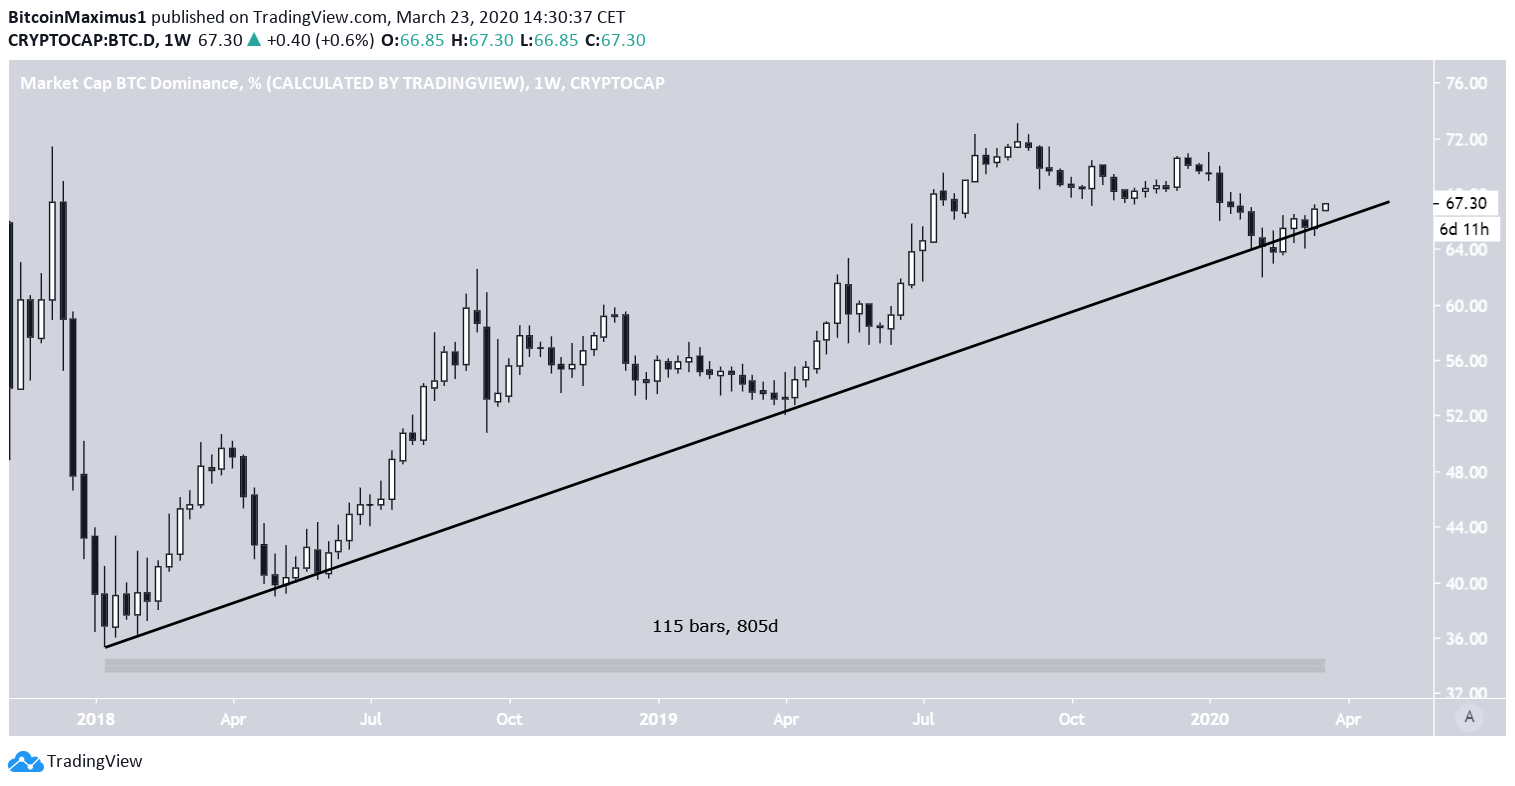
In the long-term, the Bitcoin dominance rate has been following an ascending support line for 805 days. While it initially broke down below it in February, the recent increase has caused the price to reclaim this level. If the price is able to reach a weekly close above it, it would also mean that it has moved above its 200-day MA, confirming its bullish trend.
Disclaimer
In line with the Trust Project guidelines, this price analysis article is for informational purposes only and should not be considered financial or investment advice. BeInCrypto is committed to accurate, unbiased reporting, but market conditions are subject to change without notice. Always conduct your own research and consult with a professional before making any financial decisions. Please note that our Terms and Conditions, Privacy Policy, and Disclaimers have been updated.

Valdrin Tahiri
Valdrin discovered cryptocurrencies while he was getting his MSc in Financial Markets from the Barcelona School of Economics. Shortly after graduating, he began writing for several different cryptocurrency related websites as a freelancer before eventually taking on the role of BeInCrypto's Senior Analyst.
(I do not have a discord and will not contact you first there. Beware of scammers)
READ FULL BIO
Sponsored
Sponsored
