

Ethereum (ETH) price just slipped below $3,800 on its 10th anniversary, cooling off after briefly testing $3,900 earlier this week. Traders worldwide are still fixated on the psychological $4,000 level, but the latest on-chain data hints that this rally might not be as strong as it seems.
Despite monthly gains of over 50%, the price is only 2% up week-on-week, and cracks are starting to show beneath the surface. The setup could be a brewing bull trap, leaving late buyers vulnerable.
Coinbase Premium Index Turns Deeply Negative
One of the most telling signals comes from the Coinbase Premium Index. This indicator measures the difference between Ethereum’s price on Coinbase and other global exchanges.
Historically, when the index turns positive, it indicates stronger buying activity from US-based institutions. However, the index has plunged to -0.01, its lowest level since May.
For token TA and market updates: Want more token insights like this? Sign up for Editor Harsh Notariya’s Daily Crypto Newsletter here.
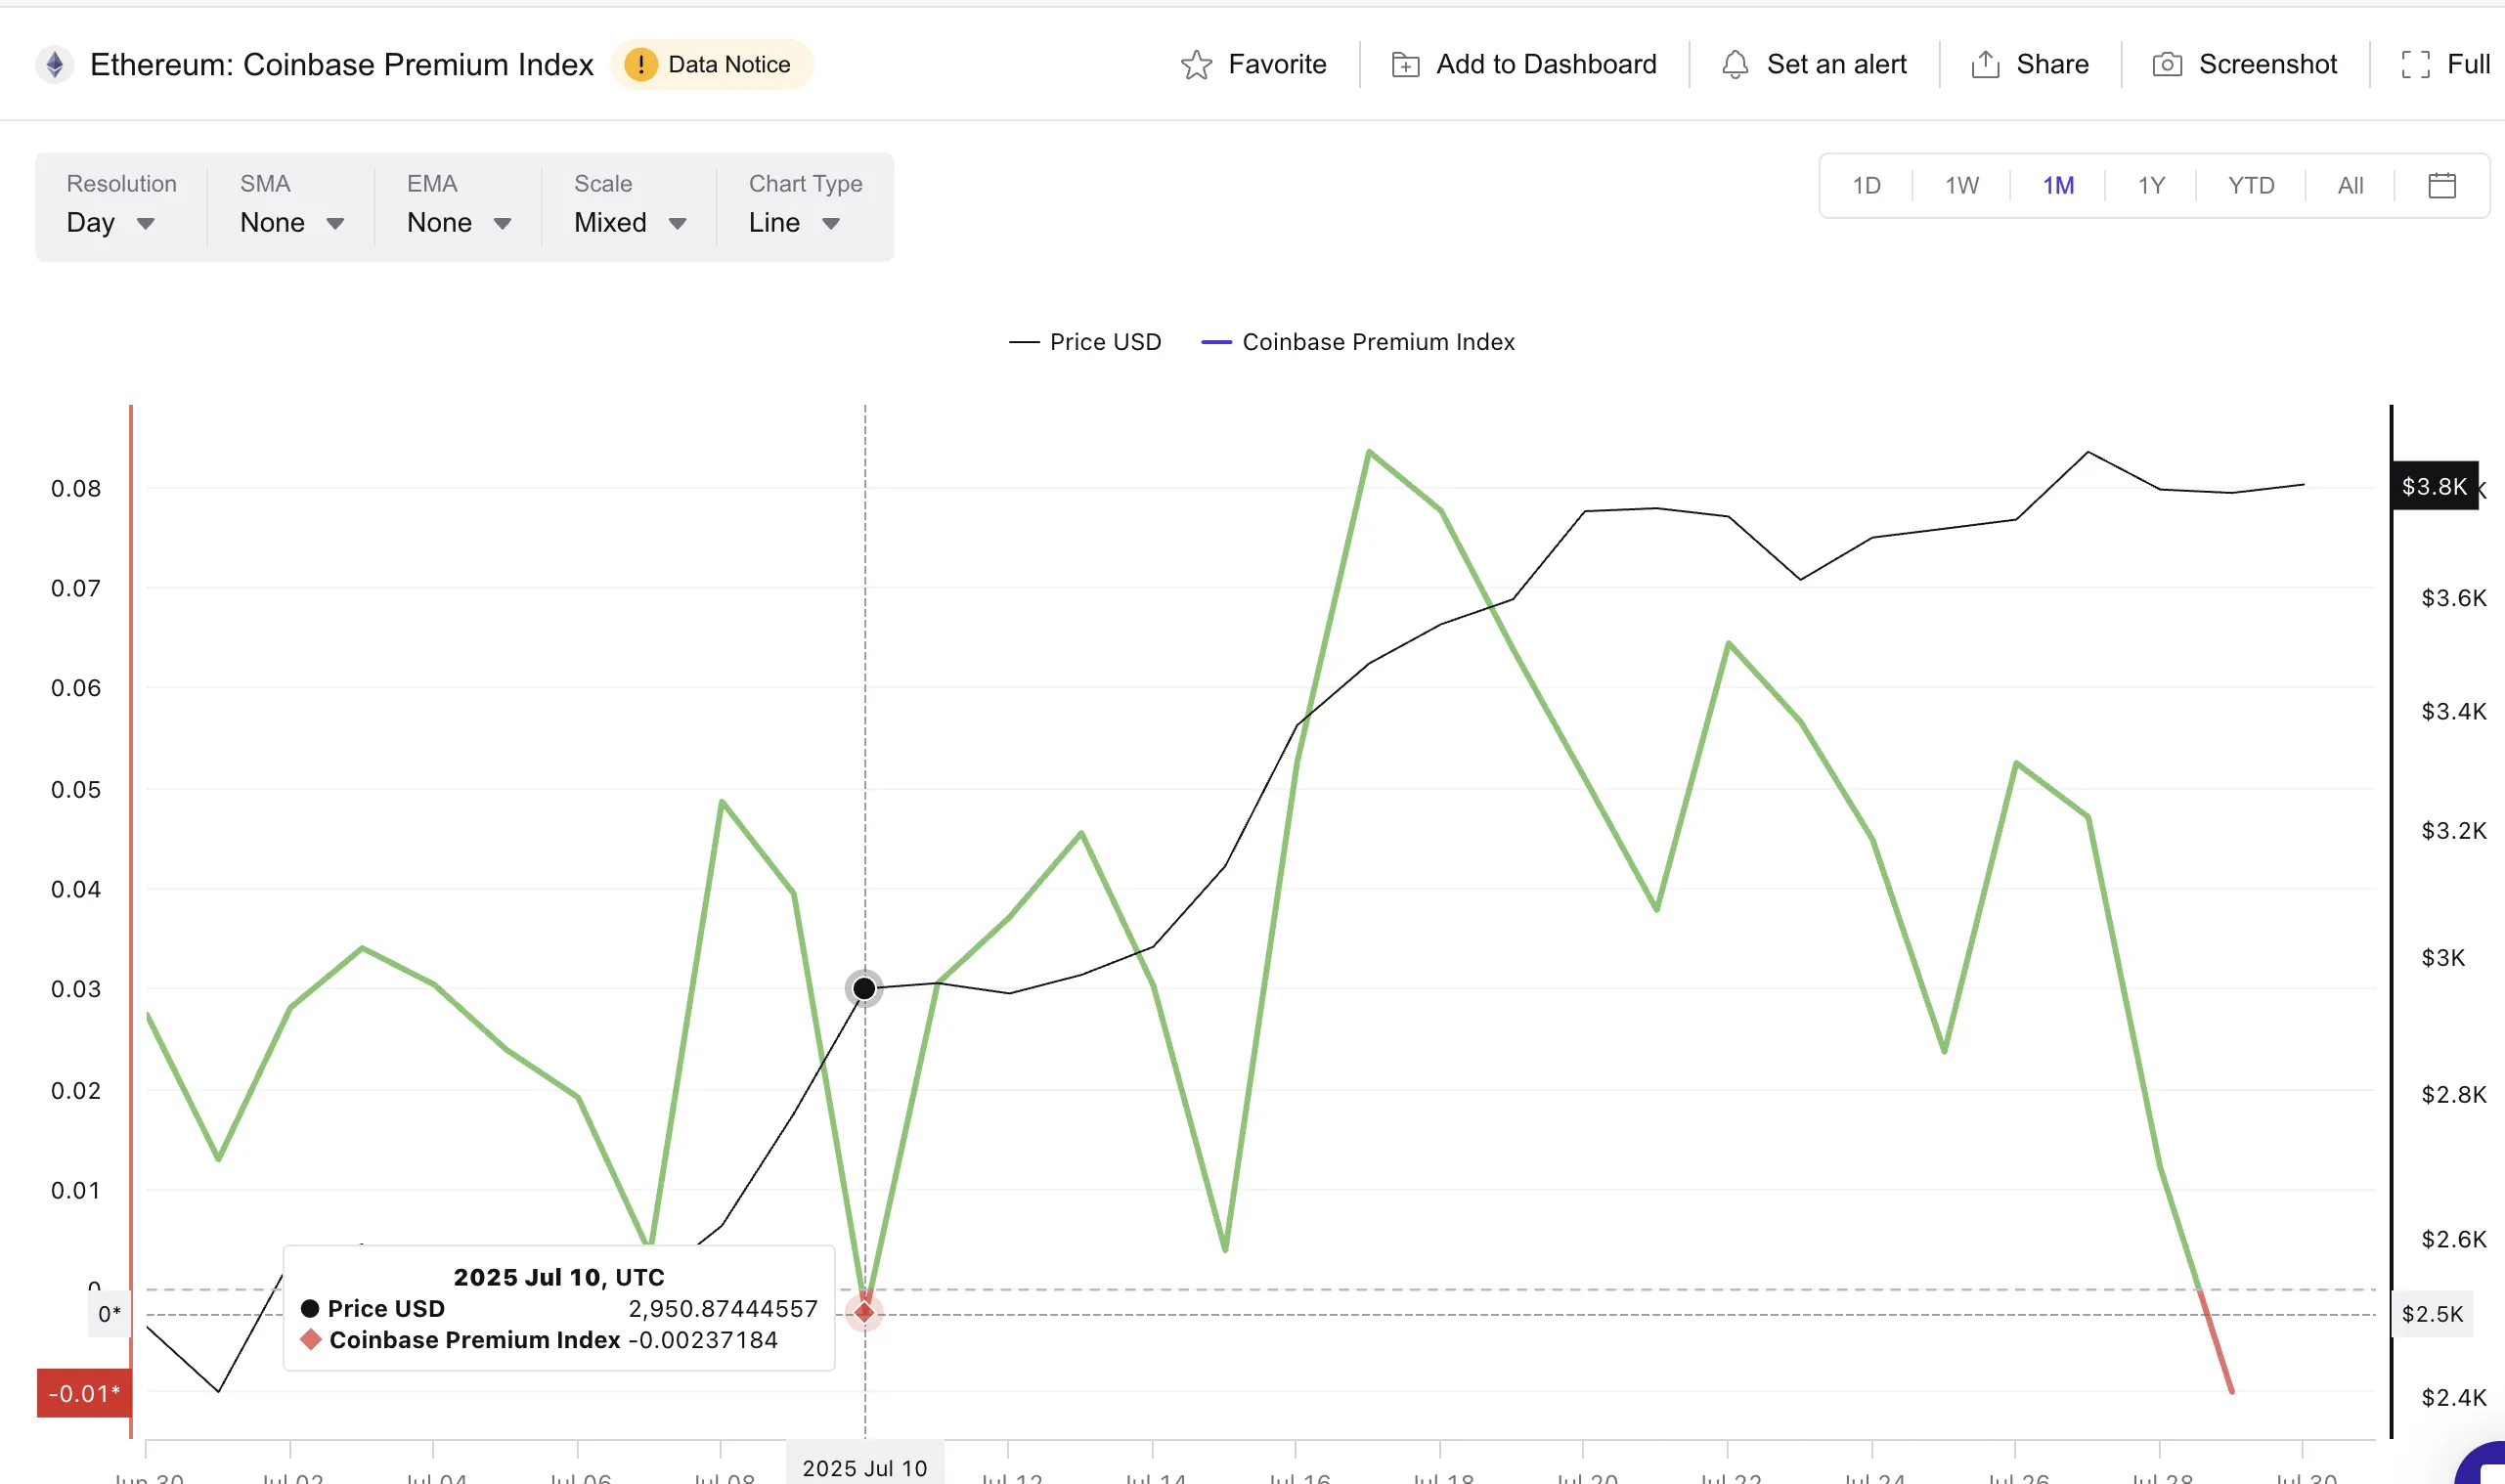
For context, on July 10th, the index only briefly dipped negative to -0.0023, and the ETH price barely reacted. This time, the drop is much deeper, suggesting US buyers are stepping back despite all the ETF optimism in July.
The premium flipping negative while the broader market remains buoyant signals a potential demand gap from high-volume players in the US. This absence of strong institutional bids could weaken the foundation of ETH’s climb, making it easier for the rally to lose steam or reverse quickly.
CMF and OBV Tell a Conflicting Story
The Chaikin Money Flow (CMF) adds another layer to this trap narrative. Over the past week, CMF has been making lower highs, showing declining money flow despite the price making higher highs.
The Chaikin Money Flow tracks buying and selling pressure based on price and volume.
This divergence is often a precursor to weakening buying pressure; fewer dollars are flowing into the crypto even as the ETH price chart climbs.
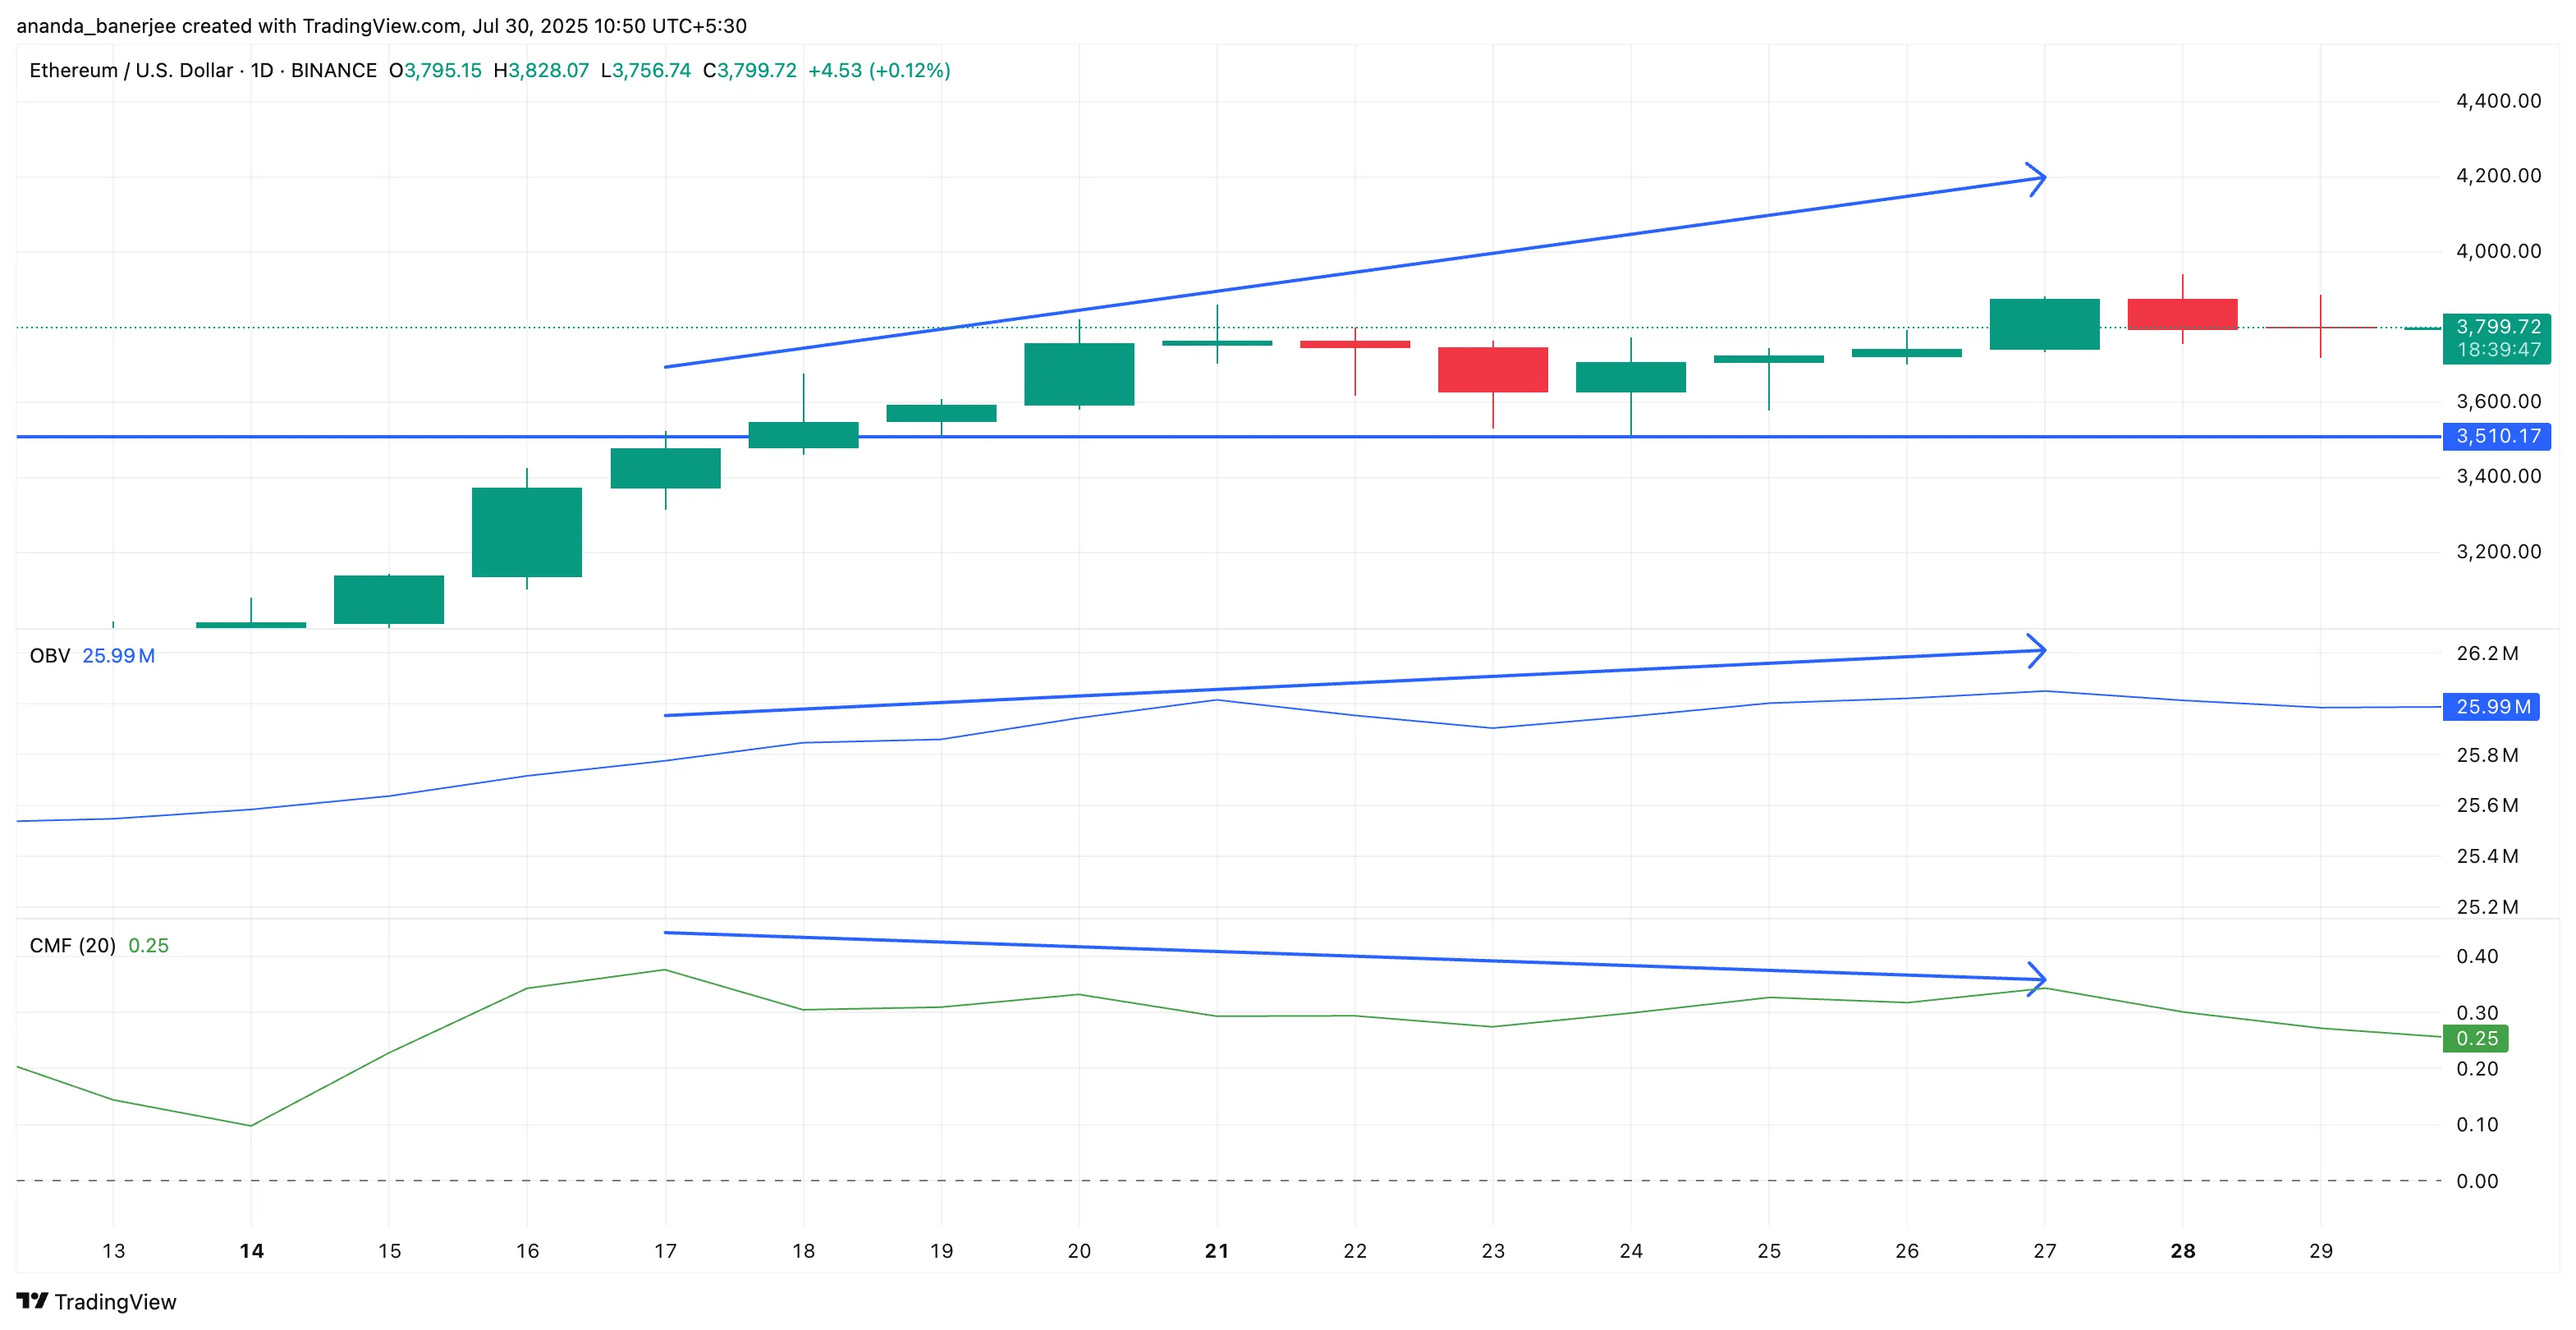
On the flip side, On-Balance Volume (OBV) has been pushing slightly higher, tracking the price’s uptrend. While OBV suggests steady participation, it might be misleading retail traders into thinking momentum is stronger than it is.
OBV measures cumulative volume to show whether real demand is backing a move.
The CMF’s bearish divergence hints that larger players are scaling back, leaving the market vulnerable to a swift reversal if sentiment shifts.
When both these indicators are viewed together, they paint a picture of a rally that’s losing real conviction under the hood. This imbalance is exactly how a bull trap forms; volume looks decent, but actual money flow is drying up.
Ethereum Price Action Shows a Fragile Wedge Structure
Ethereum’s price action adds the final piece of this puzzle. The asset has been climbing within an ascending (rising) wedge, a pattern often considered bearish as it signals slowing upward momentum.
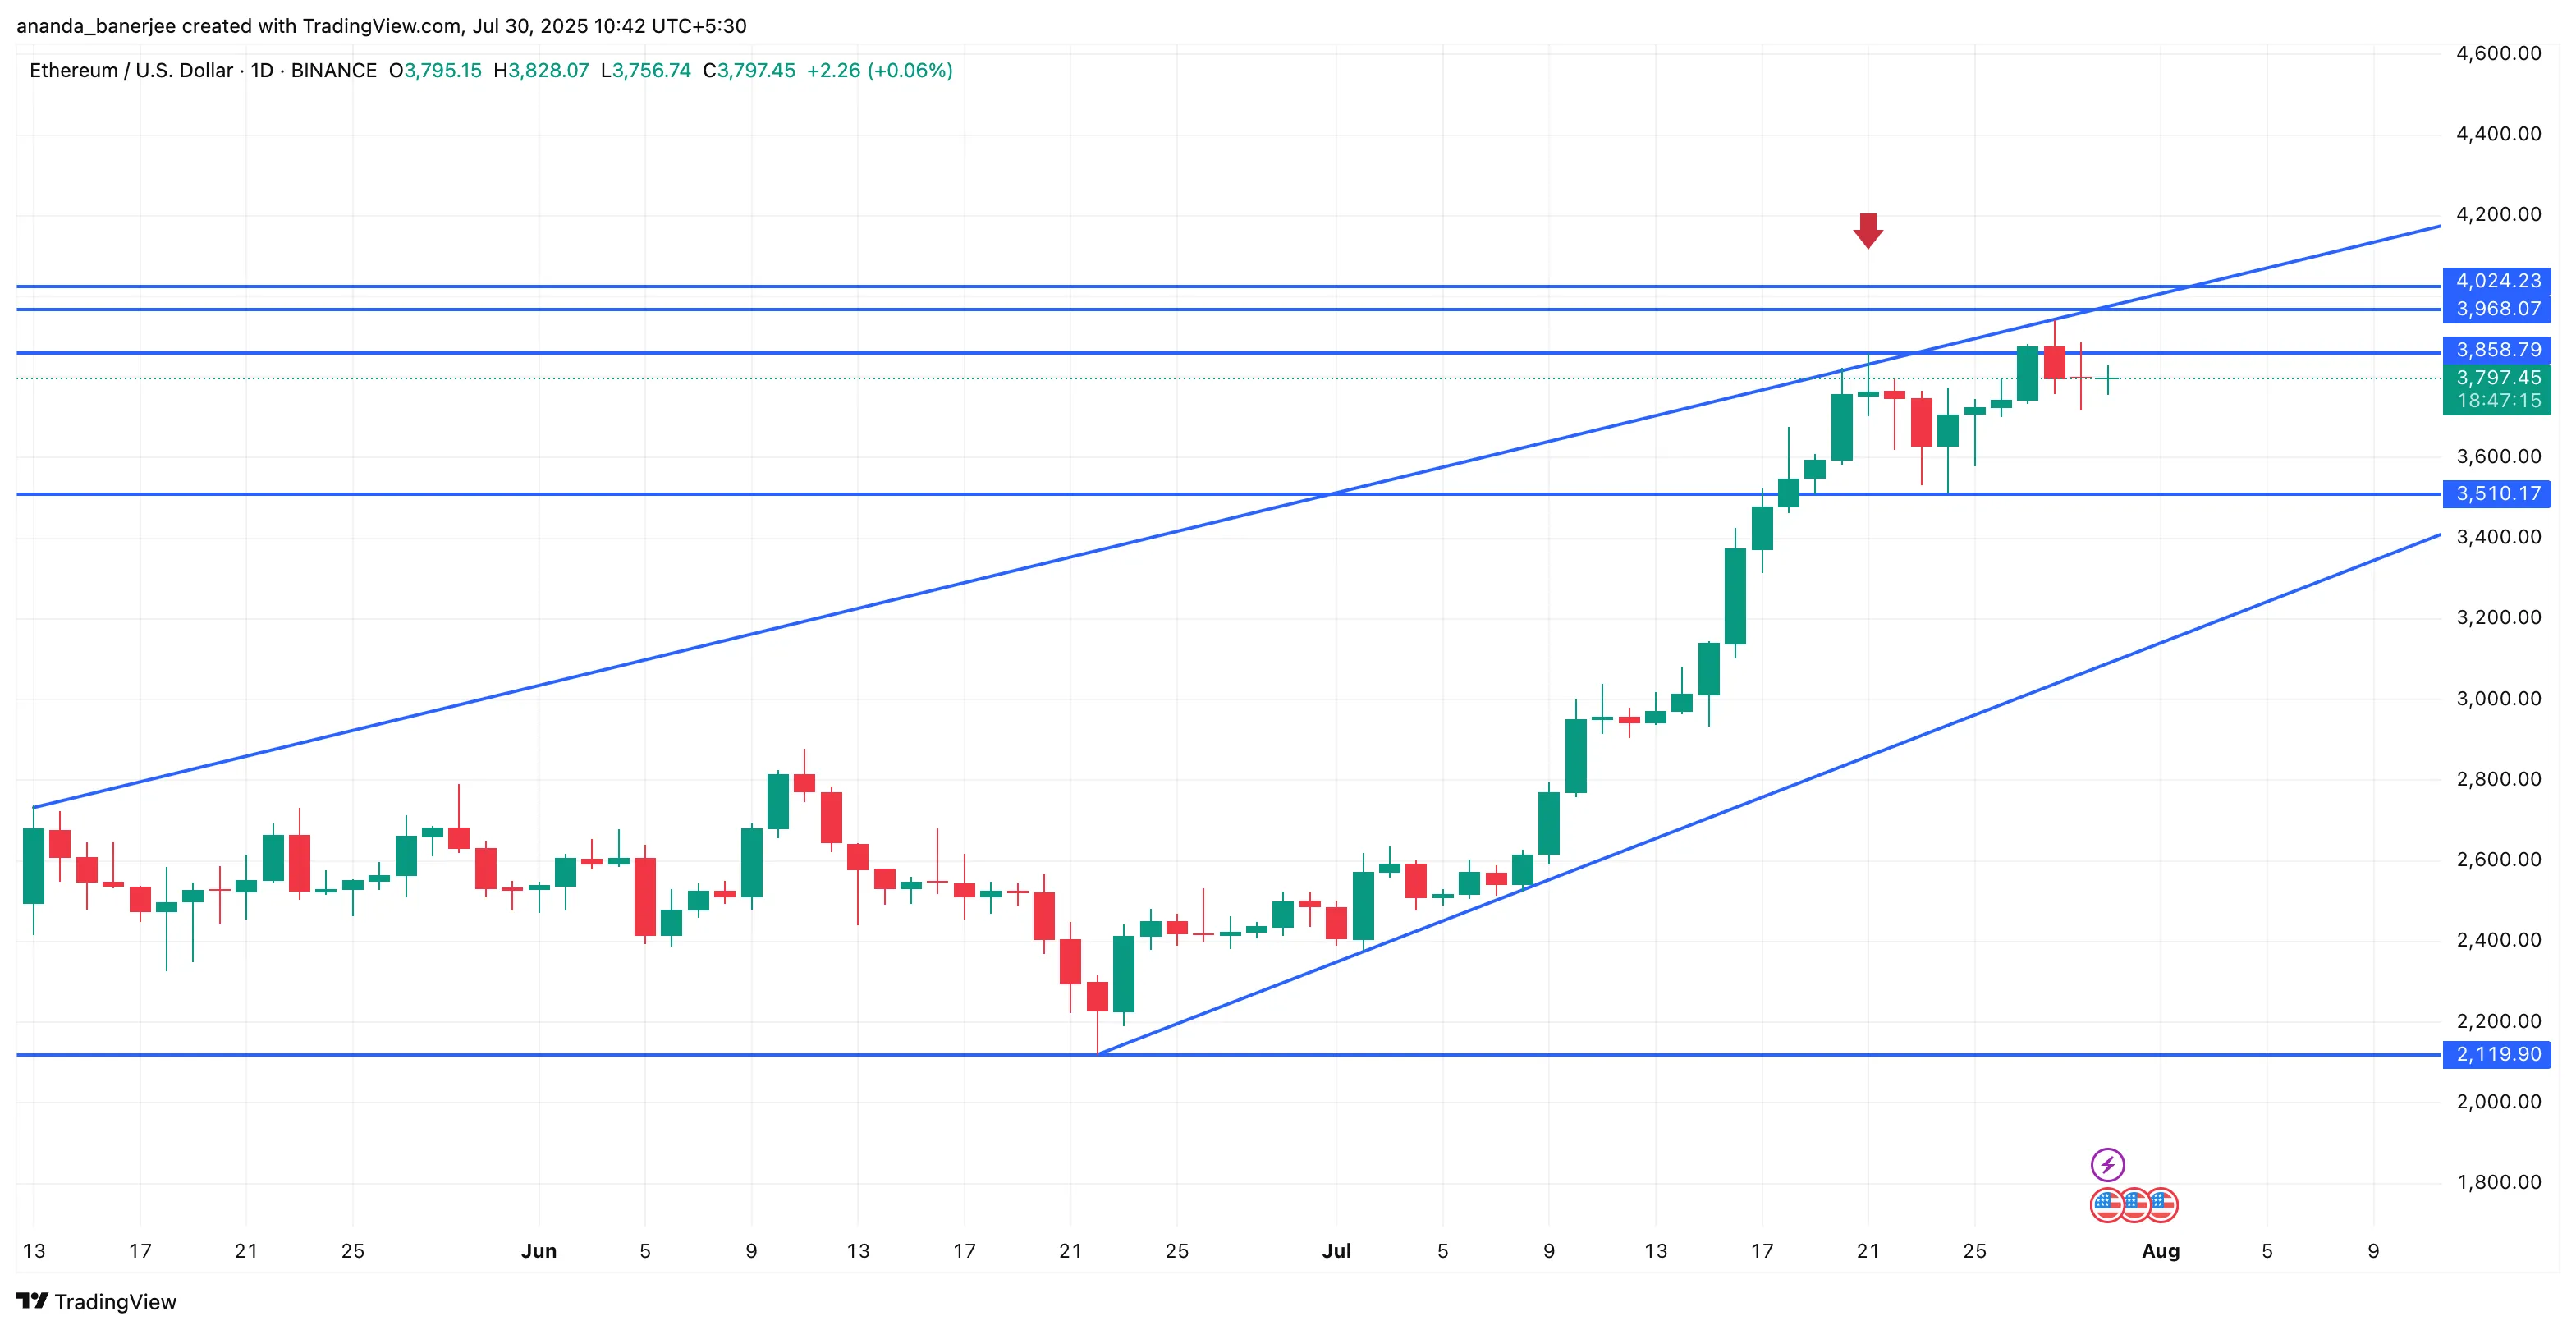
A few trading sessions back, the ETH price momentarily breached the wedge’s upper trendline (marked by the red arrow), hitting $3,858, luring in breakout buyers, only to correct back below $3,510 soon after.
Such fake breakouts are classic bull trap behavior, triggering fear of missing out before flipping direction. As long as Ethereum’s price stays inside this wedge, the risk of another false breakout remains high.
For the bearish structure to be invalidated, the Ethereum price must break and hold above $4,024, a key psychological and technical resistance level. Failing to do so could see ETH retest support at $3,510.
Disclaimer
In line with the Trust Project guidelines, this price analysis article is for informational purposes only and should not be considered financial or investment advice. BeInCrypto is committed to accurate, unbiased reporting, but market conditions are subject to change without notice. Always conduct your own research and consult with a professional before making any financial decisions. Please note that our Terms and Conditions, Privacy Policy, and Disclaimers have been updated.