

Bitcoin’s rally to a new all-time high today has sent ripples across the broader crypto market, lifting many altcoins.
Among the biggest beneficiaries is Ethereum (ETH), which has climbed over 3% in the past 24 hours, driven by renewed bullish sentiment and a surge in futures market activity.
Ethereum’s Futures Market Signals Recovery as Traders Favor Long Positions
Demand for ETH long positions has overtaken shorts for the first time in 11 days, marking a notable shift in trader positioning. According to Coinglass, ETH’s long/short ratio has risen above 1, indicating that more traders are now betting on upward price movement. At press time, this stands at 1.0048.
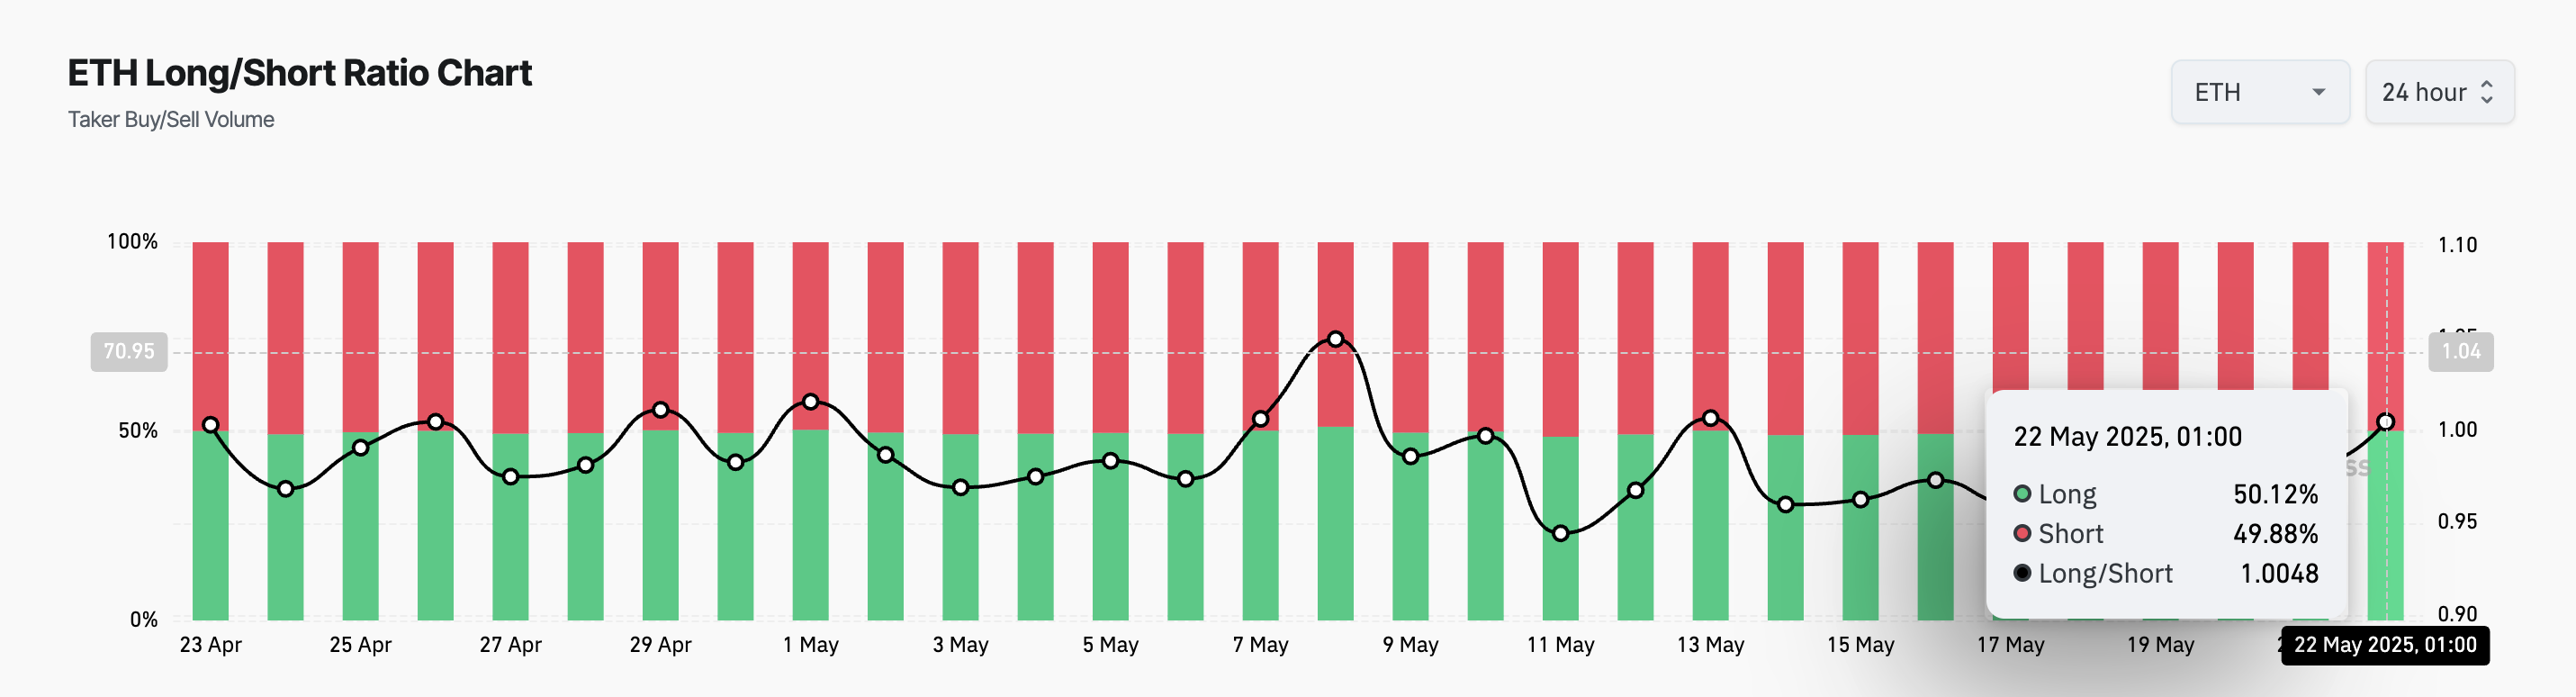
The long/short ratio measures the proportion of bullish (long) positions to bearish (short) positions in the market. When the ratio is below one, more traders are betting on a price decline than on a price increase.
Conversely, as with ETH, when the ratio is above one, there are more long positions than short ones. This suggests bullish sentiment, with most traders expecting the altcoin’s value to rise in the near term.
Furthermore, on the daily chart, ETH’s climbing on-balance volume confirms the resurgence in demand for the altcoin. As of this writing, this key momentum indicator stands at 25.60 million.
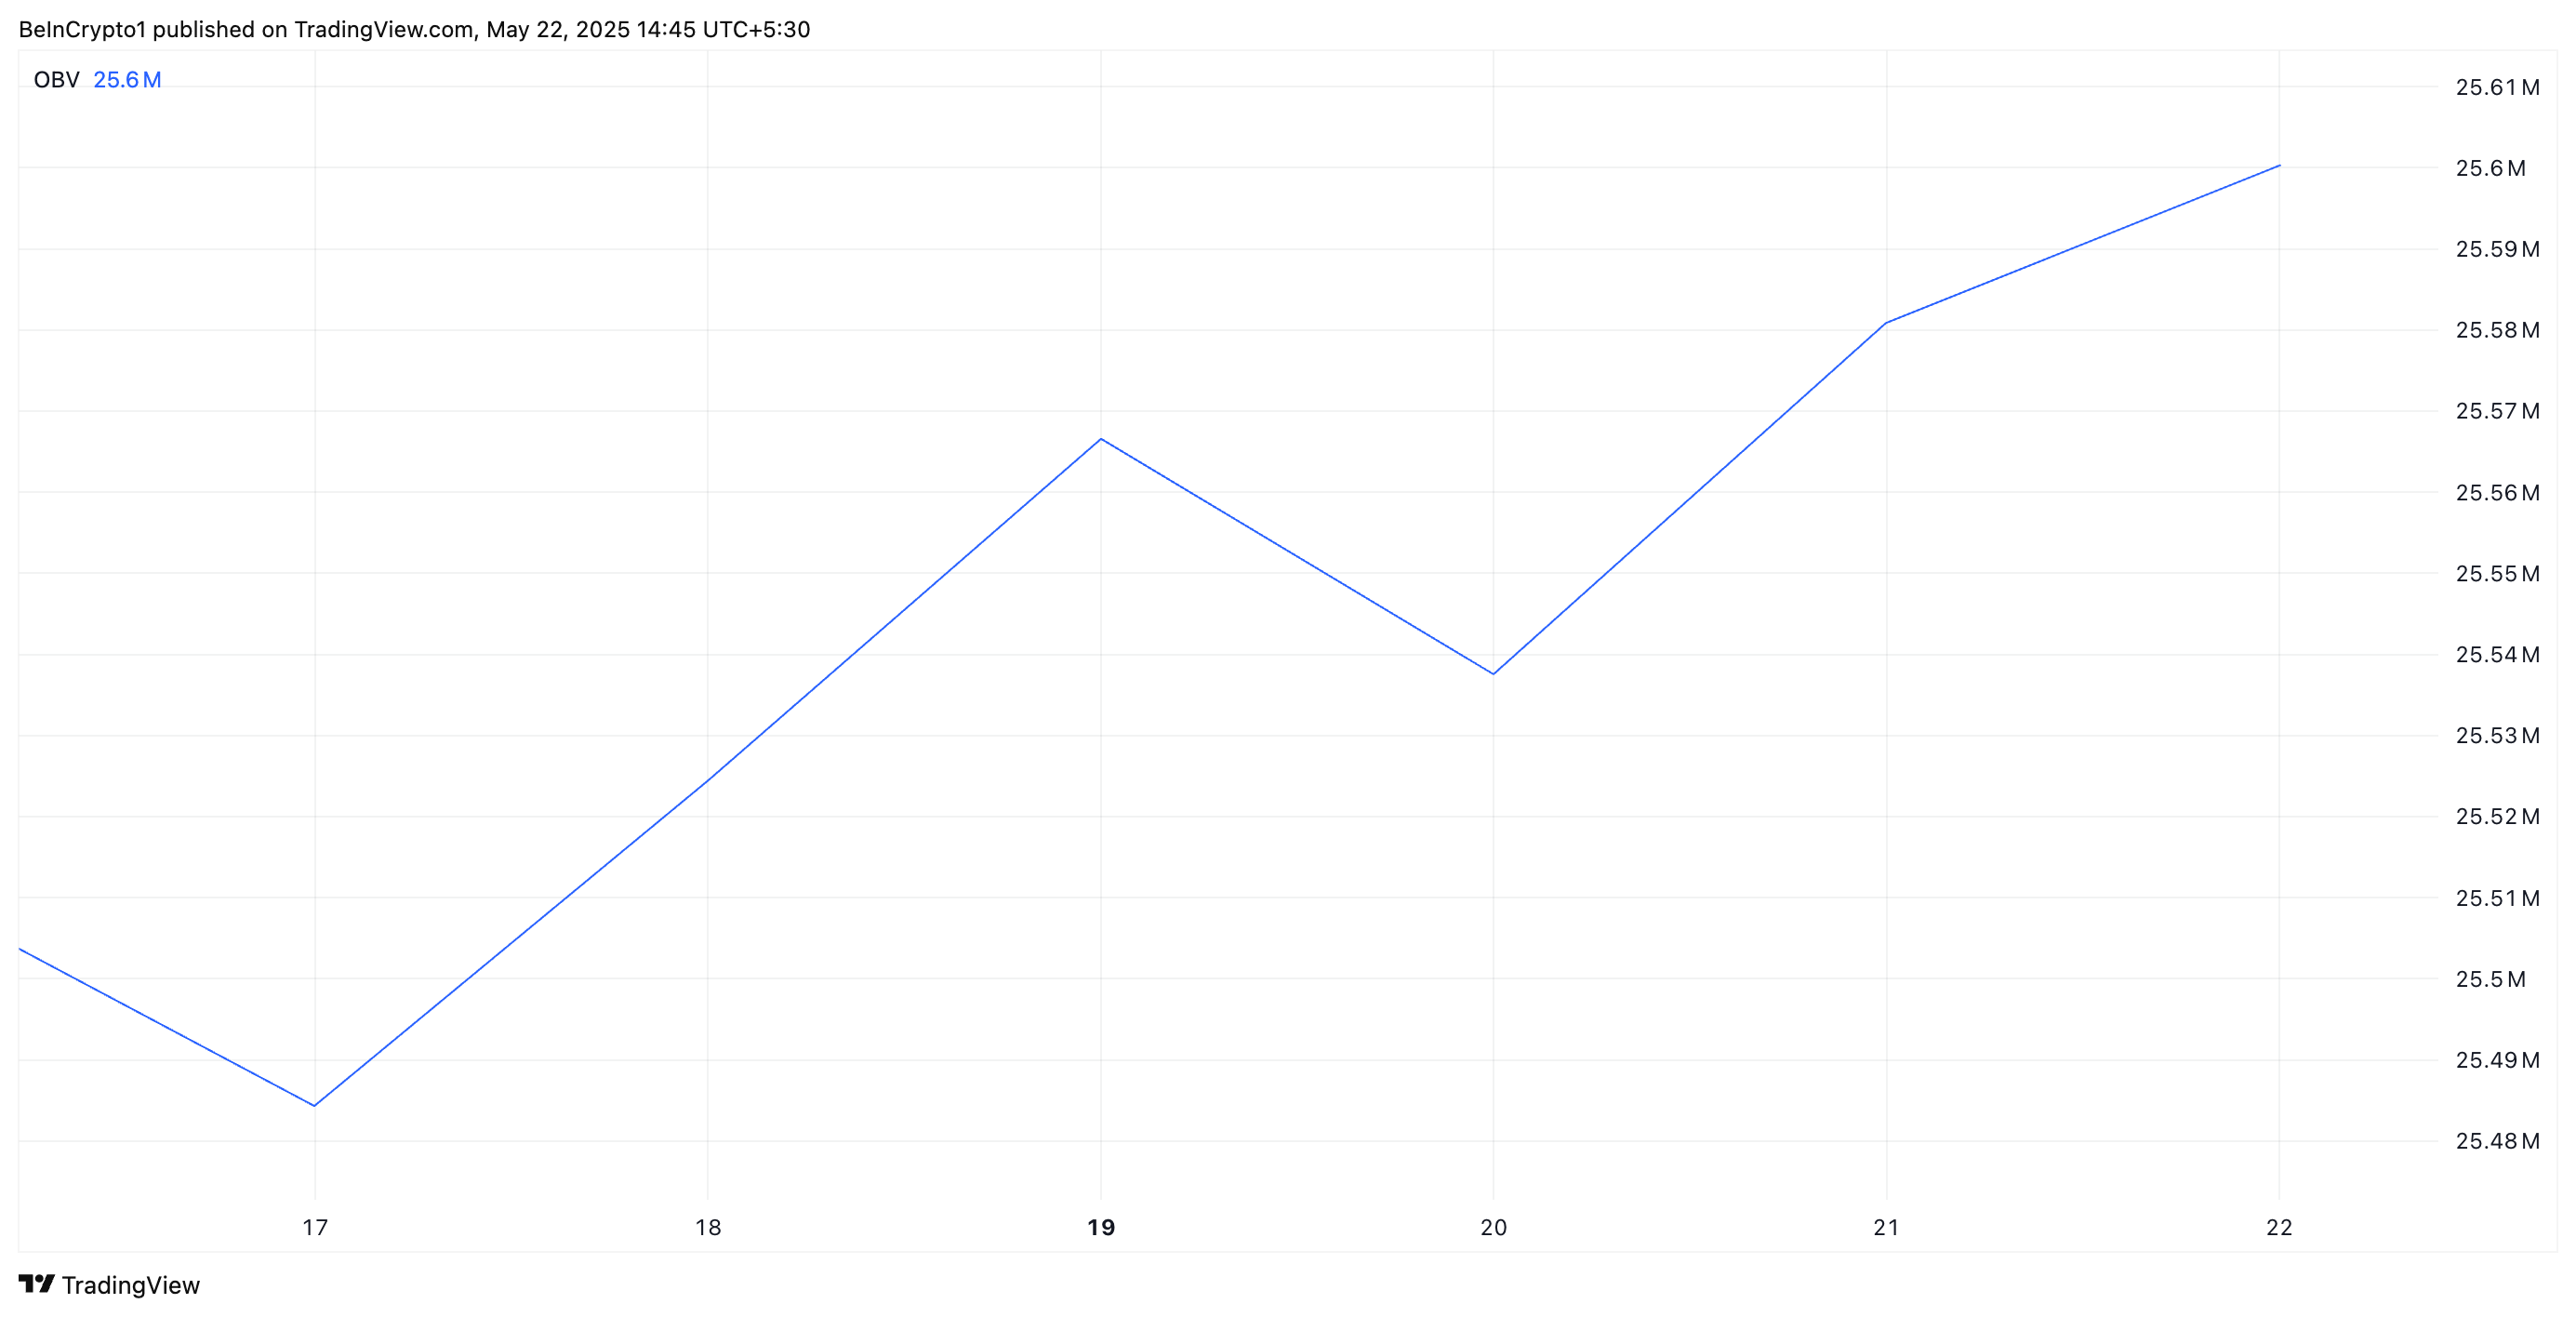
On-Balance Volume (OBV) is a technical indicator that measures cumulative buying and selling pressure by adding volume on up days and subtracting it on down days. When it climbs, it suggests a strong increase in trading volume aligned with price movement. This indicates rising conviction behind ETH’s building uptrend.
This bullish narrative is further reinforced by the growing anticipation surrounding Ethereum’s upcoming protocol upgrades and increased institutional involvement. In an interview with BeInCrypto, Lennix Lai, Global Chief Commercial Officer at OKX, noted that despite the US SEC’s delays on Ethereum staking ETF approvals, sentiment around the leading coin remains strong and could further drive its price higher.
“Even with the SEC’s delays on ETH staking ETFs, the Ethereum narrative is clearly gaining traction, potentially driven by anticipation around upcoming upgrades (e.g. Fusaka) and bullish news of TradFi institutions building Ethereum L2s to tokenize RWAs,” Lai noted.
Lai added that on the exchange:
“ETH now captures nearly 27% of spot volume versus Bitcoin’s 26.5%, completely flipping April’s dynamic when BTC dominated at 38% while Ethereum lagged below 20%. This signals a distinct rotation as traders reposition while Bitcoin consolidates near all-time highs, despite BTC recently hitting a fresh record of $110,730.”
He described this trend as “pretty interesting.”
Ethereum Stays Strong Above 20-Day EMA; Rally Toward $2,745 in Sight
As of this writing, ETH rests above its 20-day exponential moving average (EMA), confirming the bullish outlook above. This indicator measures an asset’s price over the past 20 trading days, giving more weight to recent prices.
When an asset trades above its 20-day EMA, it signals short-term bullish momentum and suggests buyers are in control. This confirms ETH’s upward price strength and provides a dynamic support level below it at $2,369.
If the rally strengthens, ETH could climb to $2,745.
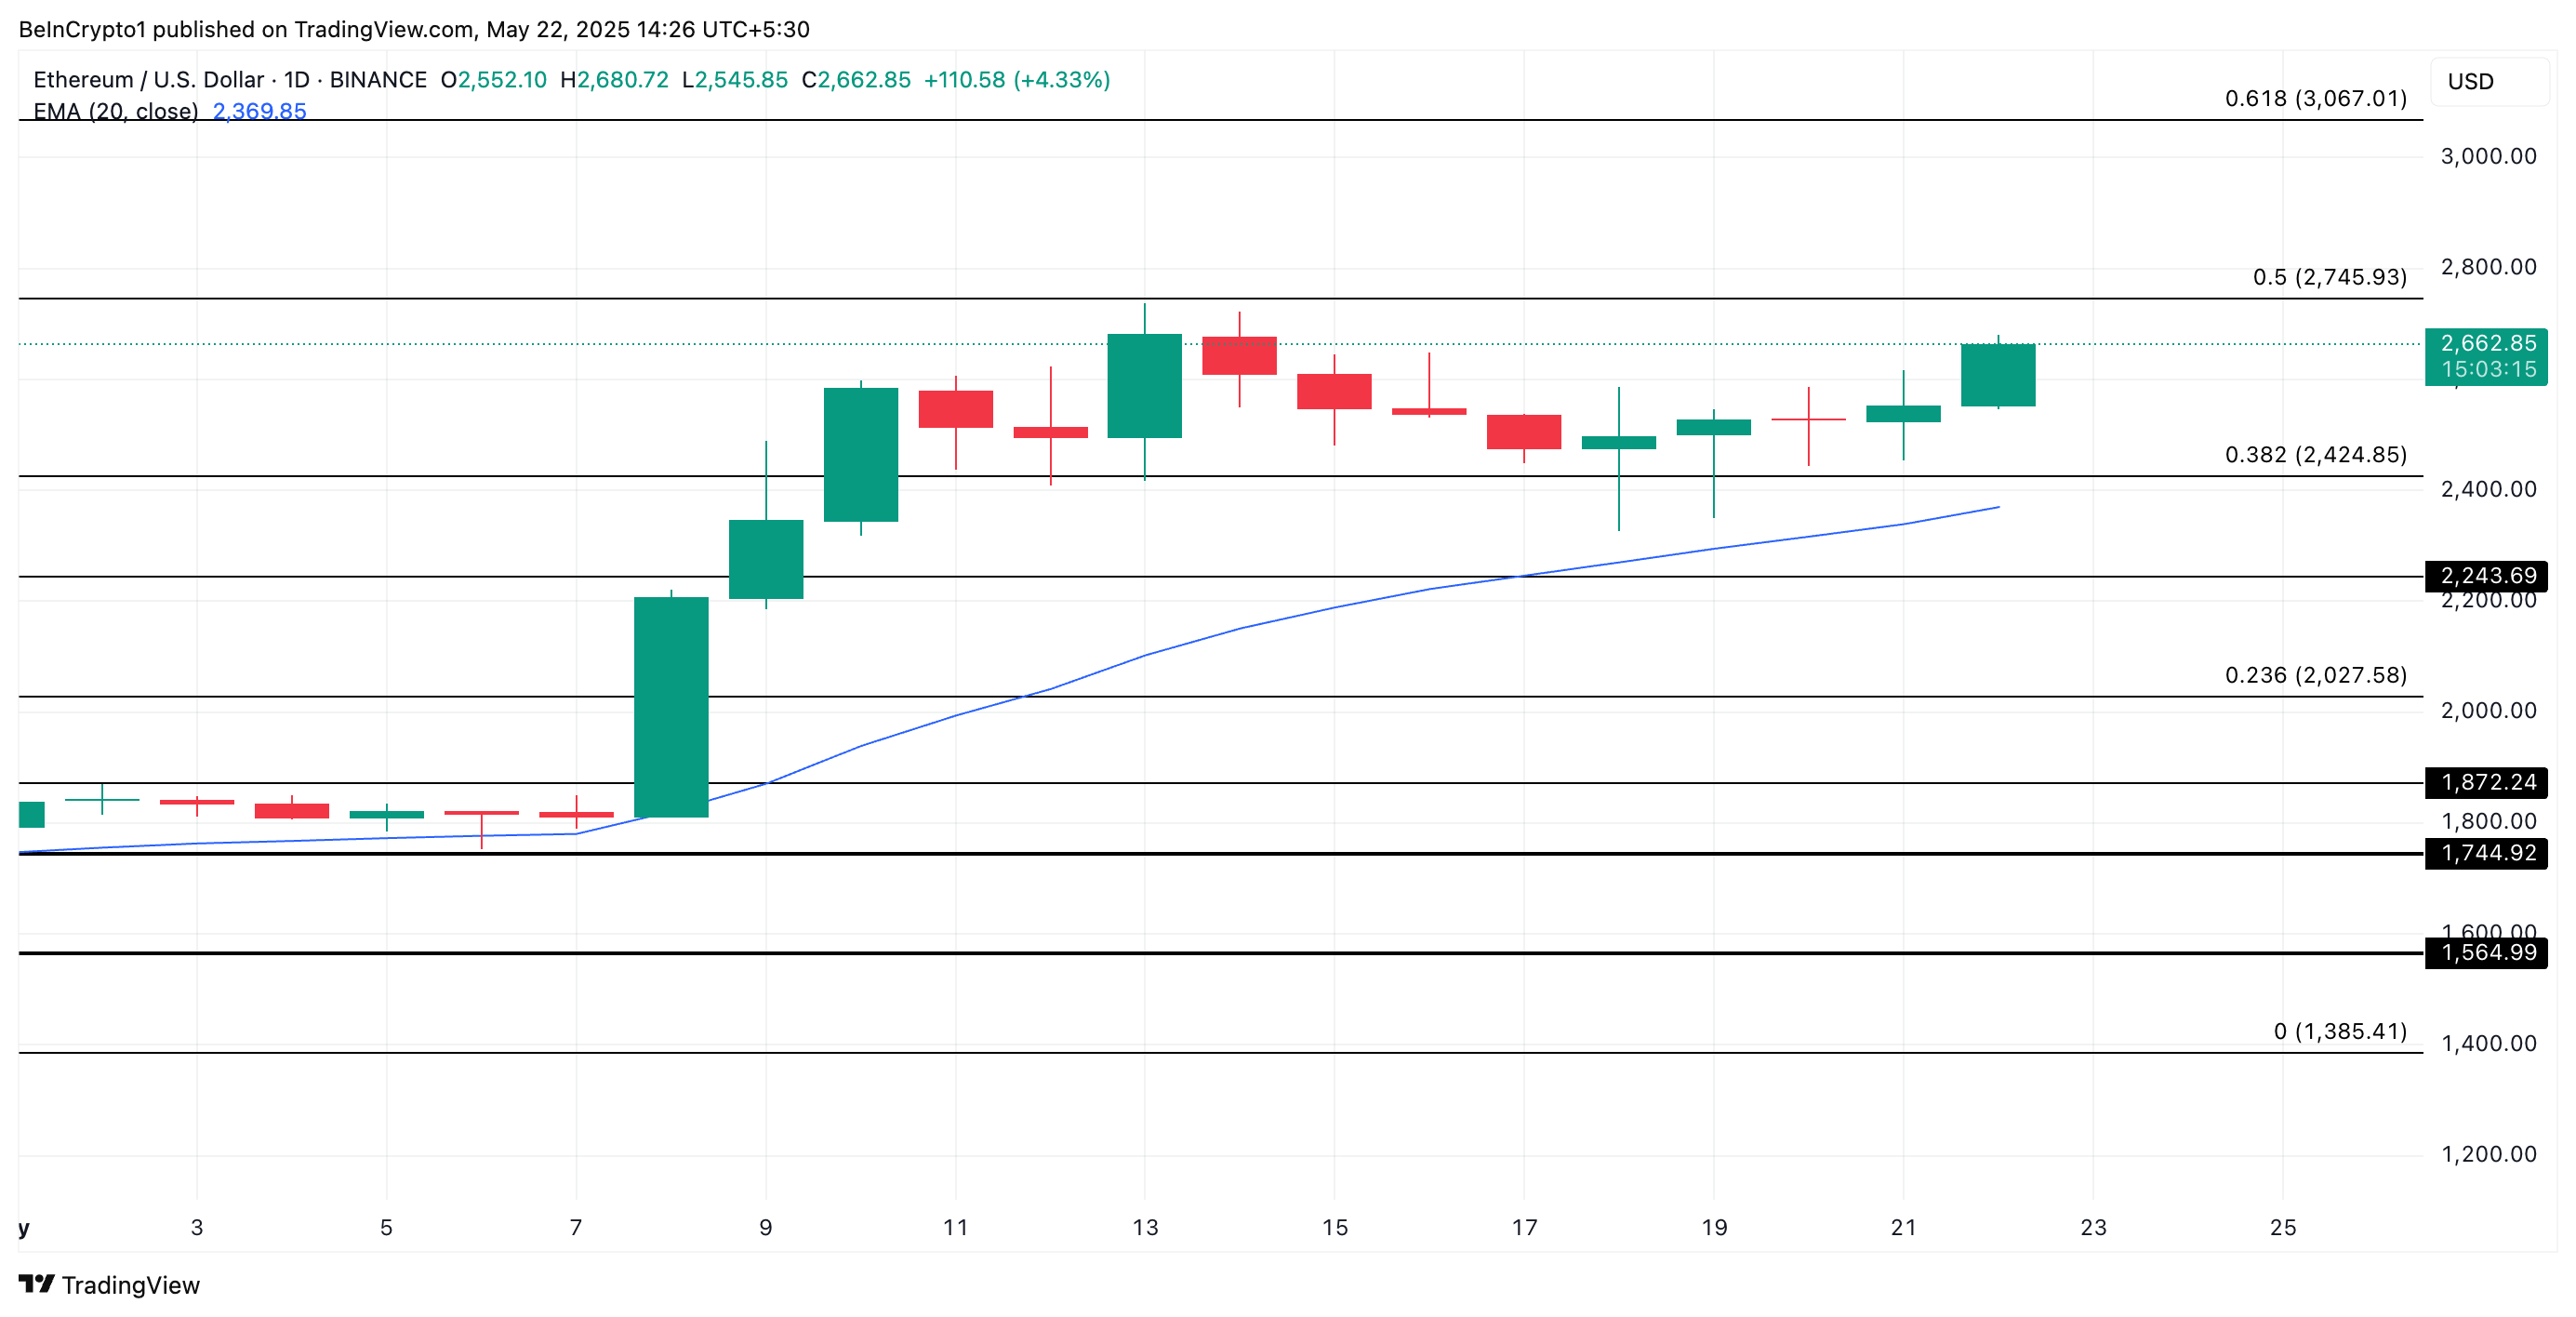
However, if sell-offs resume, this bullish outlook will be invalidated. In that scenario, ETH’s price could fall to $2,424.
Disclaimer
In line with the Trust Project guidelines, this price analysis article is for informational purposes only and should not be considered financial or investment advice. BeInCrypto is committed to accurate, unbiased reporting, but market conditions are subject to change without notice. Always conduct your own research and consult with a professional before making any financial decisions. Please note that our Terms and Conditions, Privacy Policy, and Disclaimers have been updated.