

Despite the broader market uptick this week, Hedera’s native token HBAR has bucked the trend, registering a 5% decline over the past seven days.
With bearish momentum building, the HBAR token now risks a return to its year-to-date low.
HBAR Slides Below Key Indicators
HBAR’s decline comes as many top cryptocurrencies post modest gains this week, reflecting its divergence from general market sentiment.
Readings from the HBAR/USD one-day chart suggest that this bearish trend could persist in the short term. For example, as of this writing, HBAR trades below the dots that make up its Parabolic SAR (Stop and Reverse) indicator.
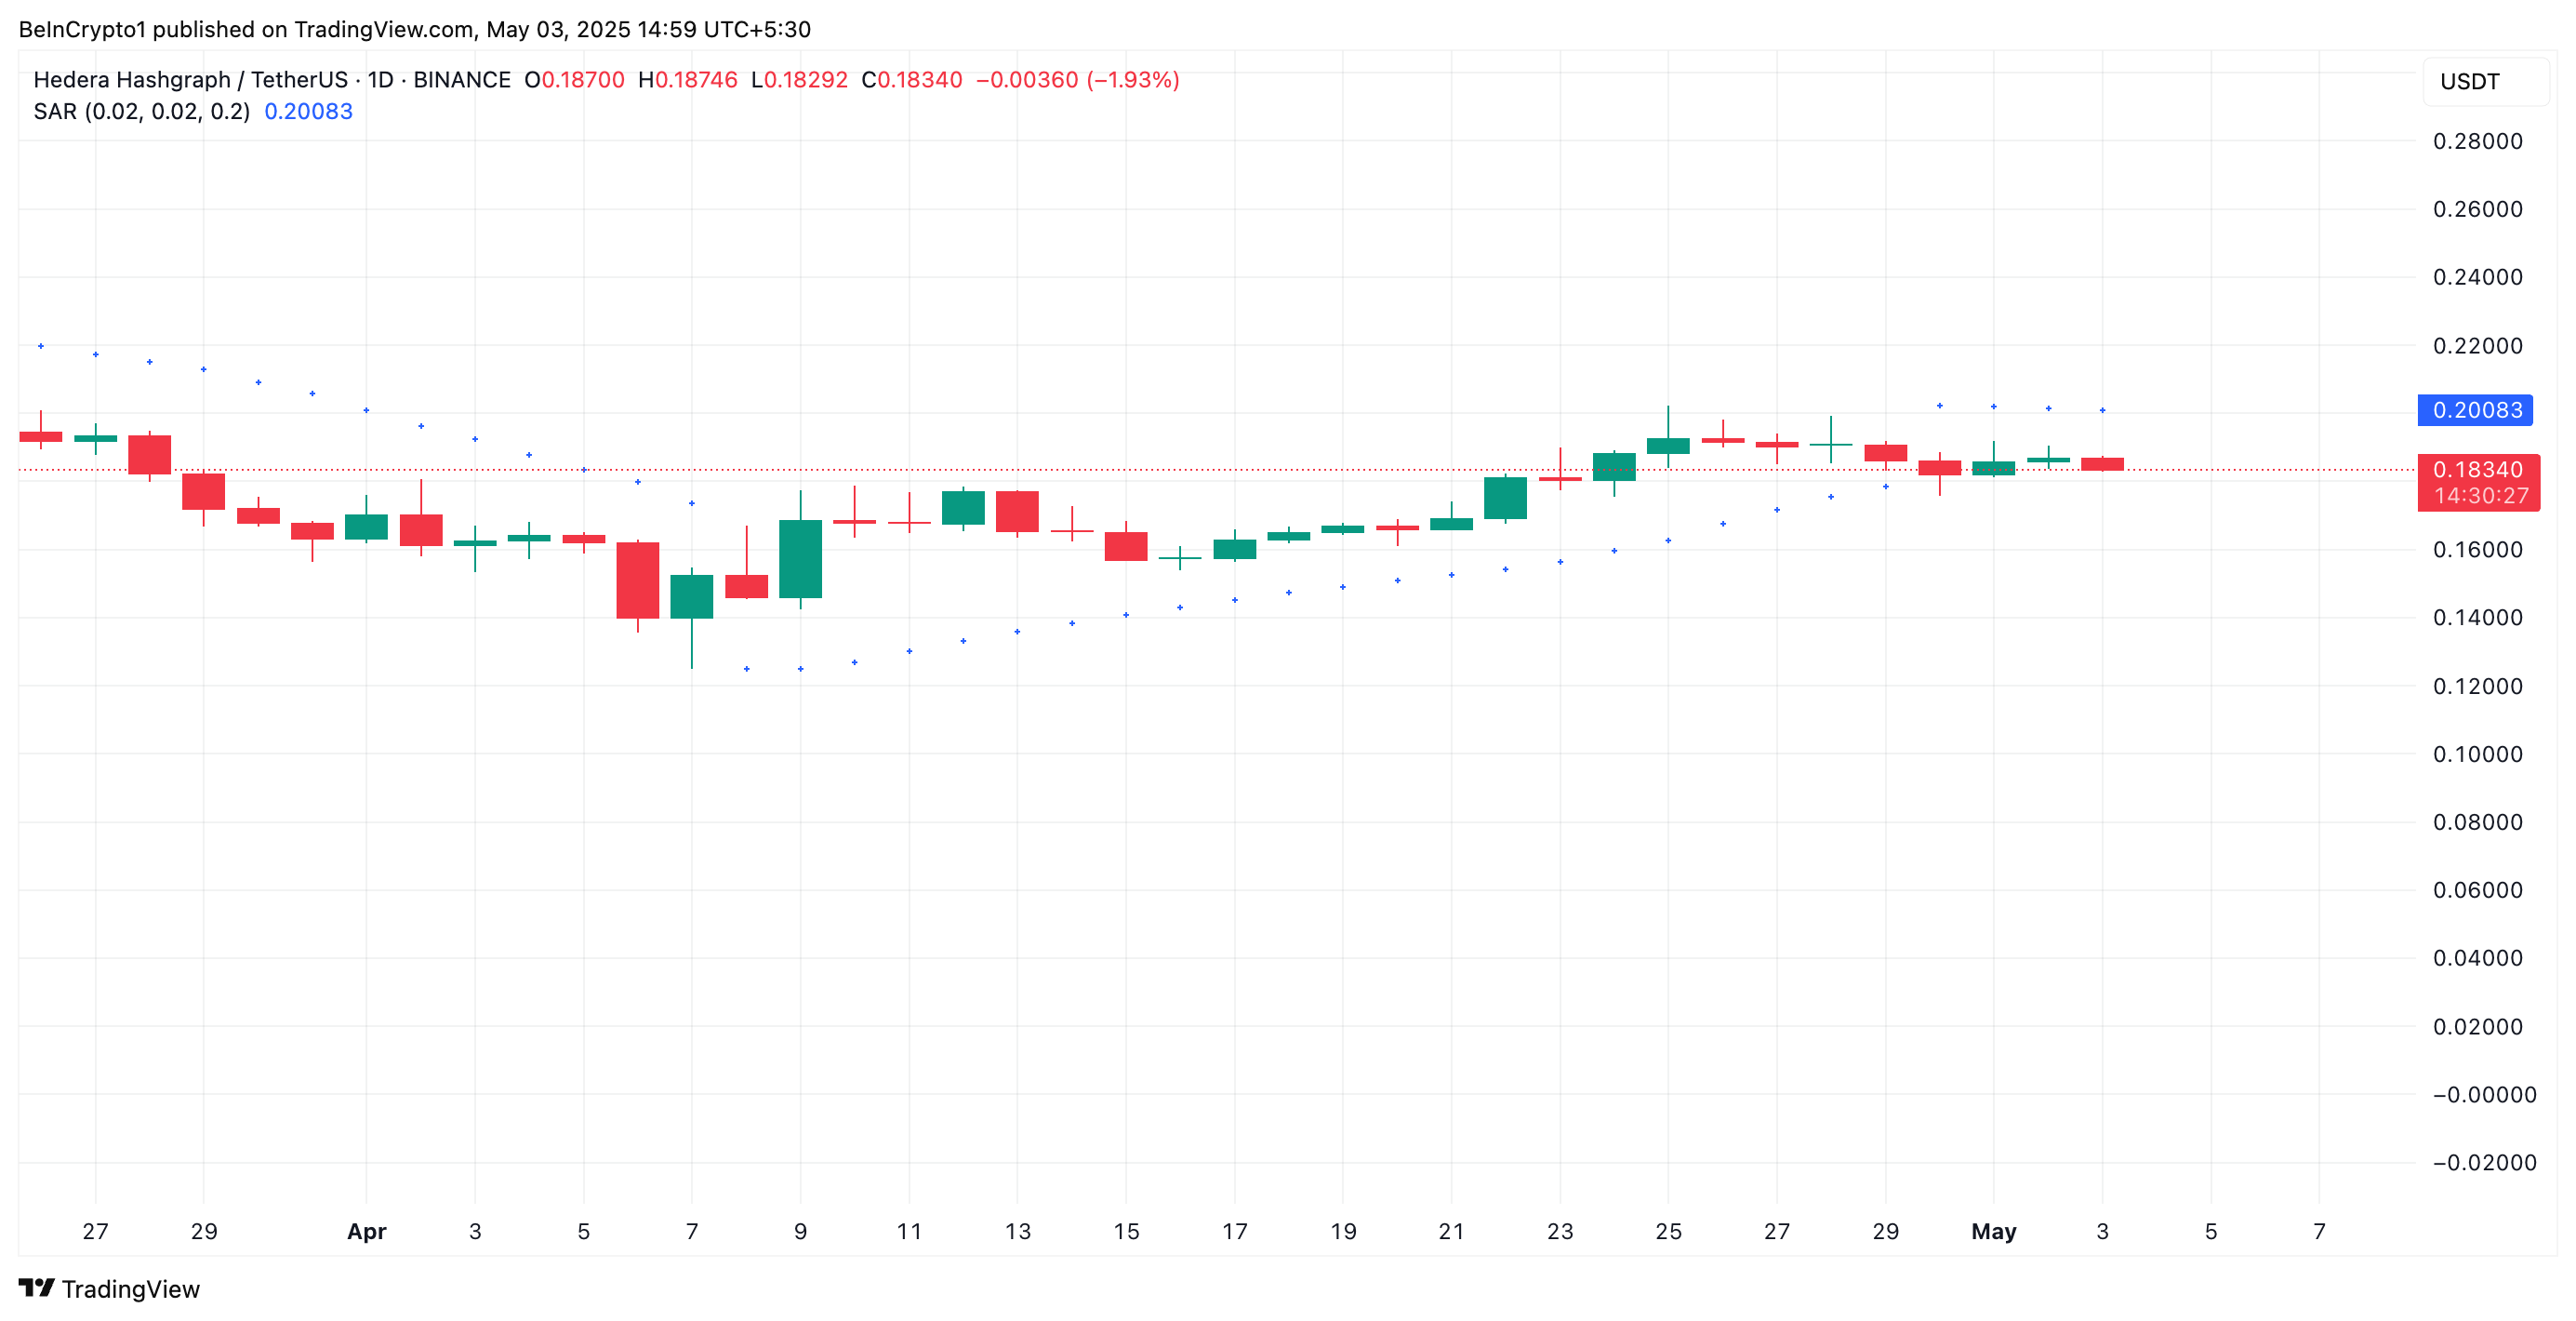
This indicator measures an asset’s price trends and identifies potential entry and exit points. When an asset’s price trades below the SAR, it indicates a downtrend. It suggests the market is in a bearish phase, with the potential for further price dips.
Supporting this bearish outlook, HBAR’s Chaikin Money Flow (CMF) remains in the negative territory, signaling a decline in buying volume and a growing presence of sellers in the market. It currently stands at -0.07.
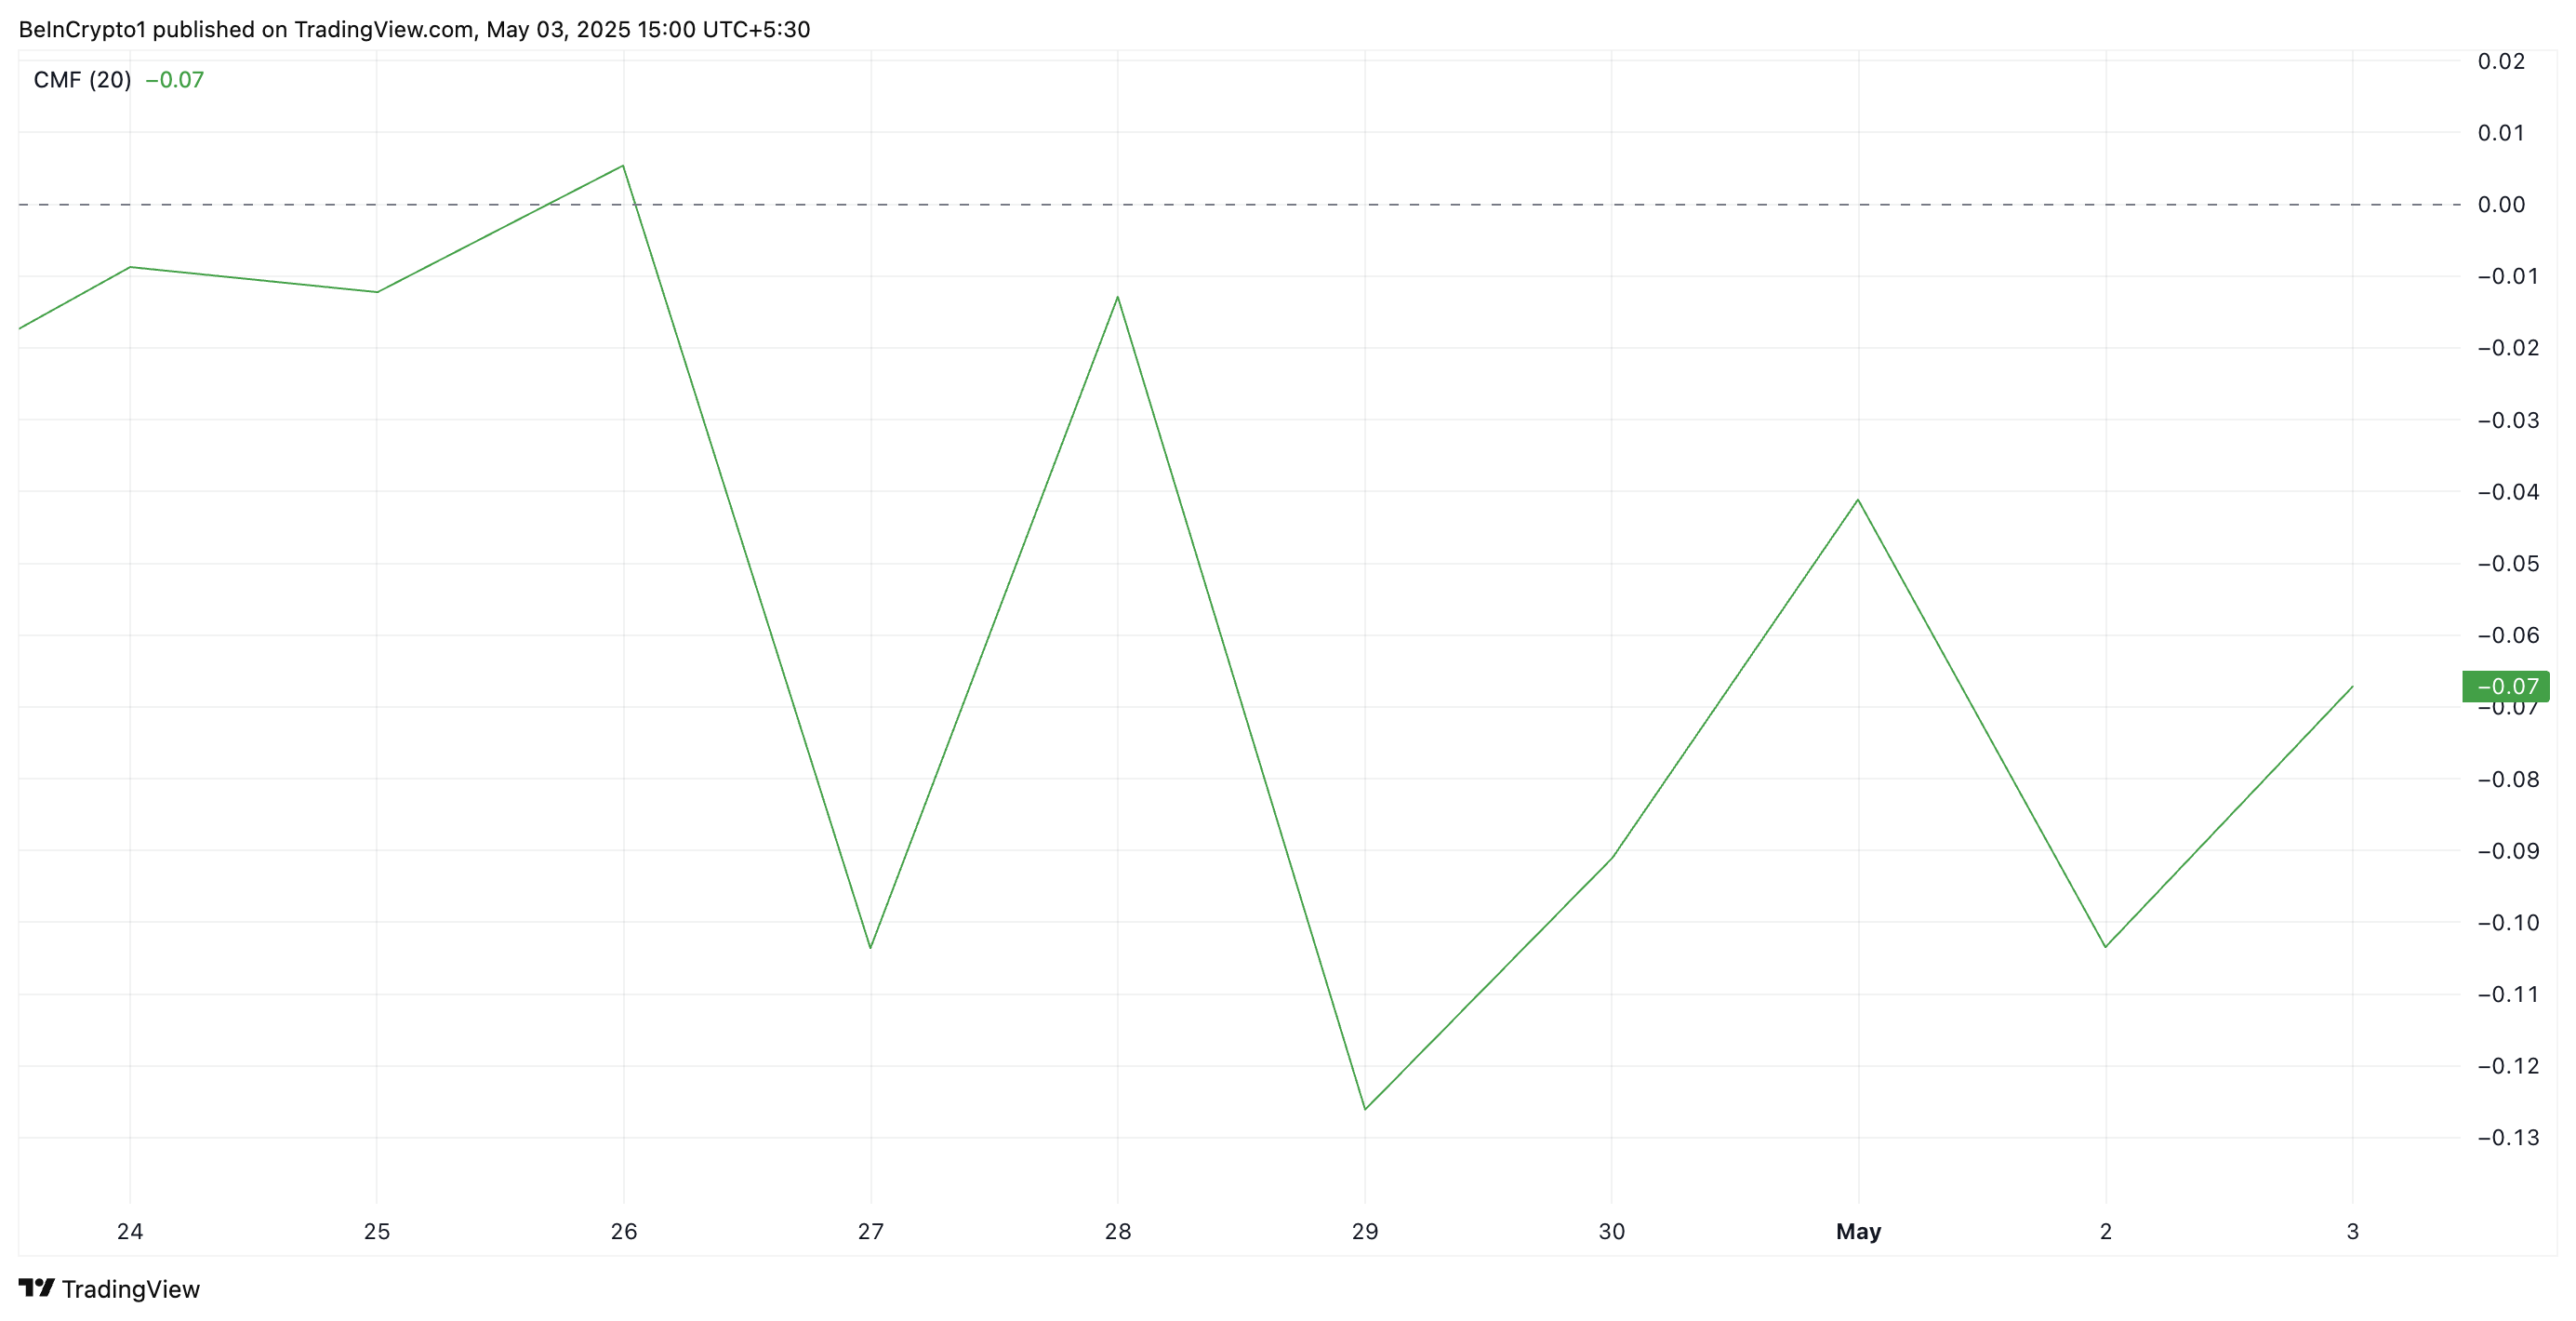
This key momentum indicator measures money flows into and out of an asset. A negative CMF reading, like HBAR’s, signals that selling pressure dominates the market. This means that more investors are offloading the token than accumulating it, a pattern associated with a weakening price trend.
HBAR Tests 20-Day EMA: Will It Hold or Break Toward $0.12?
The daily chart shows HBAR’s decline has pushed it near the 20-day exponential moving average (EMA). This key moving average measures an asset’s average price over the past 20 trading days, giving weight to recent changes.
When the price falls near the 20-day EMA, it signals a potential support level being tested. However, if the price breaks decisively below the EMA, it may confirm sustained bearish momentum and further downside risk.
Therefore, HBAR’s break below the 20-day EMA could lower its price to its year-to-date low of $0.12.
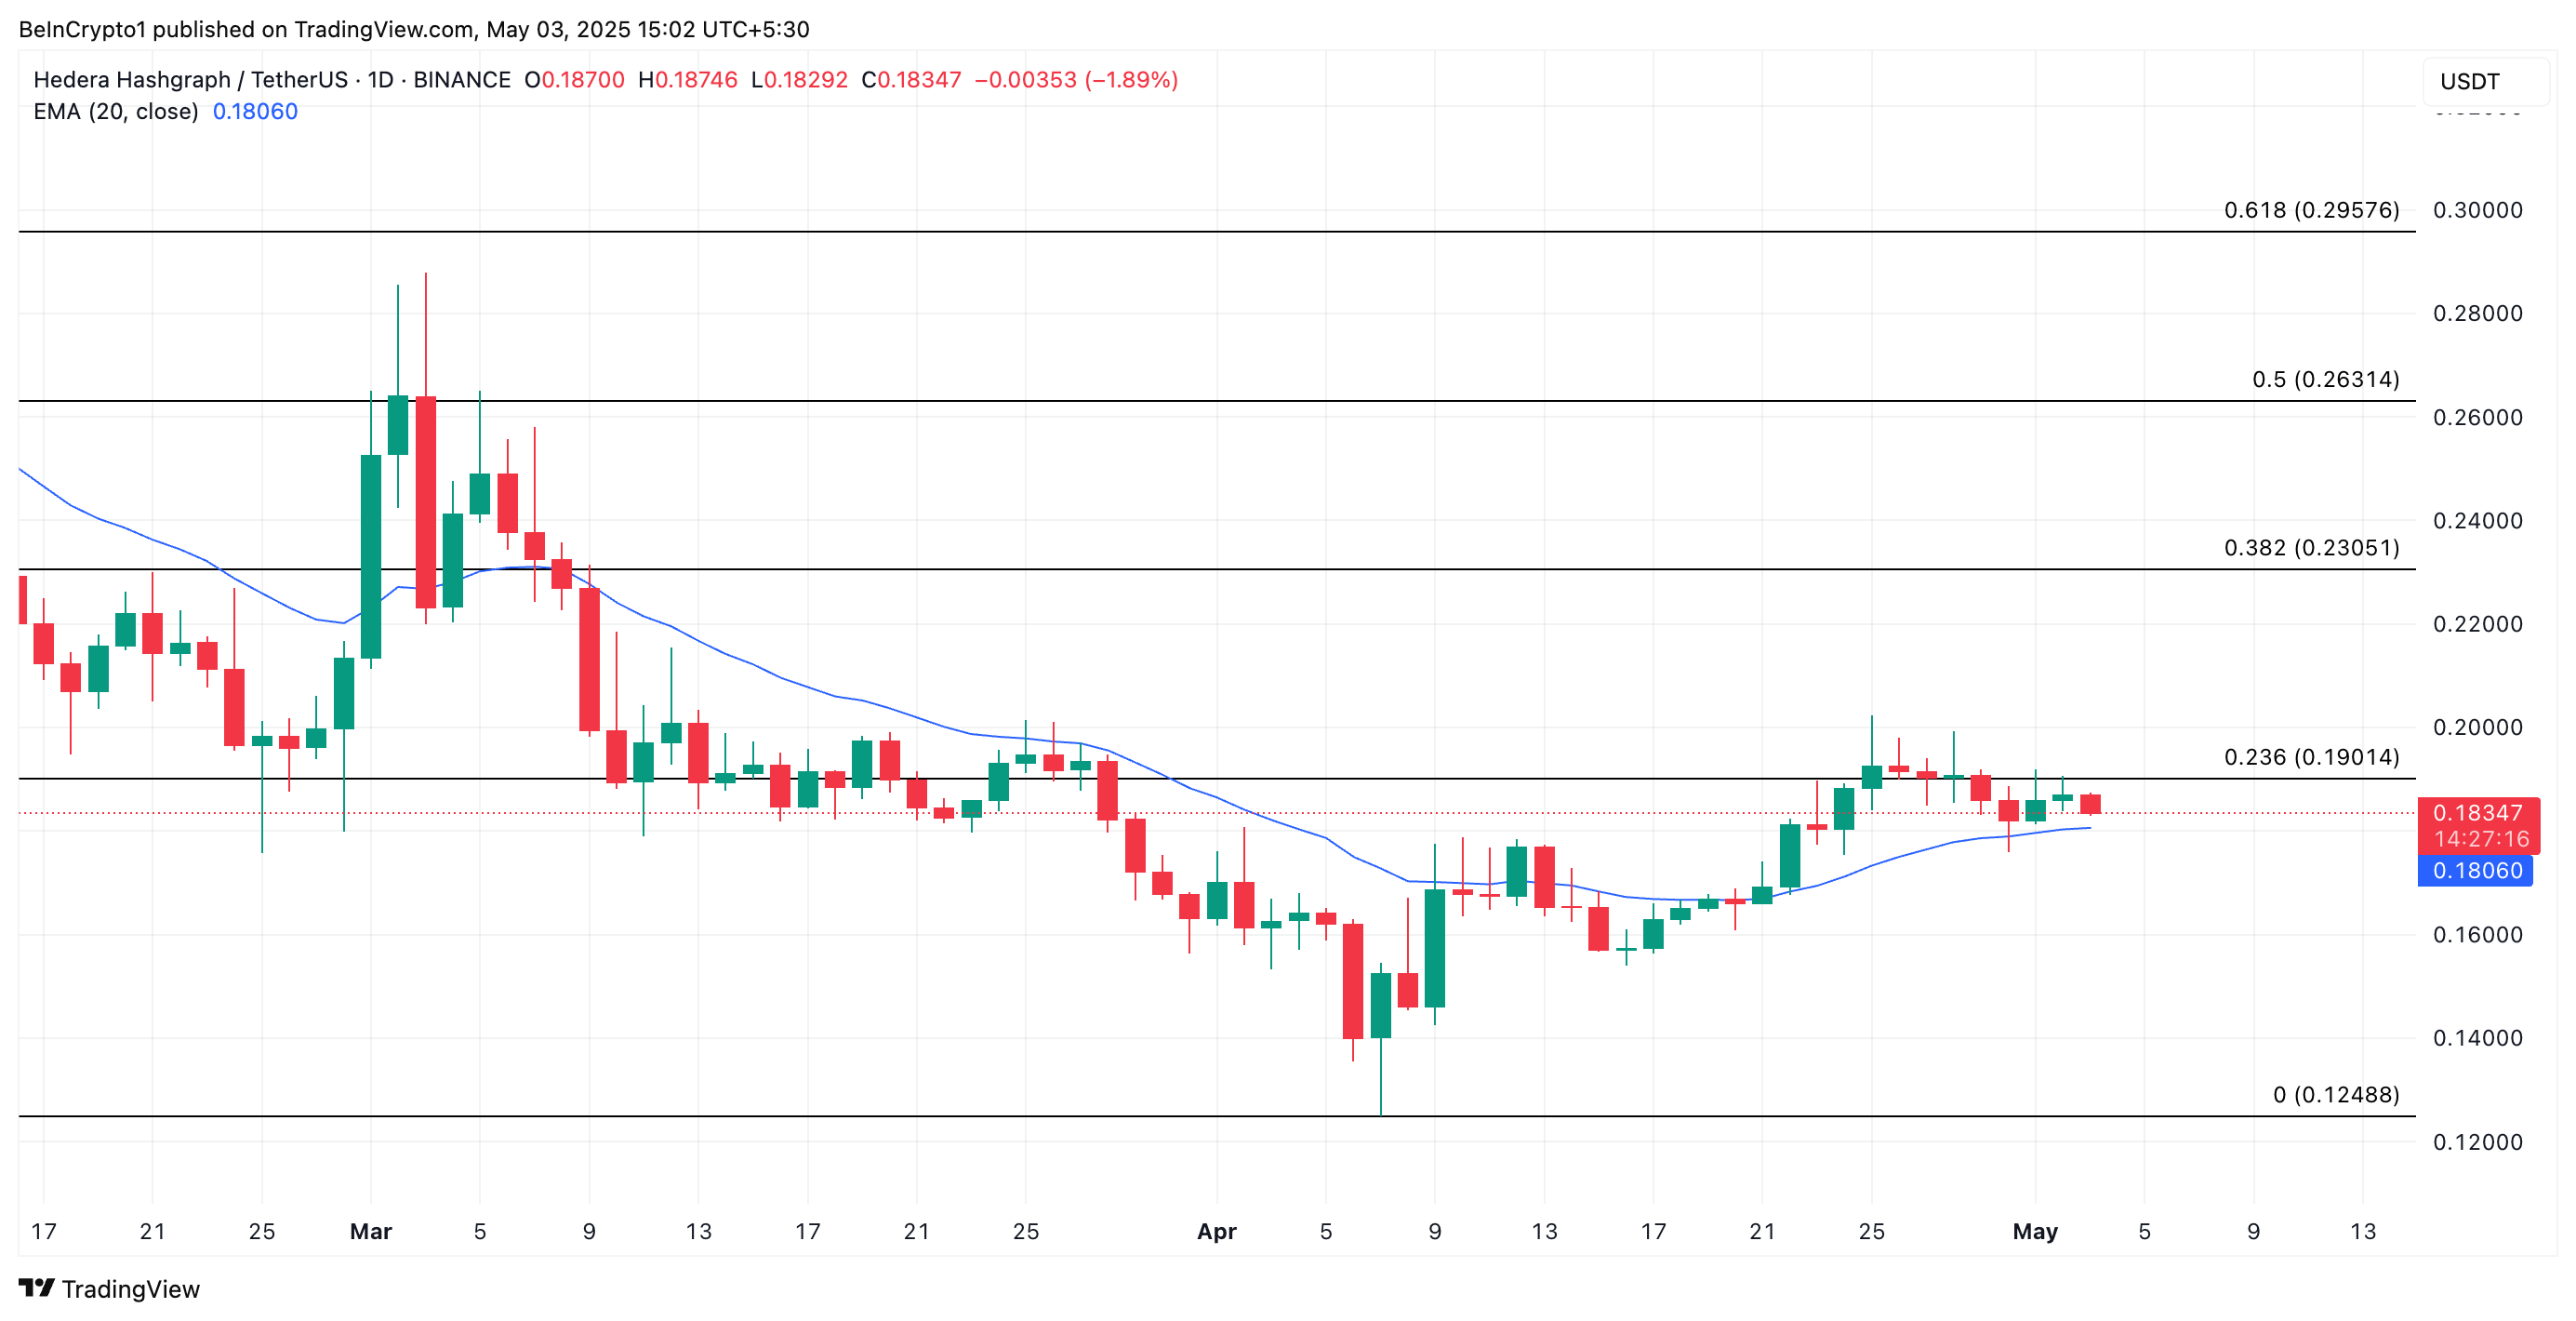
However, if demand rockets and HBAR bounces off its 20-day EMA, its price could rally above $0.19.
Disclaimer
In line with the Trust Project guidelines, this price analysis article is for informational purposes only and should not be considered financial or investment advice. BeInCrypto is committed to accurate, unbiased reporting, but market conditions are subject to change without notice. Always conduct your own research and consult with a professional before making any financial decisions. Please note that our Terms and Conditions, Privacy Policy, and Disclaimers have been updated.