Will the EOS price reclaim this support area? If so, will it break out afterward? Continue reading below if you are interested in finding out.$EOS
— DonAlt (@CryptoDonAlt) January 3, 2020
Whenever I see something like this I expect shorts to get squeezed.
Ample opportunities to dump, never happened.
If price makes it back into the ascending triangle it's likely to break out upwards with force in my opinion. pic.twitter.com/bp2lDENYZ1
Long-Term EOS Bottom
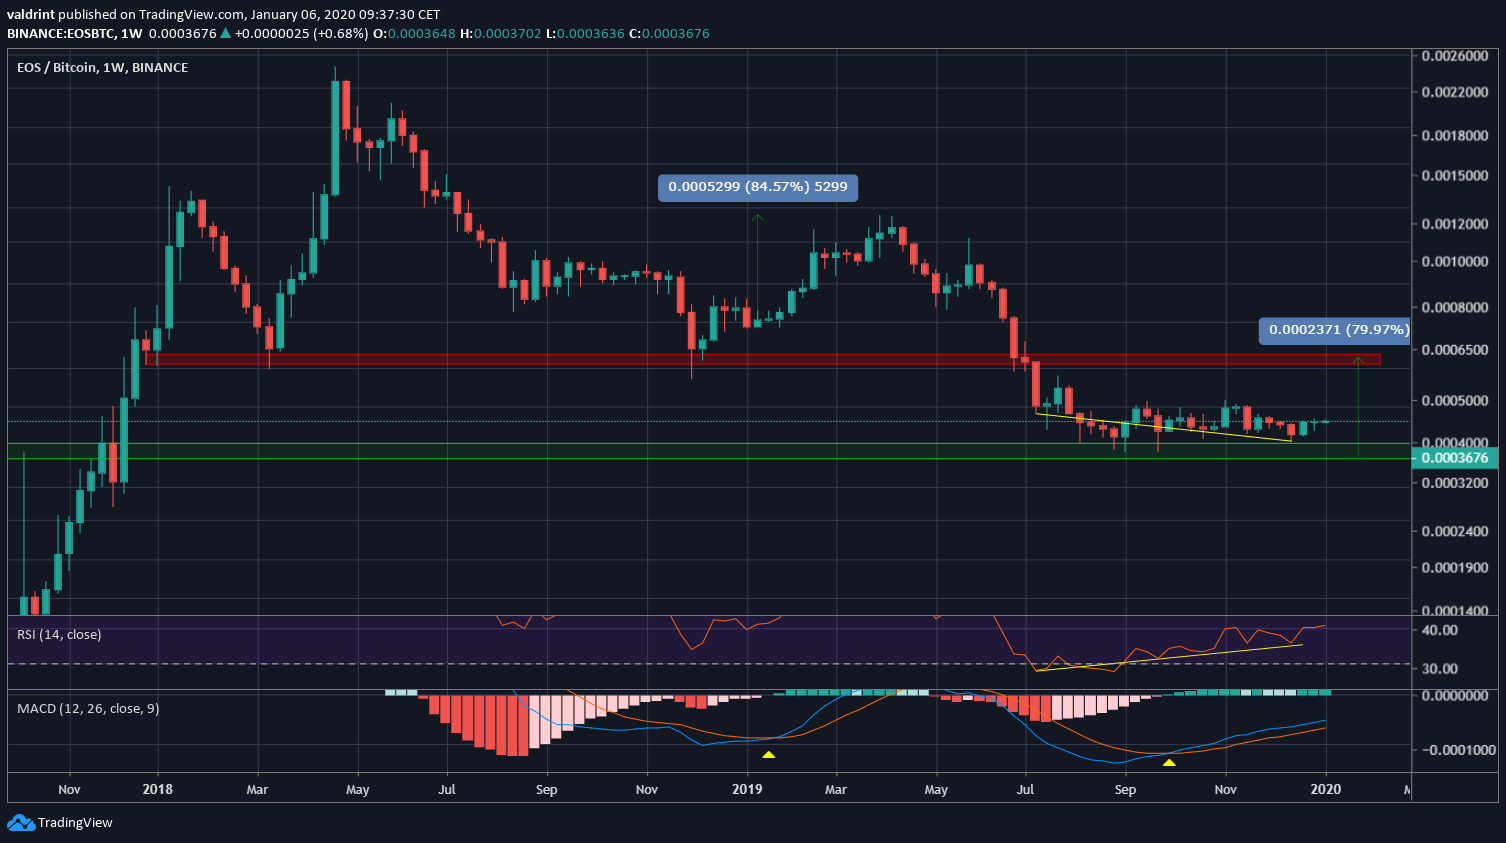
The EOS price has been decreasing since April 2019. In June, it broke down below the 5400 satoshi area, which had been offering support since 2018. It reached the 3000 satoshi support in August and has been trading close to that level since. The breakdown caused the weekly RSI to reach oversold levels, something it has not done previously. Additionally, both the RSI & the MACD have generated strong bullish divergence. On top of this, the MACD made a bullish cross. The only time this has occurred previously was in January 2019 and an upward move of 85 percent followed afterward. A movement with a similar magnitude would cause the EOS price to reach the 5400 satoshi area, which will likely act as resistance this time around. However, besides the MACD cross, the current price movement and that in January 2019 share no other similarities.
Support Breakdown
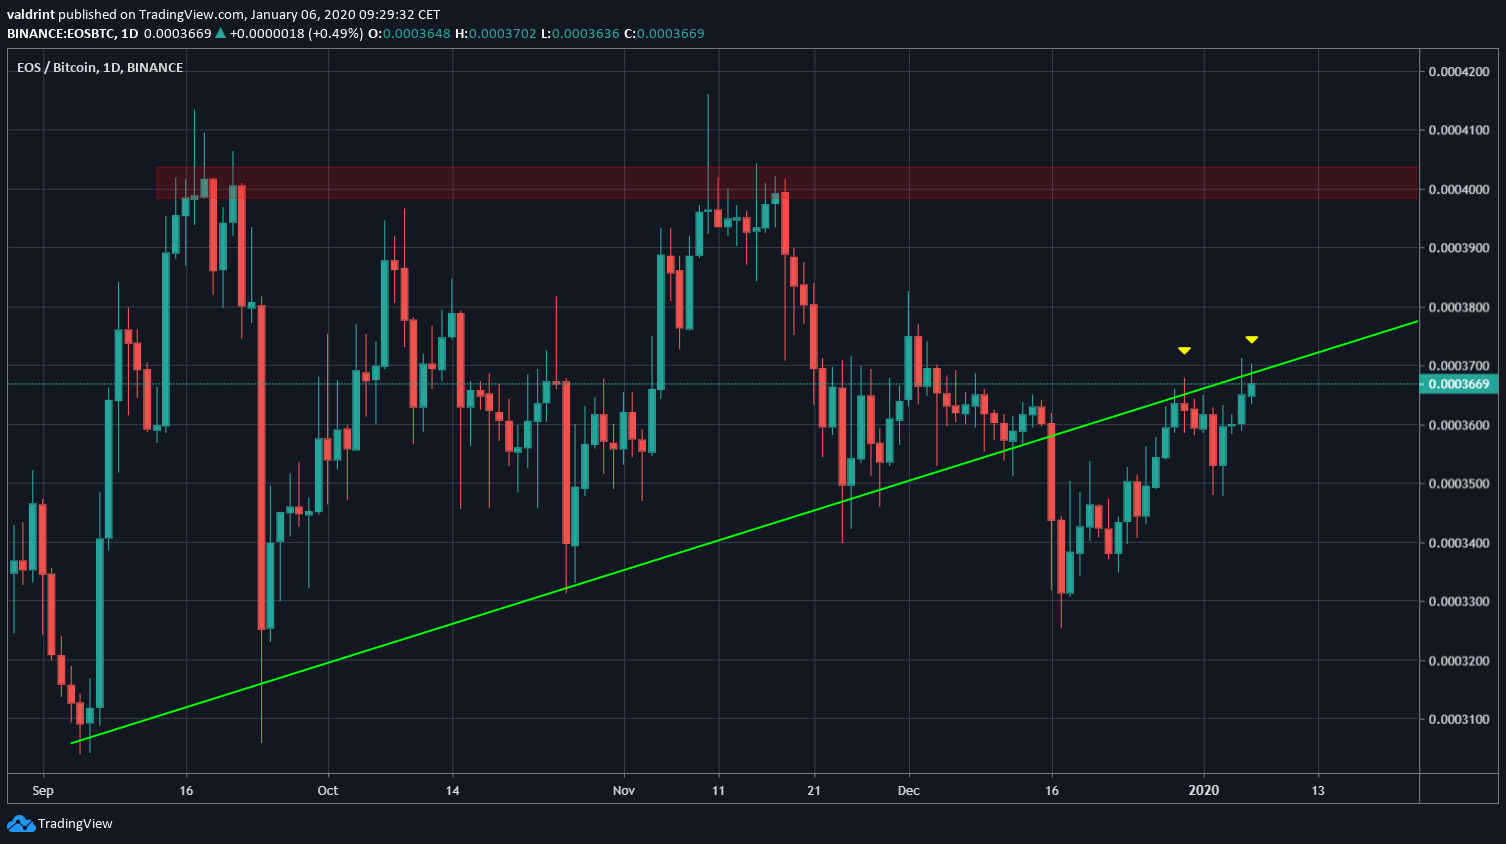
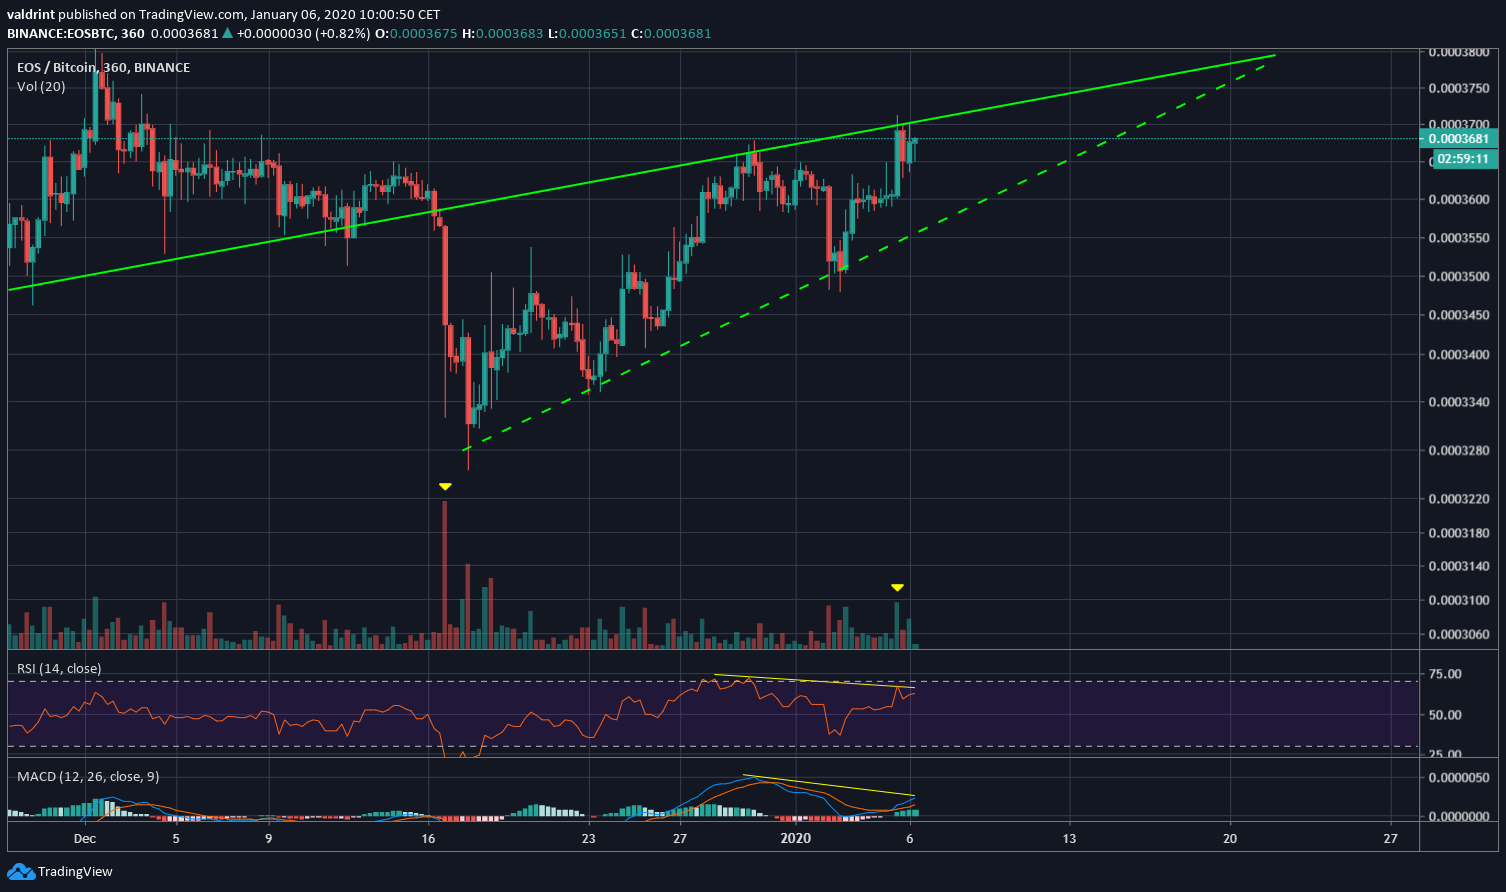
Since September 6, the EOS price has been following an ascending support line while making several attempts at breaking out above the 4300 satoshi support area — all unsuccessful. On December 16, the price broke down below this support line. It has been increasing since and has validated the support line twice more. At the time of writing, it was making another attempt at reclaiming this line. This could either be a sign that the lower levels could not be sustained, therefore pointing out to an upward move in the future, or a retest of the previous support line, indicating that the price will decrease and again reach the 3000 satoshi support area. The second scenario seems more likely. Since the aforementioned breakdown, the EOS price has been following a very steep ascending support line. Combining this with the previous support line which is now acting as resistance, it is creating an ascending wedge — which is considered a bearish pattern.
Additionally, the volume has been much lower during the upward move than the breakdown — suggesting that the move does not have a lot of strength.
Finally, both the RSI & MACD have generated bearish divergence, visible up to the six-hour time-frame.

Future Movement
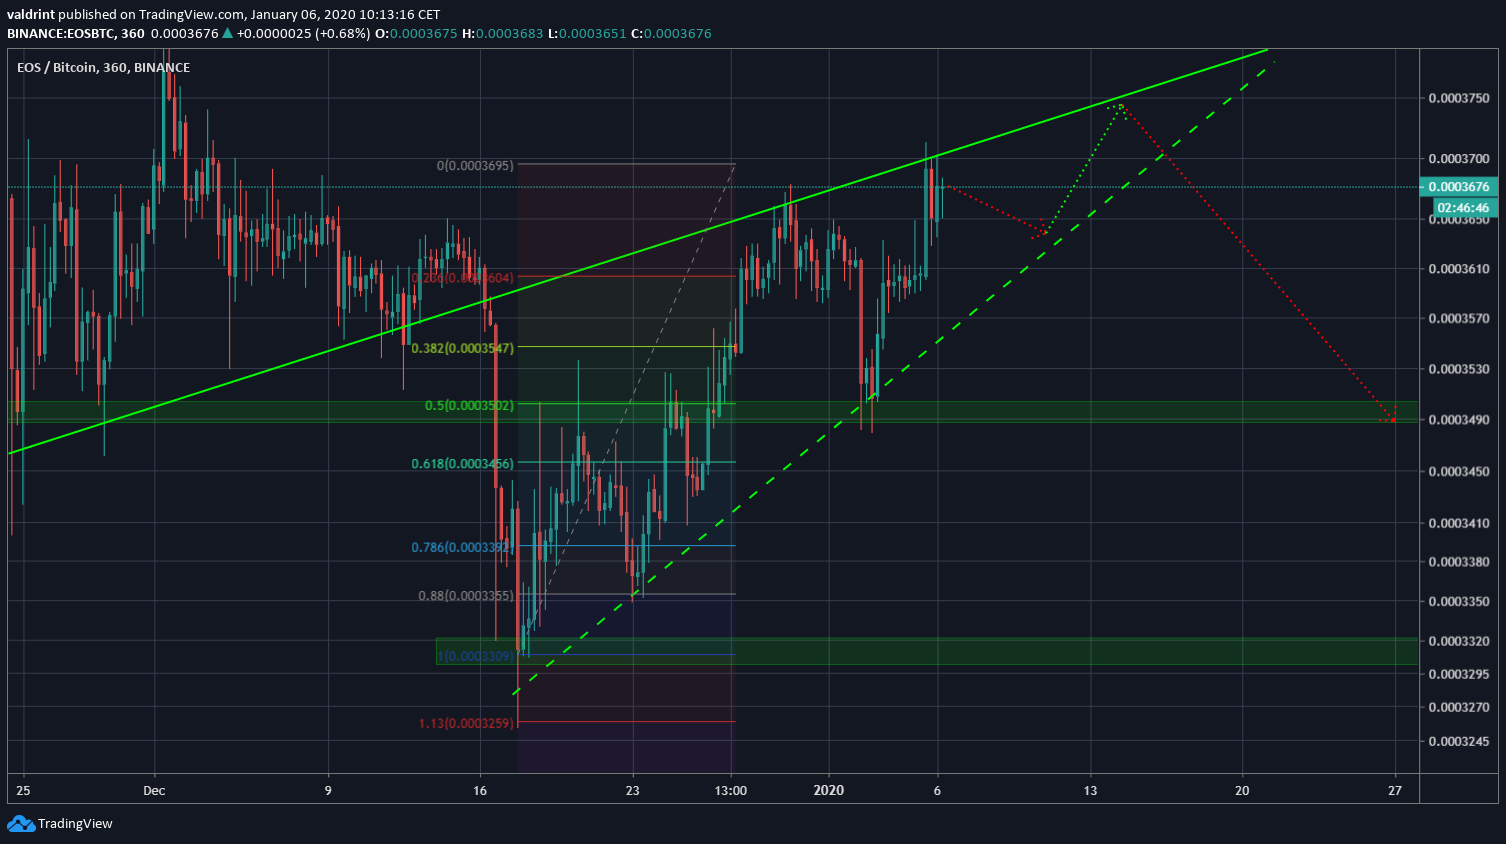
Due to the market structure, the most common movement seems a breakdown from this ascending wedge. However, this does not suggest that the EOS price will decrease all the way to the bottom of the range. Rather, the price could see some relief once it reached the 3500 satoshis support area (0.5 Fib level) and possibly the bottom of the wedge at 3300 satoshis. To conclude, the EOS price recently broke down below a significant support line. At the time of writing, it was attempting to reclaim the support area. We do not believe it will be successful in doing so, rather it will decrease to at least one of the support areas outlined above, before potentially making another attempt at doing so.
Disclaimer
In line with the Trust Project guidelines, this price analysis article is for informational purposes only and should not be considered financial or investment advice. BeInCrypto is committed to accurate, unbiased reporting, but market conditions are subject to change without notice. Always conduct your own research and consult with a professional before making any financial decisions. Please note that our Terms and Conditions, Privacy Policy, and Disclaimers have been updated.

