

Hedera’s price has seen a sharp double-digit decline over the past week. This has pushed it below key support levels that it has since struggled to break above.
Without a surge in buying pressure, HBAR may continue to struggle, with further downside likely in the short term.
Hedera Faces Strong Resistance
Broader market decline and weak demand for HBAR have caused a double-digit decline in its value over the past seven days. Currently exchanging hands at $0.23, the 17th crypto asset by market cap has noted a 24% dip in its price during that period.
Due to this, its price has broken below its Ichimoku Cloud, which now forms strong resistance above it. HBAR is positioned below this indicator’s Leading Spans A (green) and B (red) at press time.
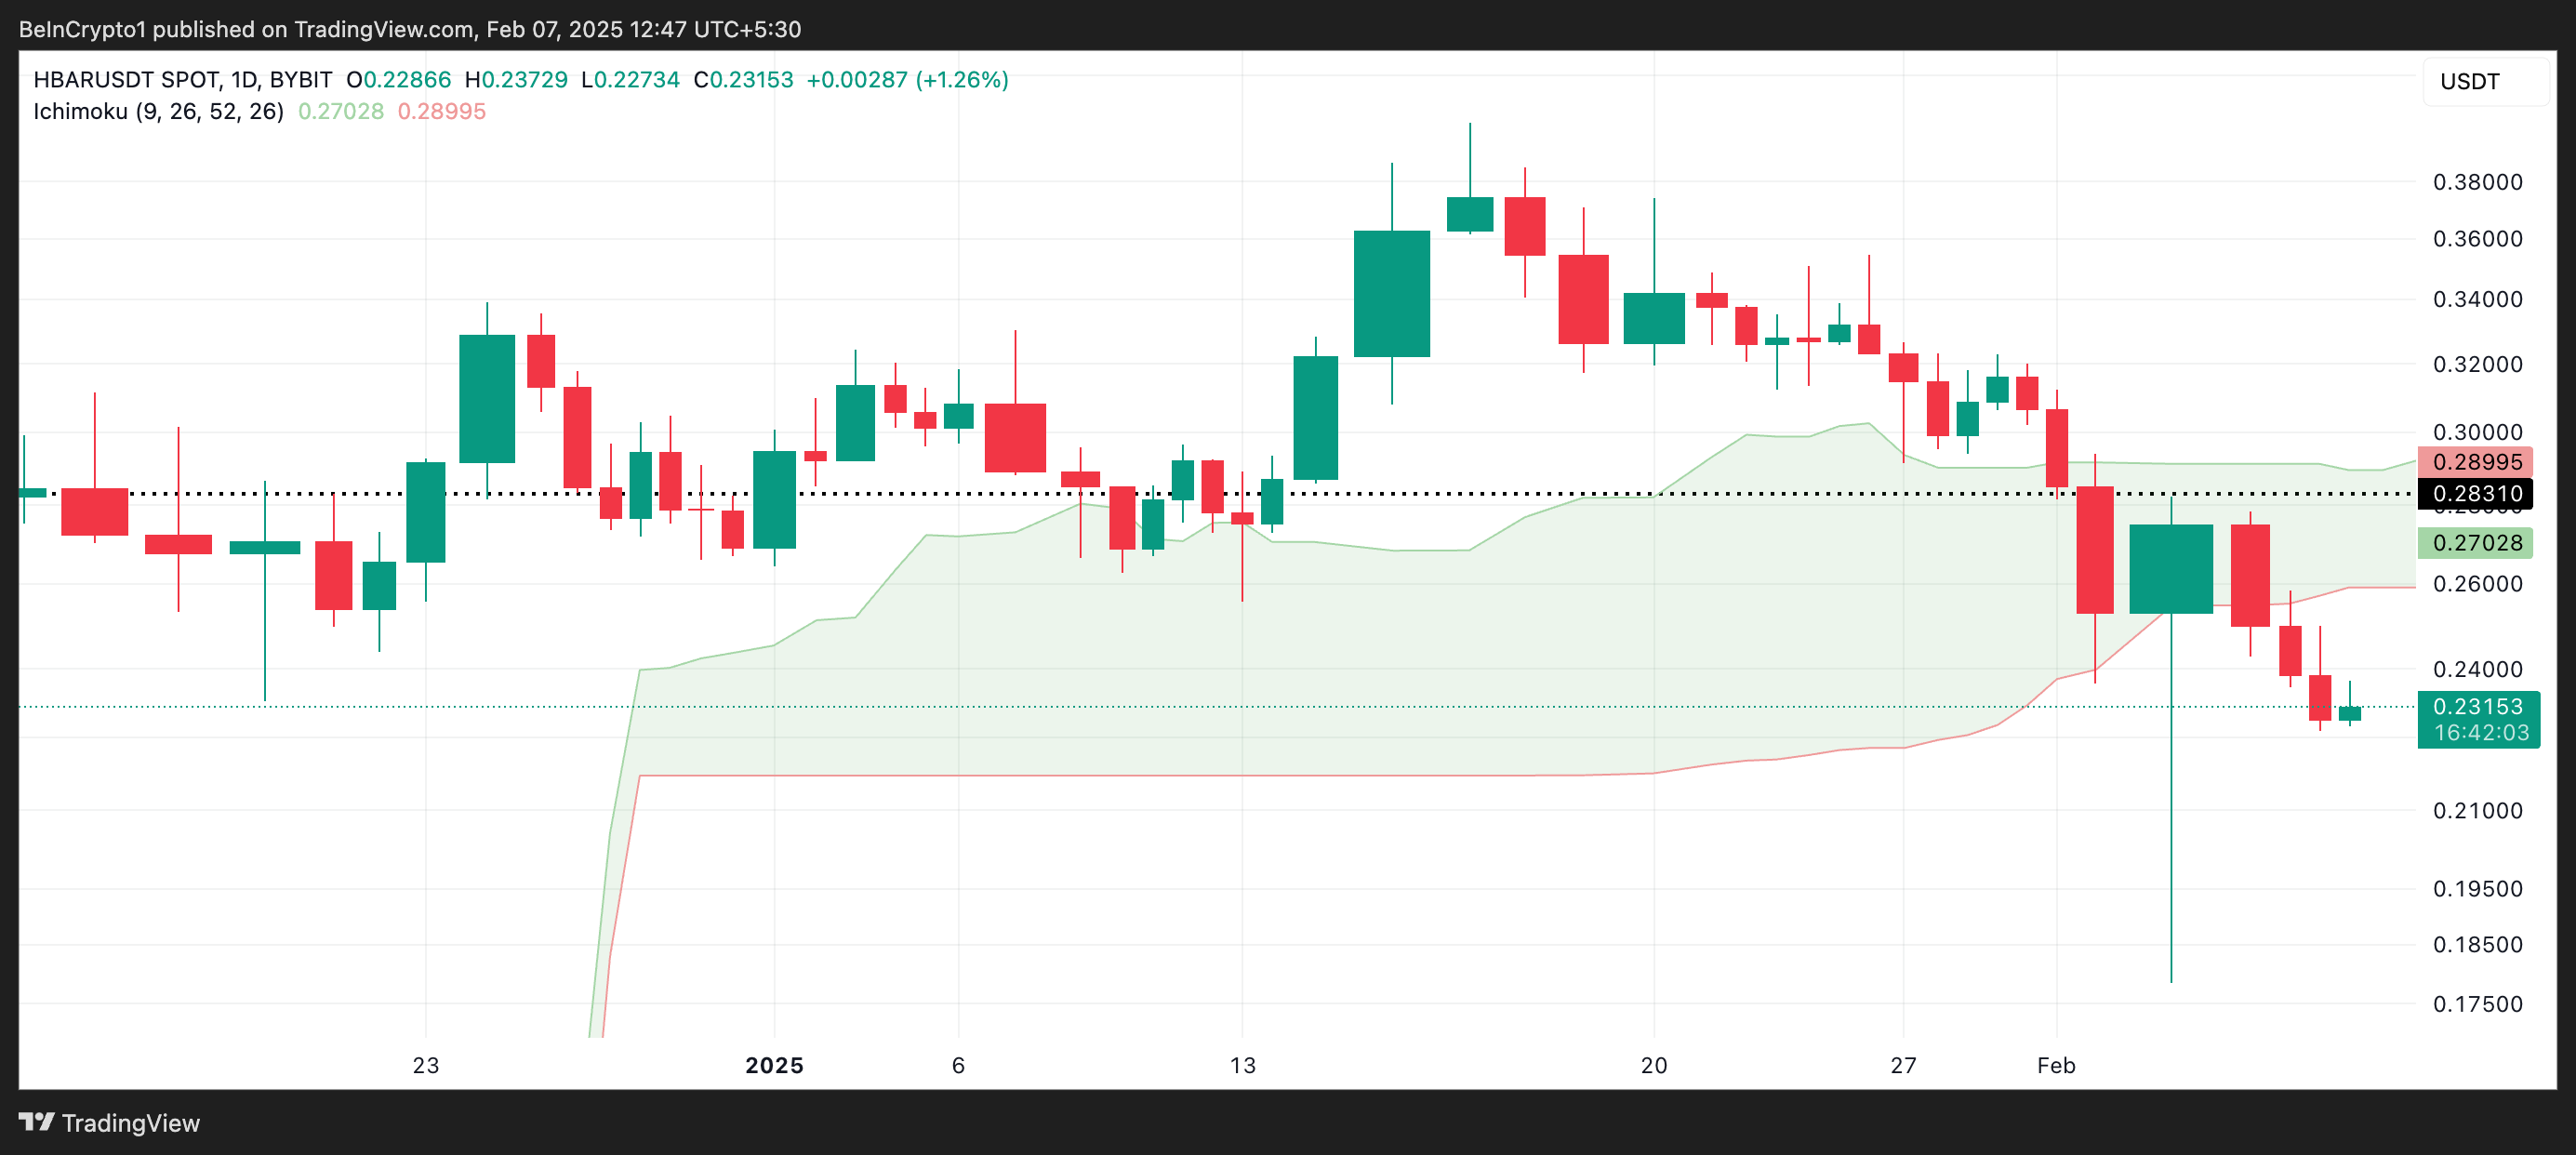
The Ichimoku Cloud measures the momentum of an asset’s market trends and identifies potential support/resistance levels. When an asset falls below this cloud, the market is in a downtrend.
In this scenario, the cloud acts as a dynamic resistance zone for HBAR. It reinforces the likelihood of continued downward movement as long as the altcoin’s price remains below it and demand is low.
HBAR’s double-digit price fall has also pushed it below its 20-day exponential moving average (EMA), confirming the bearish outlook above.
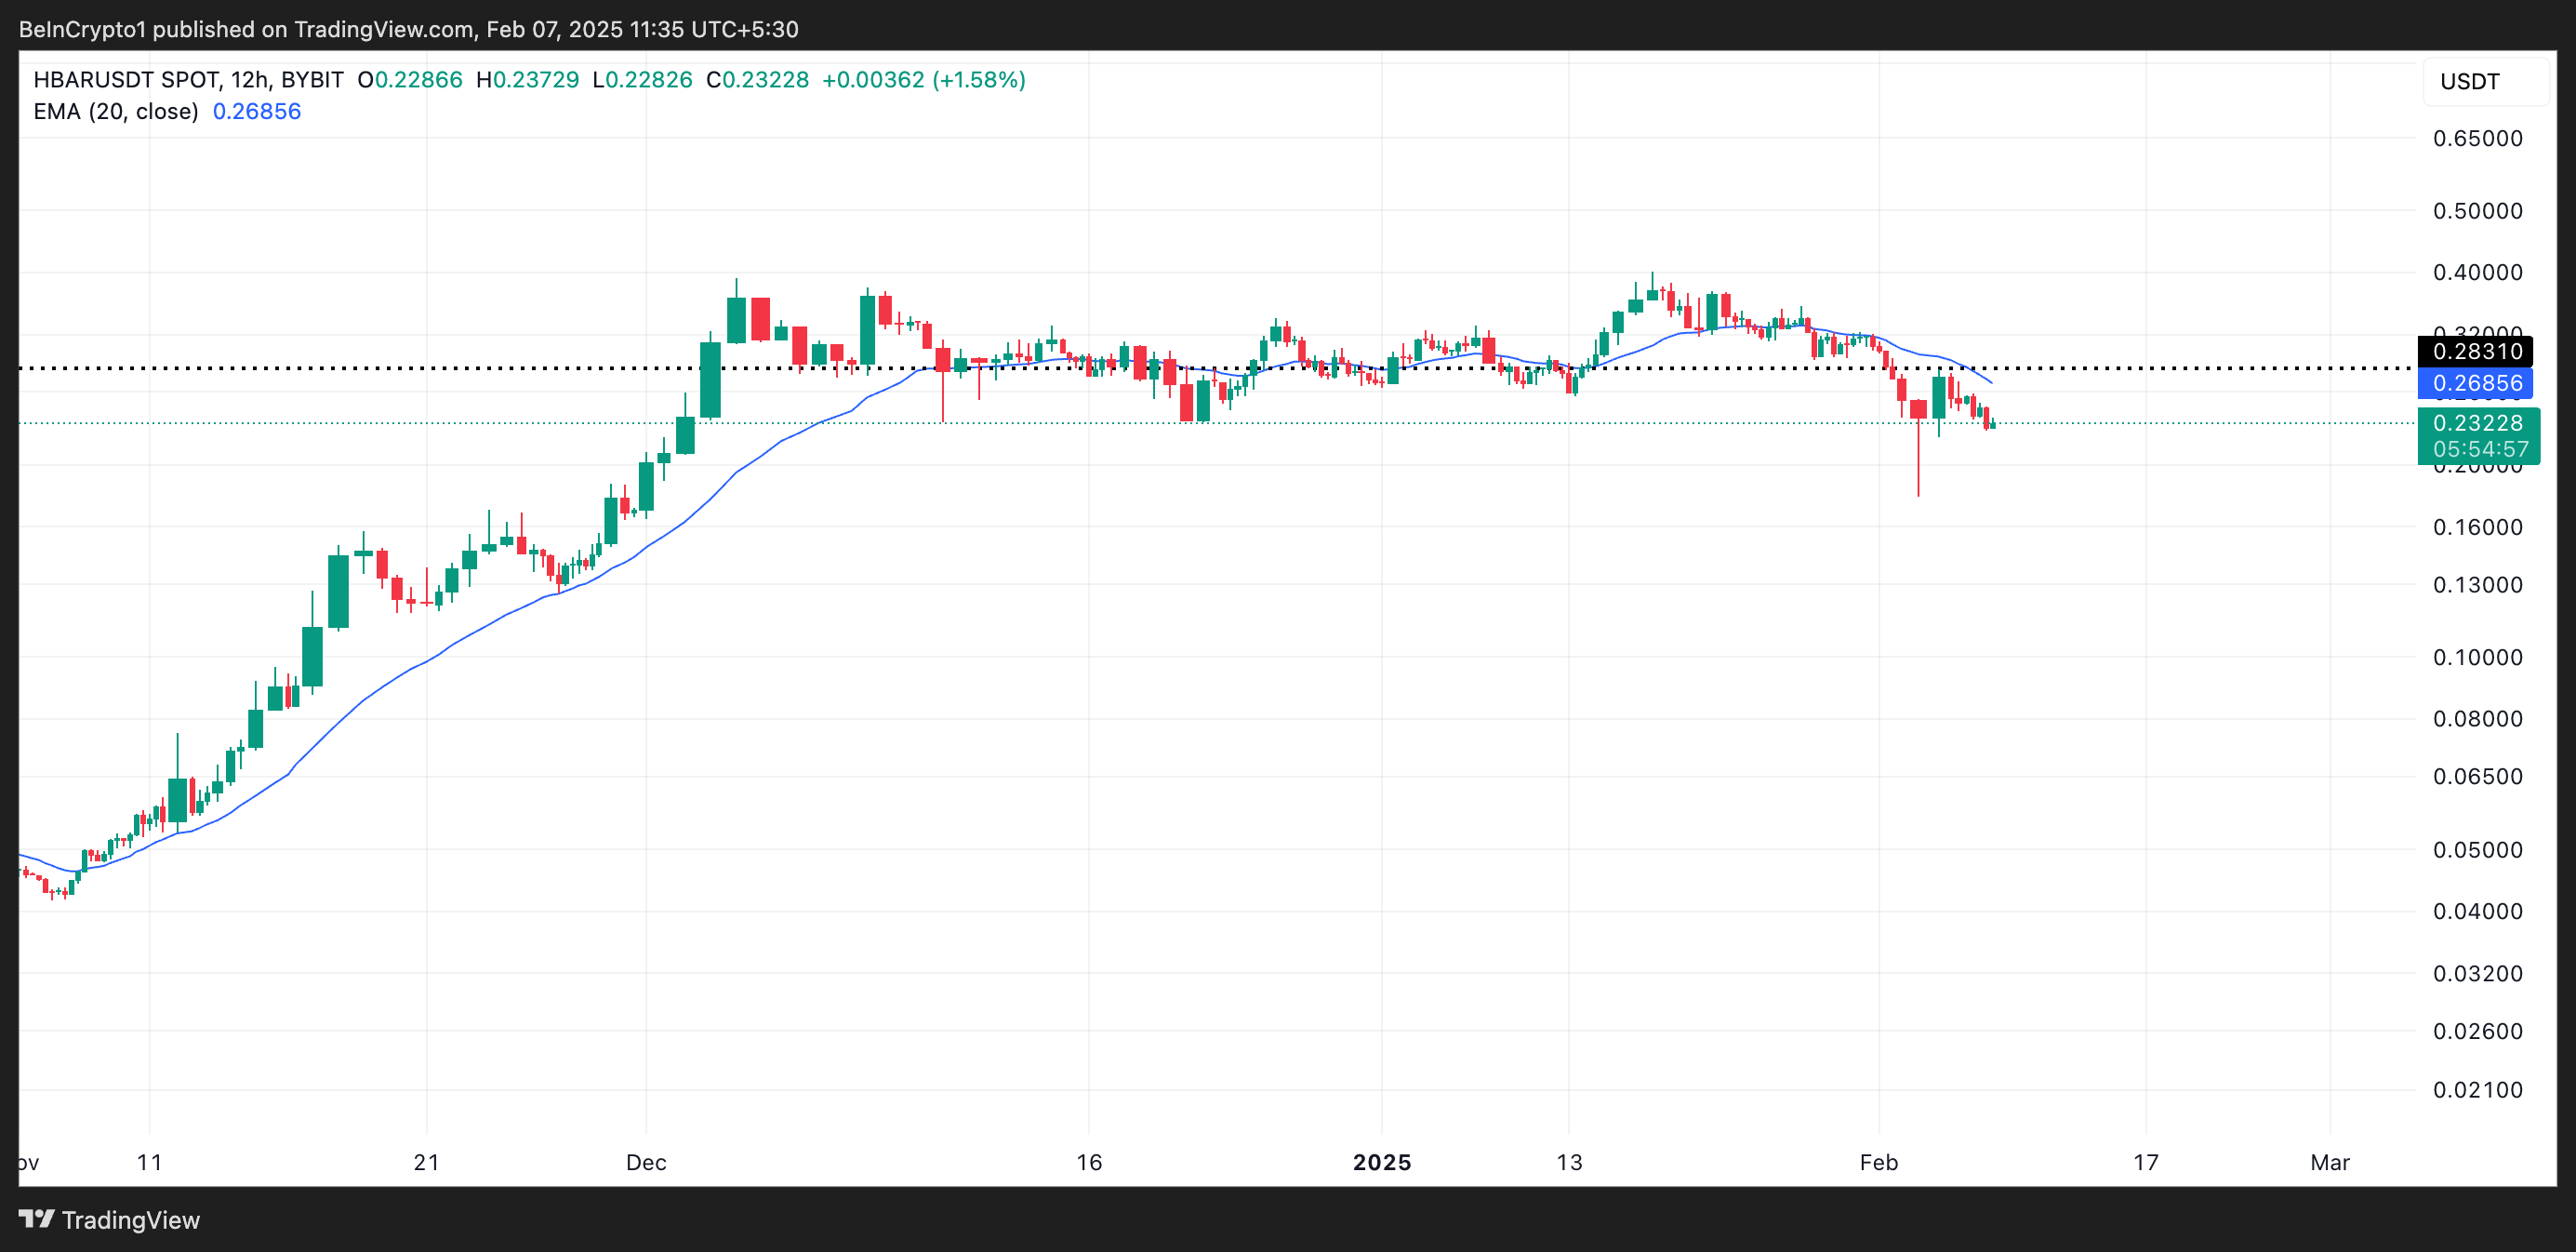
An asset’s 20-day EMA tracks its average price over the last 20 days, giving more weight to recent prices for a smoother trend analysis. When an asset trades above its 20-day EMA, it suggests bullish momentum, indicating buyers are in control.
However, as with HBAR, when the price falls below this level, it signals weakening demand and a potential shift to a bearish trend as sellers gain dominance.
HBAR Price Prediction: Is a Bounce Back to $0.28 Possible?
HBAR’s Relative Strength Index (RSI) reflects the high selling pressure among market participants. At press time, the value of the momentum indicator is 35.58.
The RSI indicator measures an asset’s oversold and overbought market conditions. It ranges between 0 and 100, with values above 70 indicating that the asset is overbought and due for a decline. Conversely, values below 30 suggest that the asset is oversold and may soon witness a rebound.
At 35.58, HBAR’s RSI indicates that it is in bearish territory but not yet oversold, suggesting weak buying momentum. If selling pressure strengthens, HBAR risks falling below the $0.20 price zone to trade at $0.16.
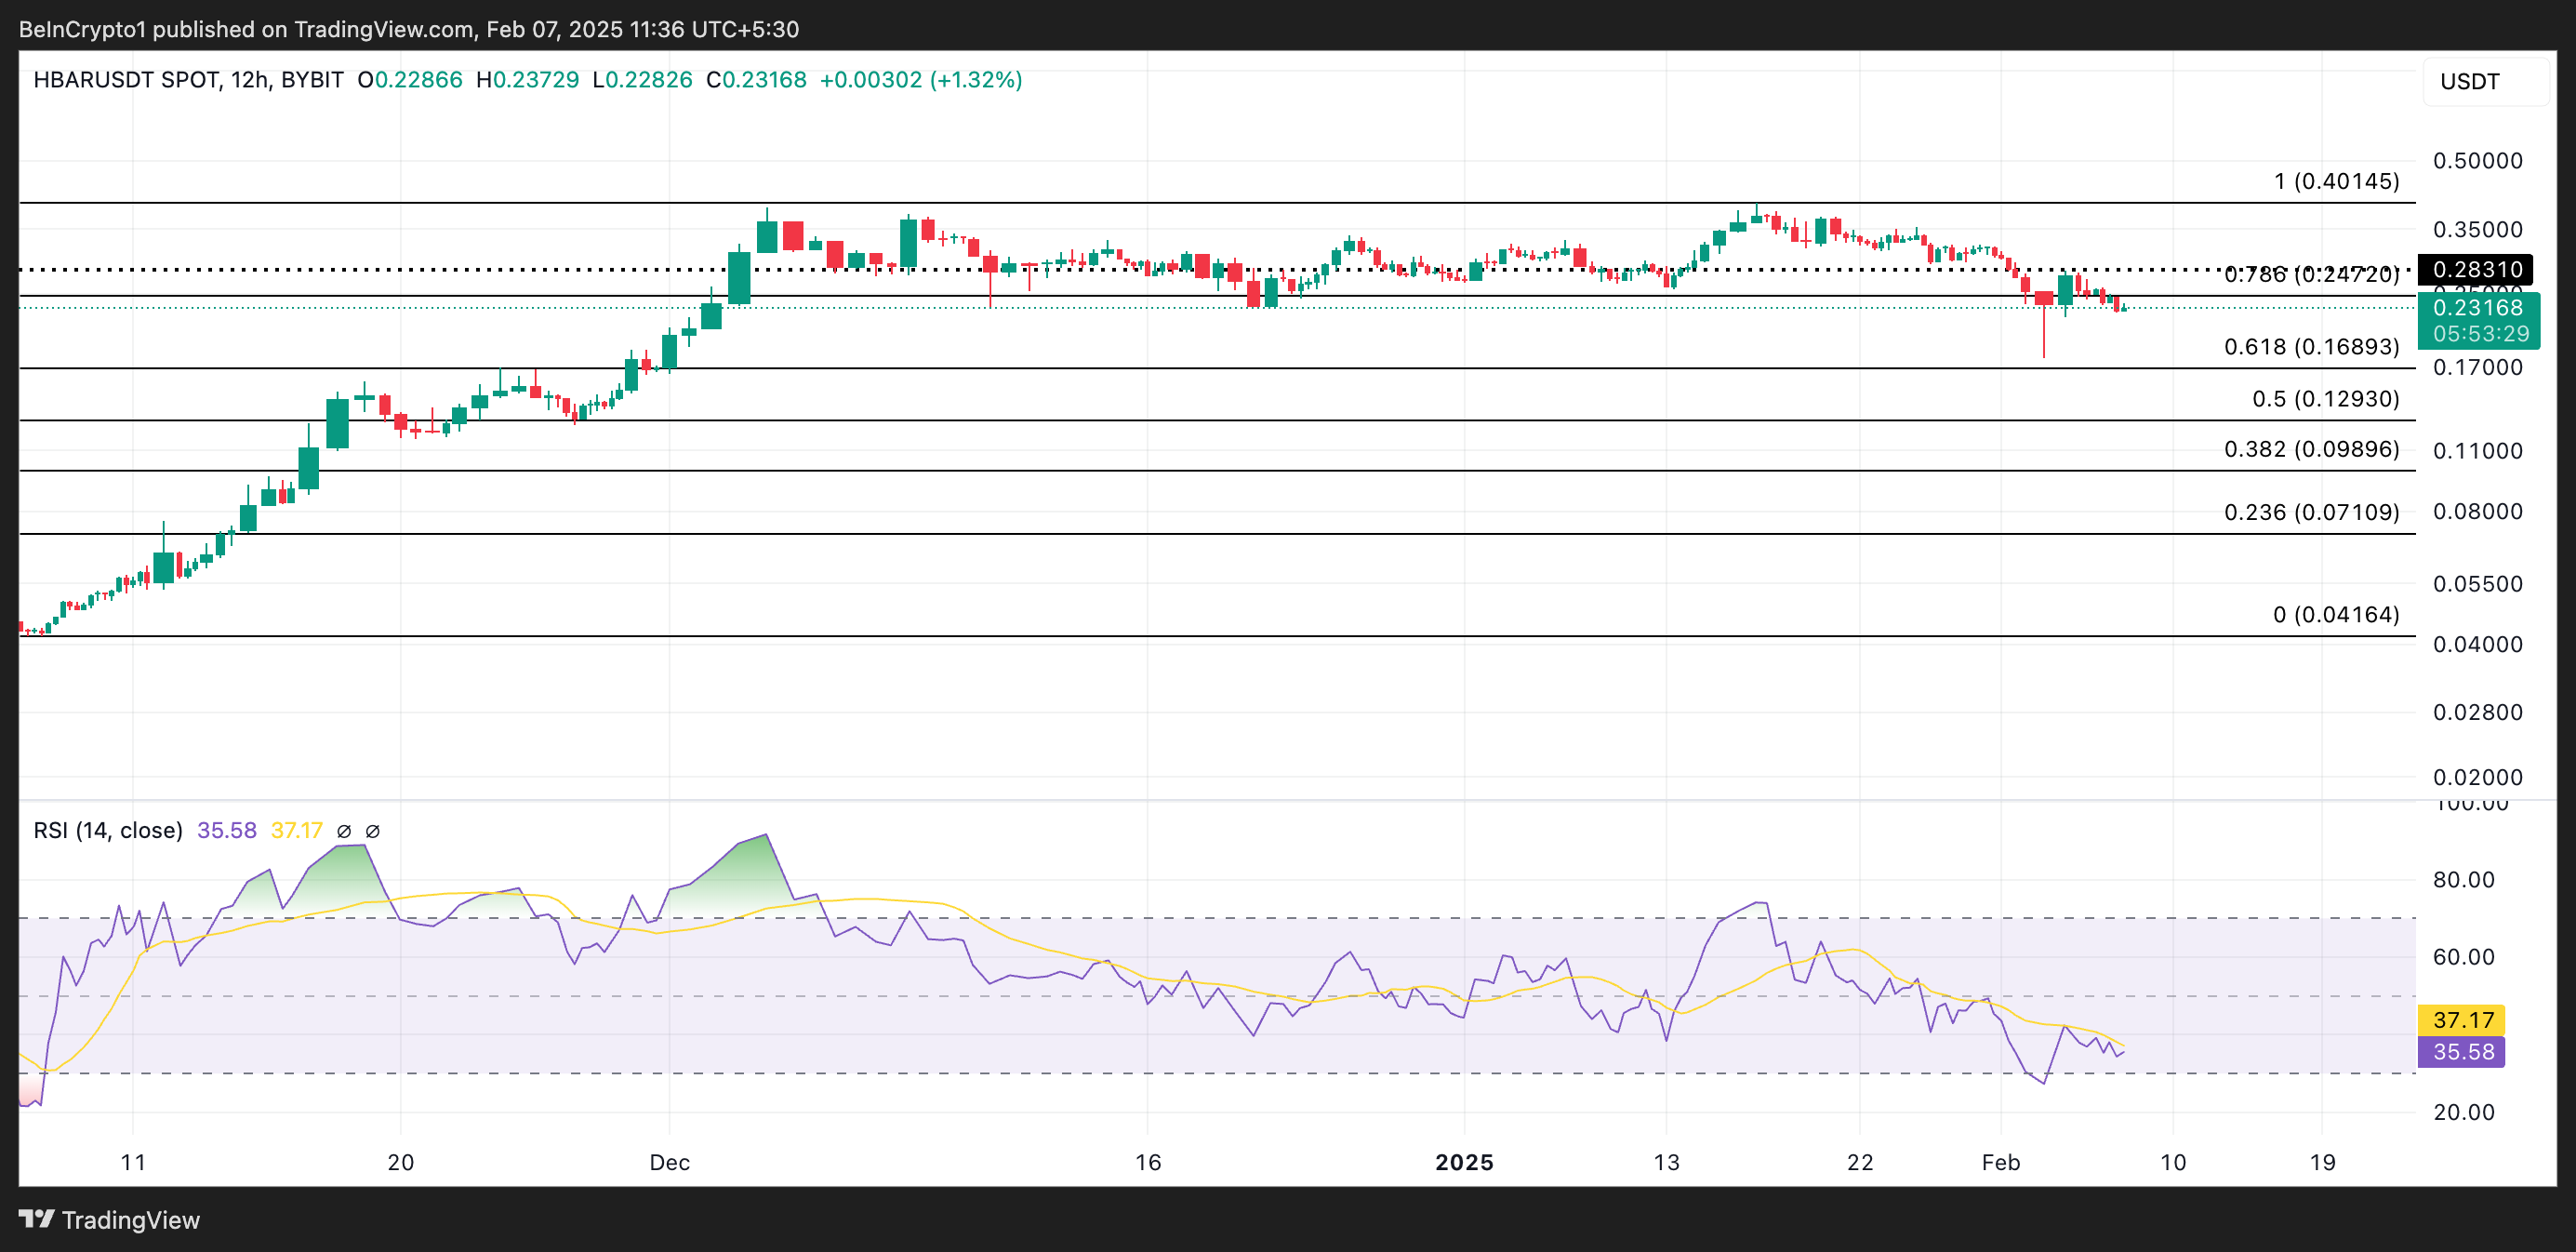
However, while this momentum indicator signals increased selling pressure, a further drop in its value below 30 would confirm oversold conditions, potentially hinting at a price rebound. In this scenario, a surge in HBAR’s demand could drive its price to $0.28. A successful break above this level could propel it toward $0.40.
Disclaimer
In line with the Trust Project guidelines, this price analysis article is for informational purposes only and should not be considered financial or investment advice. BeInCrypto is committed to accurate, unbiased reporting, but market conditions are subject to change without notice. Always conduct your own research and consult with a professional before making any financial decisions. Please note that our Terms and Conditions, Privacy Policy, and Disclaimers have been updated.