

Mantra’s native coin OM has staged a comeback after noting a 5% price drop in the past week. Exchanging hands at $1.40, OM’s price has climbed by 9% over the past 24 hours. It currently ranks as the market’s top gainer during that period.
With a surge in demand for the altcoin, it is poised to reclaim its all-time high of $1.62. The question remains: how soon can this happen?
Mantra Whale Takes Action
OM leads the crypto market gains with a 9% price uptick over the past 24 hours. This rally comes after the altcoin shed 5% of its value in the past seven days.
The price uptick recorded in the past 24 hours is partly driven by the action of an OM whale. In a post on X, pseudonymous on-chain analyst Spot On Chain found that early Monday, the large investor withdrew 2.71 million OM (valued at $3.8 million) from Binance in three transactions, marking the first such move in seven months.
Read more: What Are Tokenized Real-World Assets (RWA)?
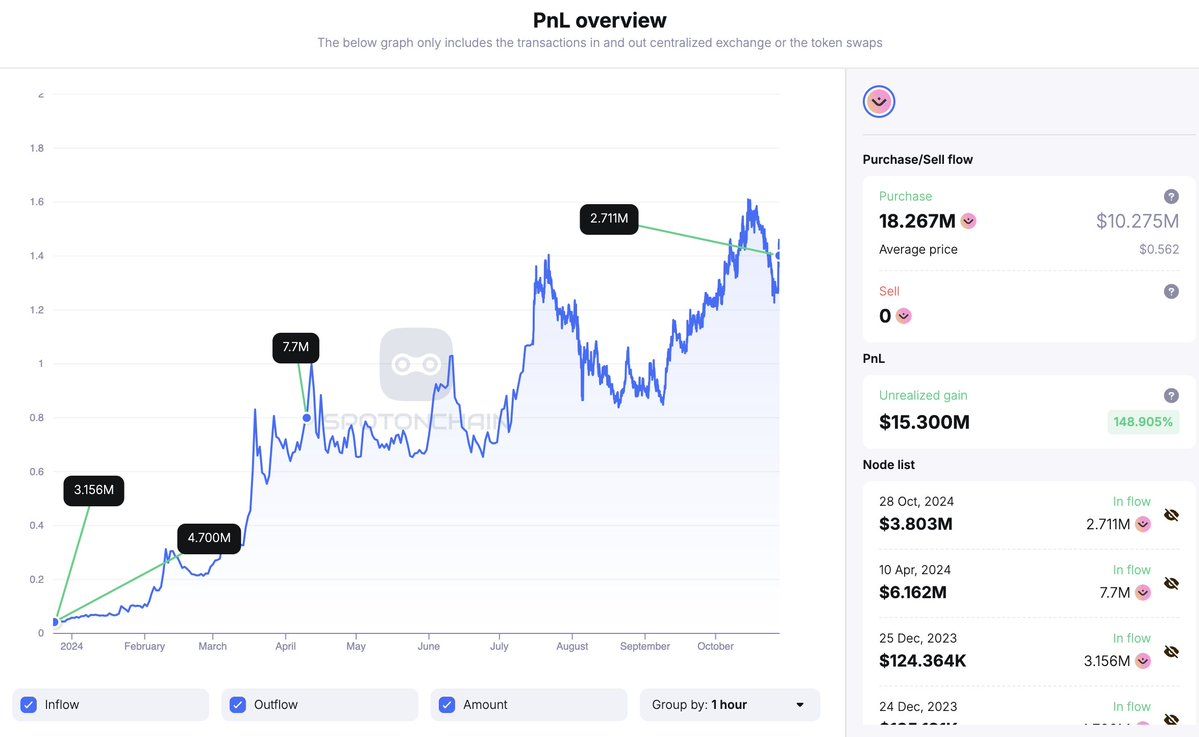
Previously, the whale had withdrawn 12.3 million OM from Binance and staked it. It currently sits on an unrealized profit of $15 million over the past seven months.
Mantra Bulls Re-Emerge
Apart from this whale action, OM’s price rally is also fueled by a surge in general market demand, as reflected in its spiking trading volume. Over the past 24 hours, this has totaled $68 million, climbing by over 300%. Per Santiment’s data, OM’s daily trading volume currently sits at its highest since July.
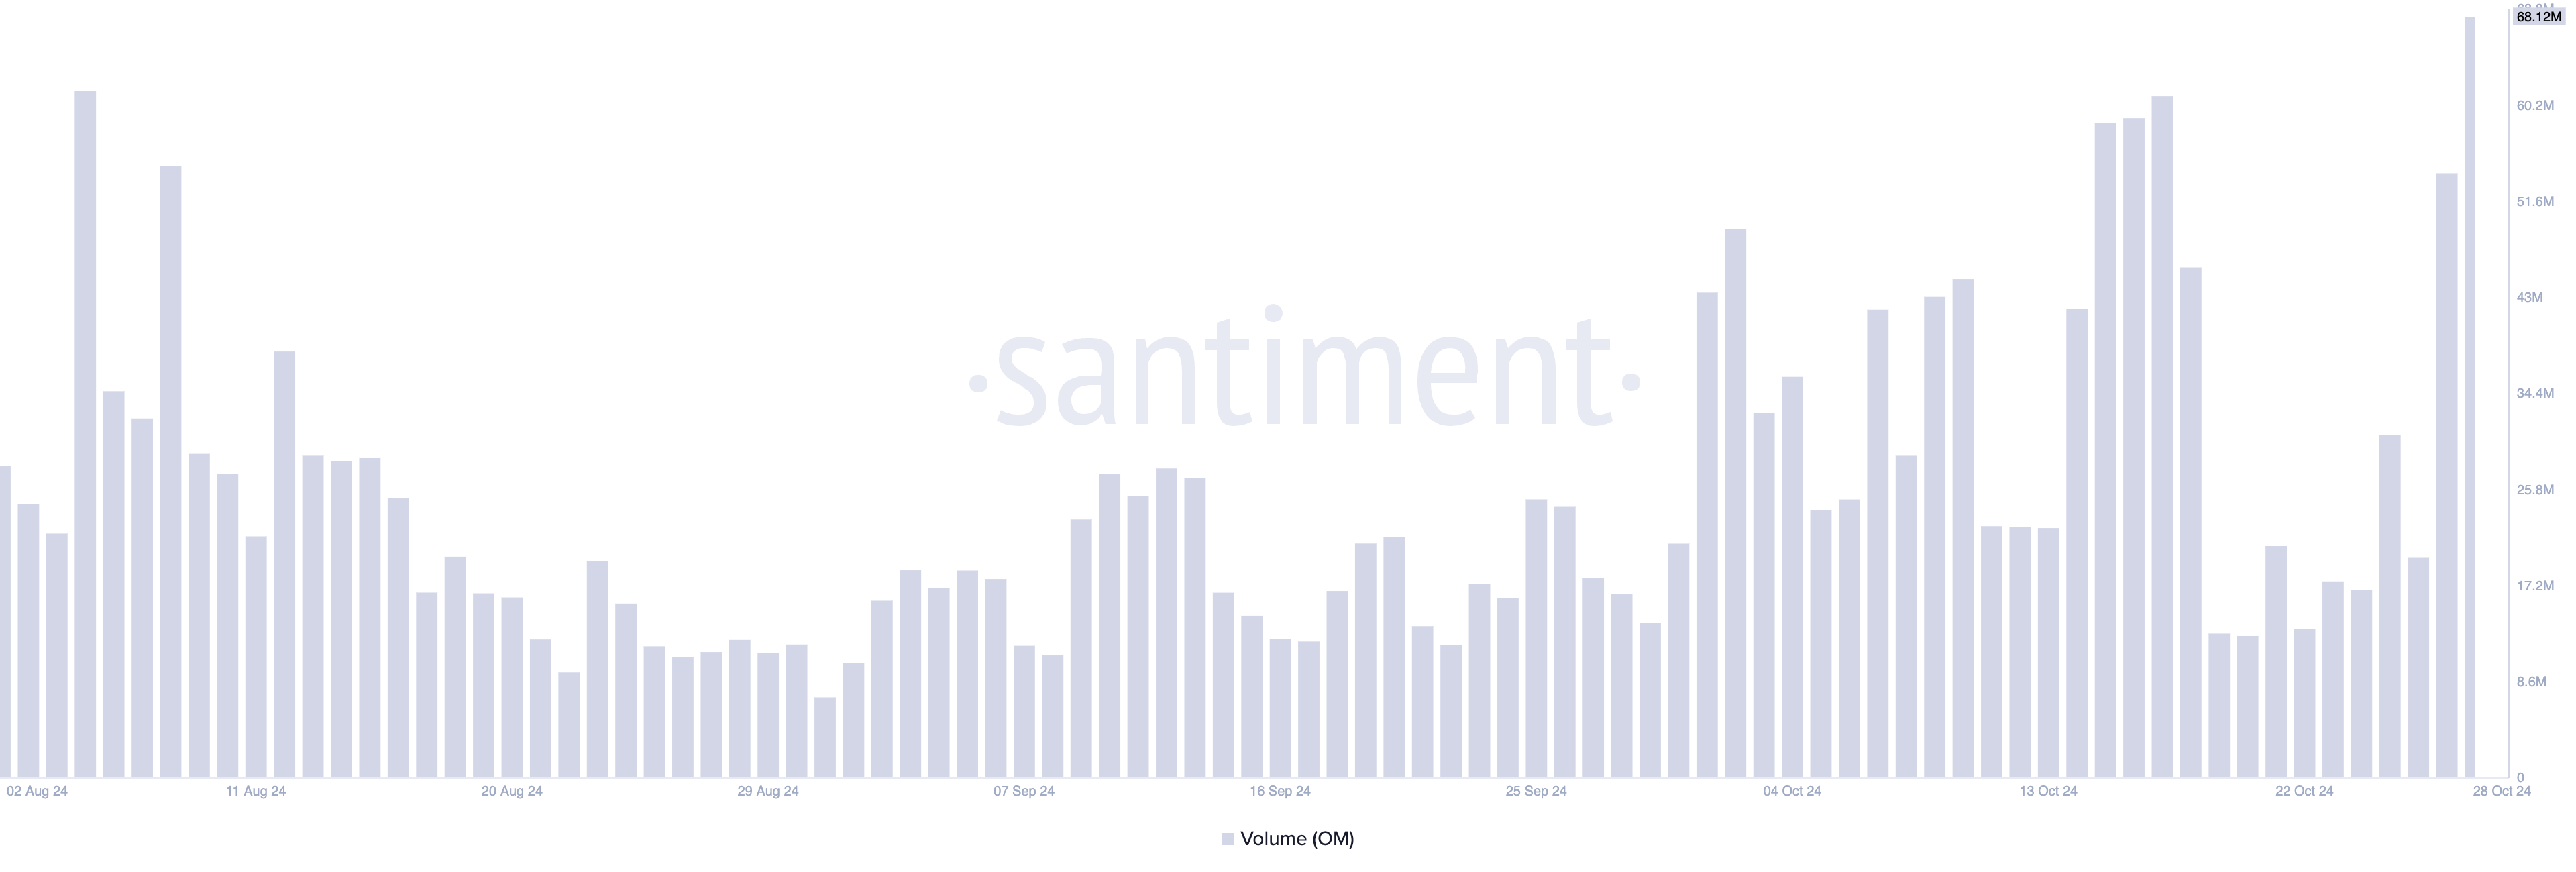
When a surge in trading volume accompanies an asset’s price rally, it signals strong market interest. This combination is a bullish signal, as high volume suggests that the price increase is backed by substantial demand and not fueled by speculative trading activity.
Furthermore, the coin’s Parabolic Stop and Reverse (SAR) indicator confirms this bullish outlook and the likelihood of a rally toward the all-time high. BeInCrypto’s assessment of the OM/USD one-day chart reveals that the dots of this indicator rest below OM’s price for the first time in eight days.
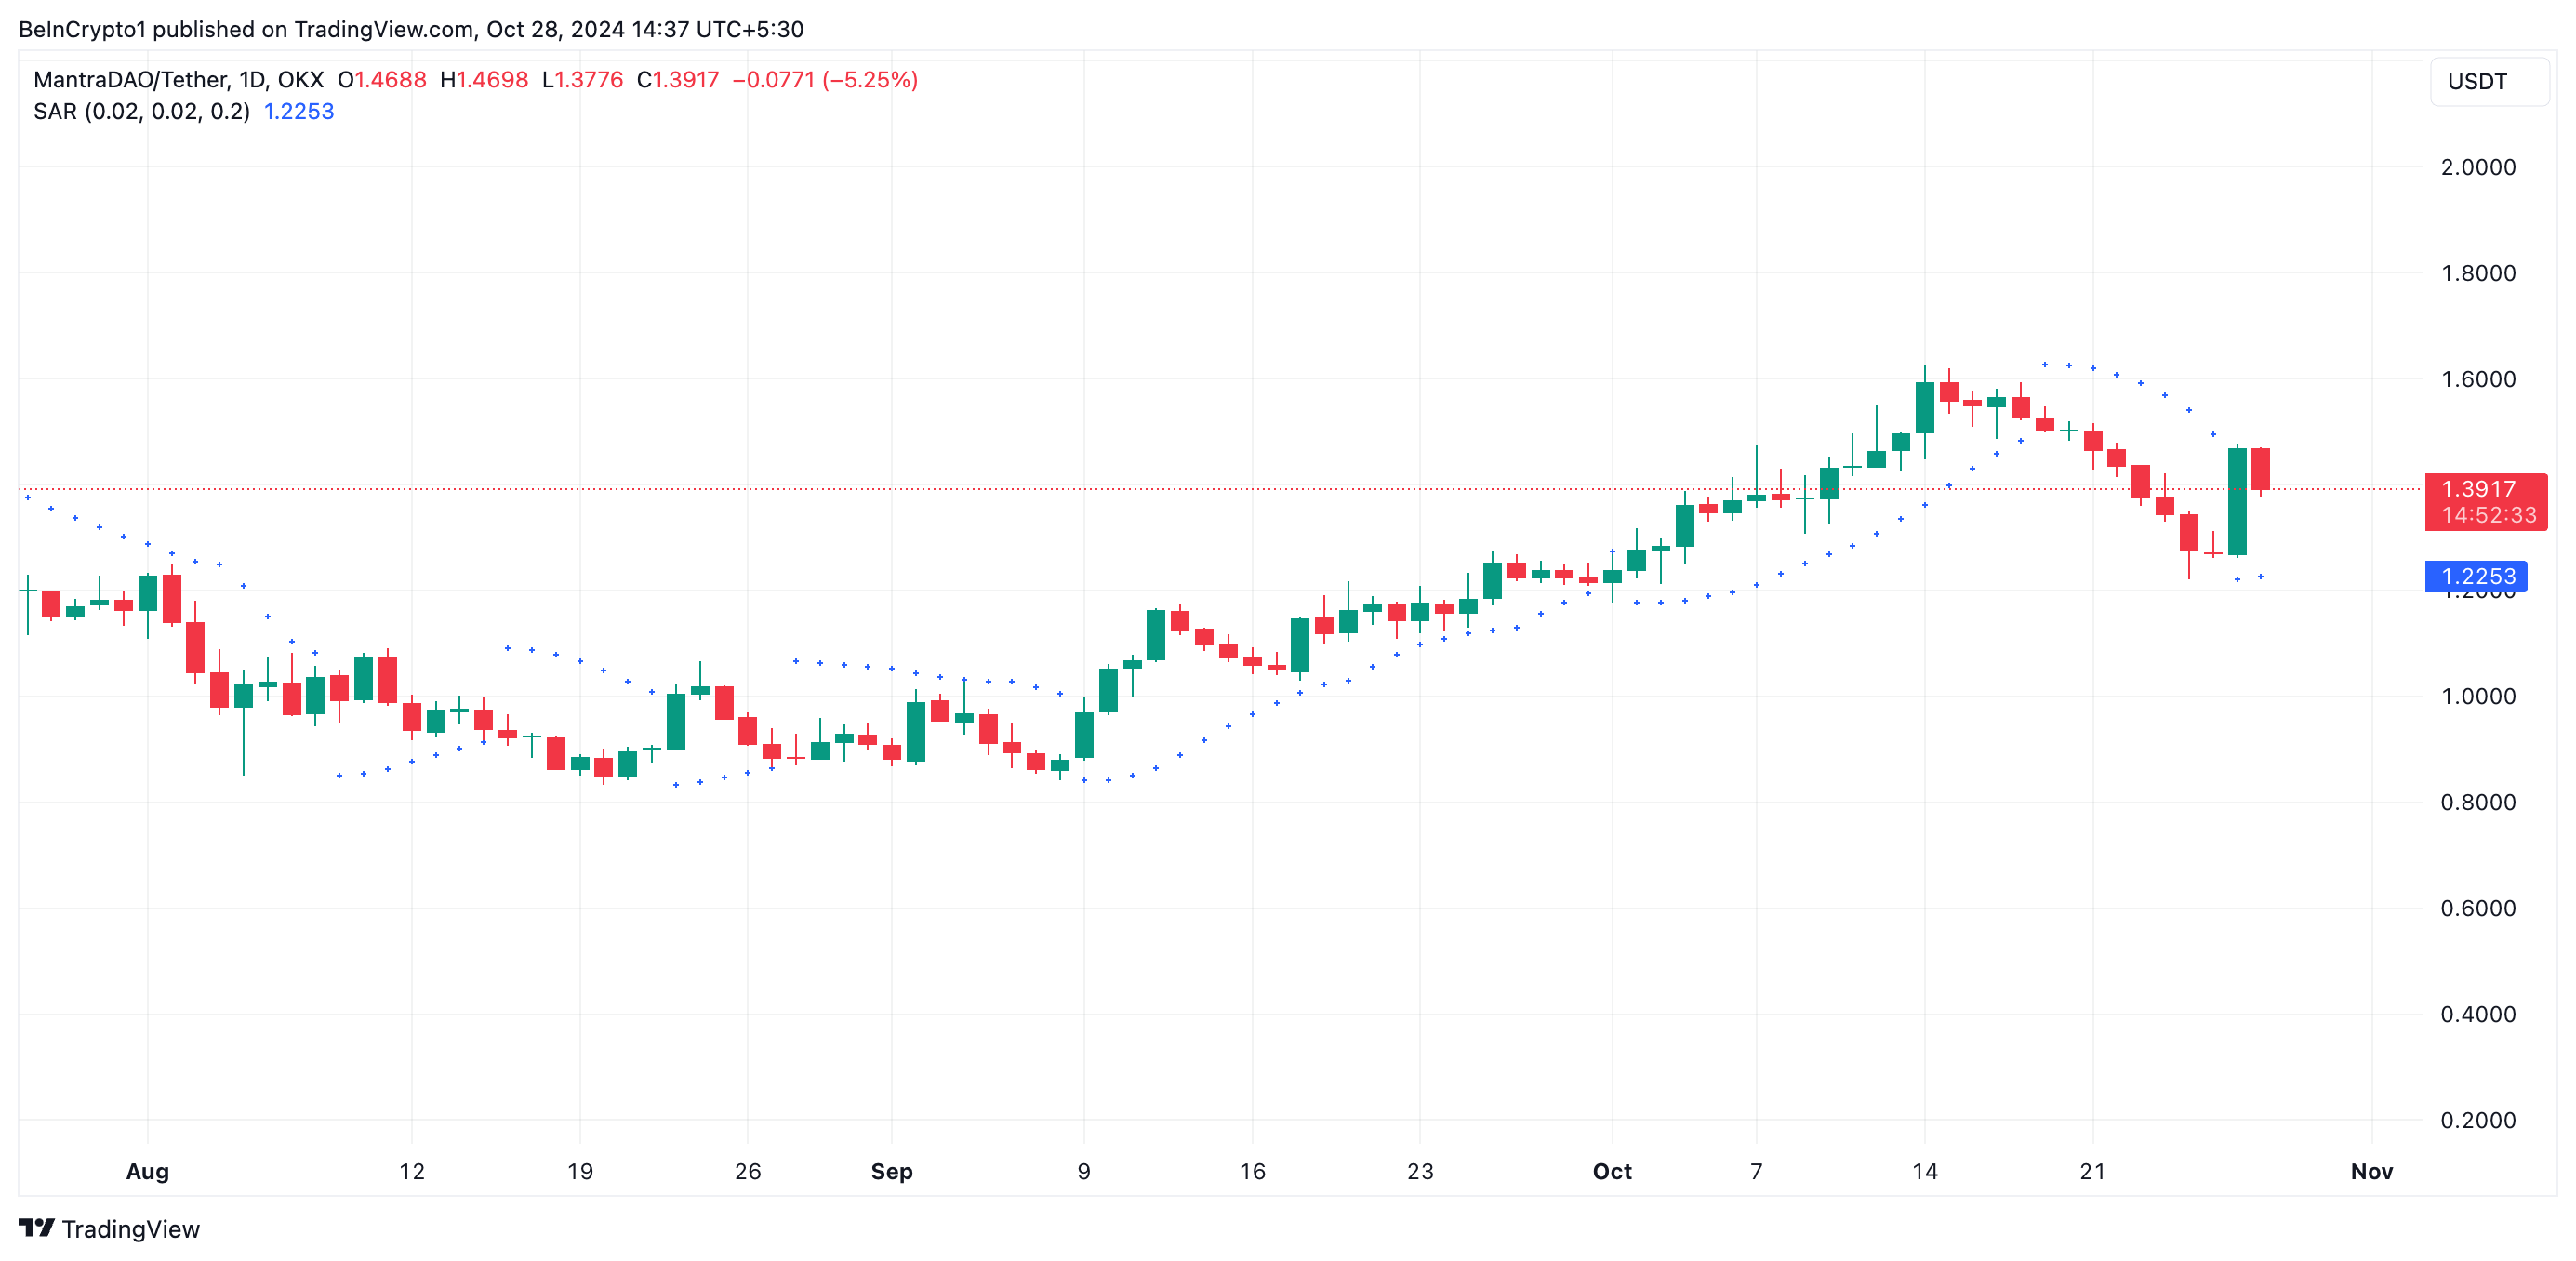
This indicator identifies an asset’s trend direction and potential reversal points. When its dots are positioned under an asset’s price, it suggests that the asset is enjoying upward pressure and the trend is bullish. Traders often interpret this as a signal to go long and exit short positions.
OM Price Prediction: Short Traders Seek New Lows
However, OM’s futures traders do not share this bullish sentiment. Since the price rally began, there has been a spike in the demand for short positions, as evidenced by the coin’s negative funding rates. As of this writing, this is at -0.042%.
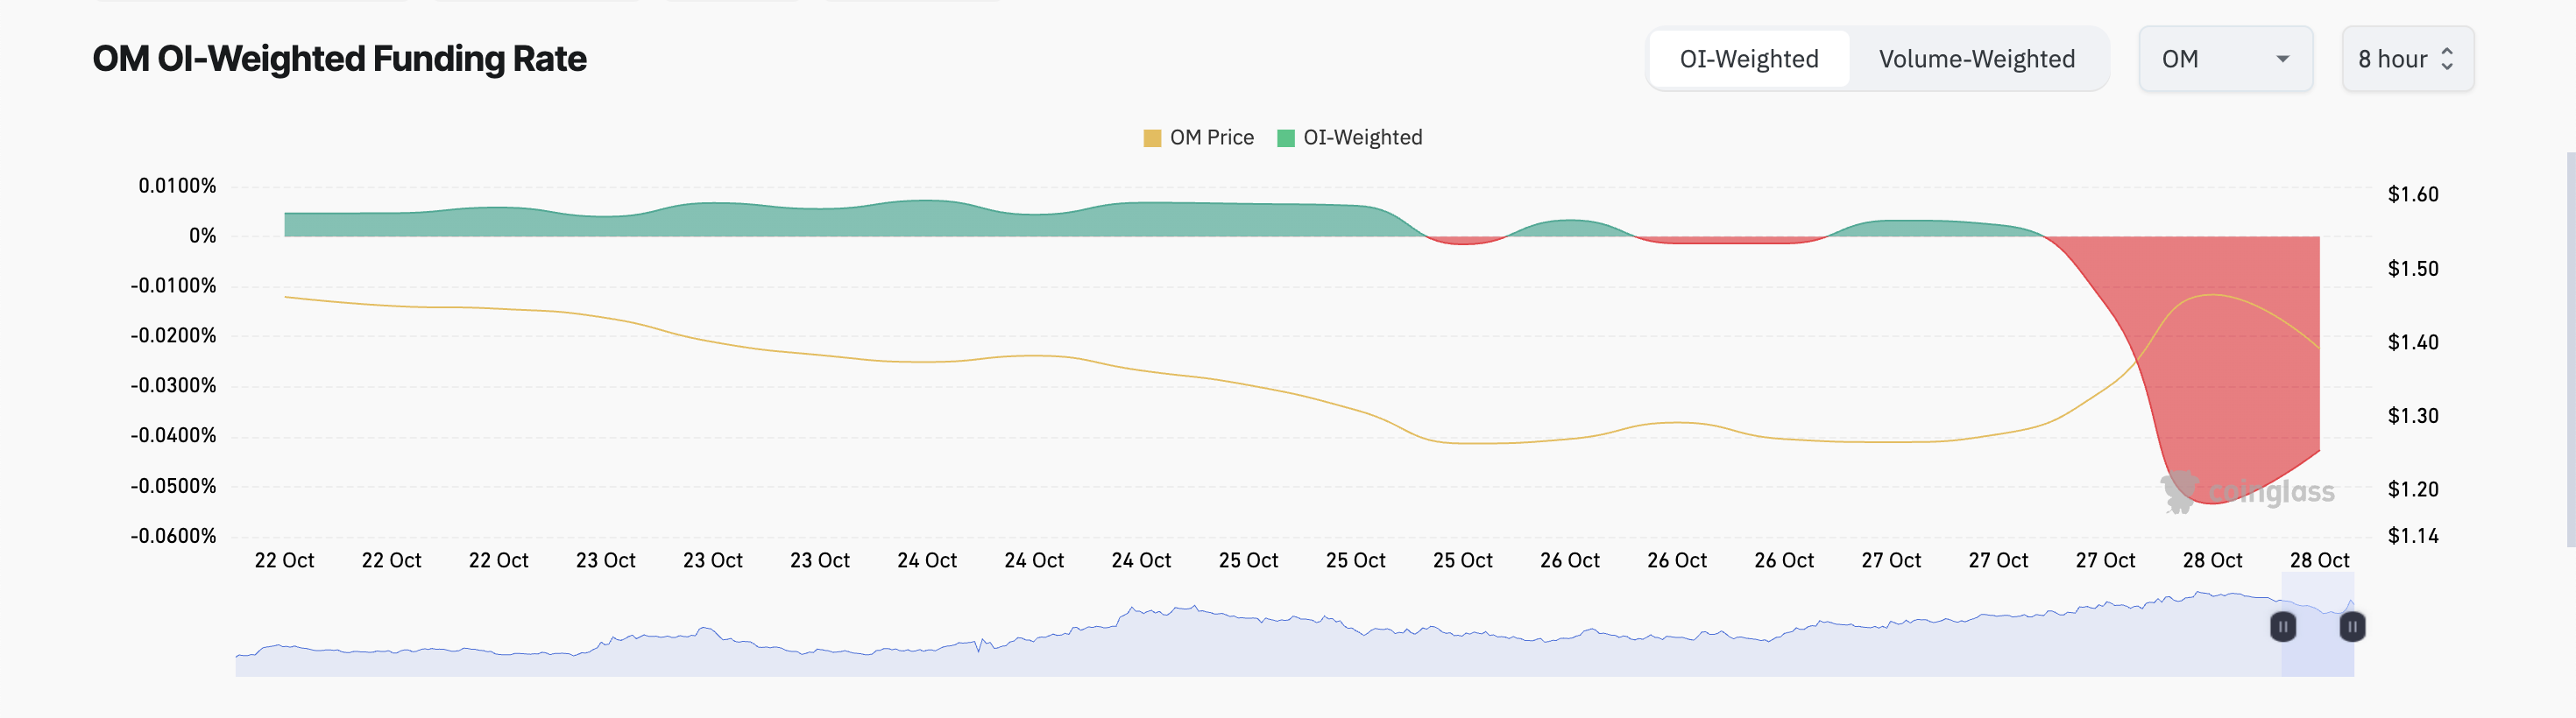
The funding rate refers to the recurring fees between traders in perpetual futures markets. When an asset’s funding rate is negative, there is a higher demand for short positions, indicating that many traders expect the price to decrease.
If these short bets win and OM witnesses a drop in bullish momentum, it may lose the support at $1.39, which it currently trades just above at $1.40. Continued selling pressure could push OM’s price down to its next major support level at $1.25.
Read more: How To Invest in Real-World Crypto Assets (RWA)?
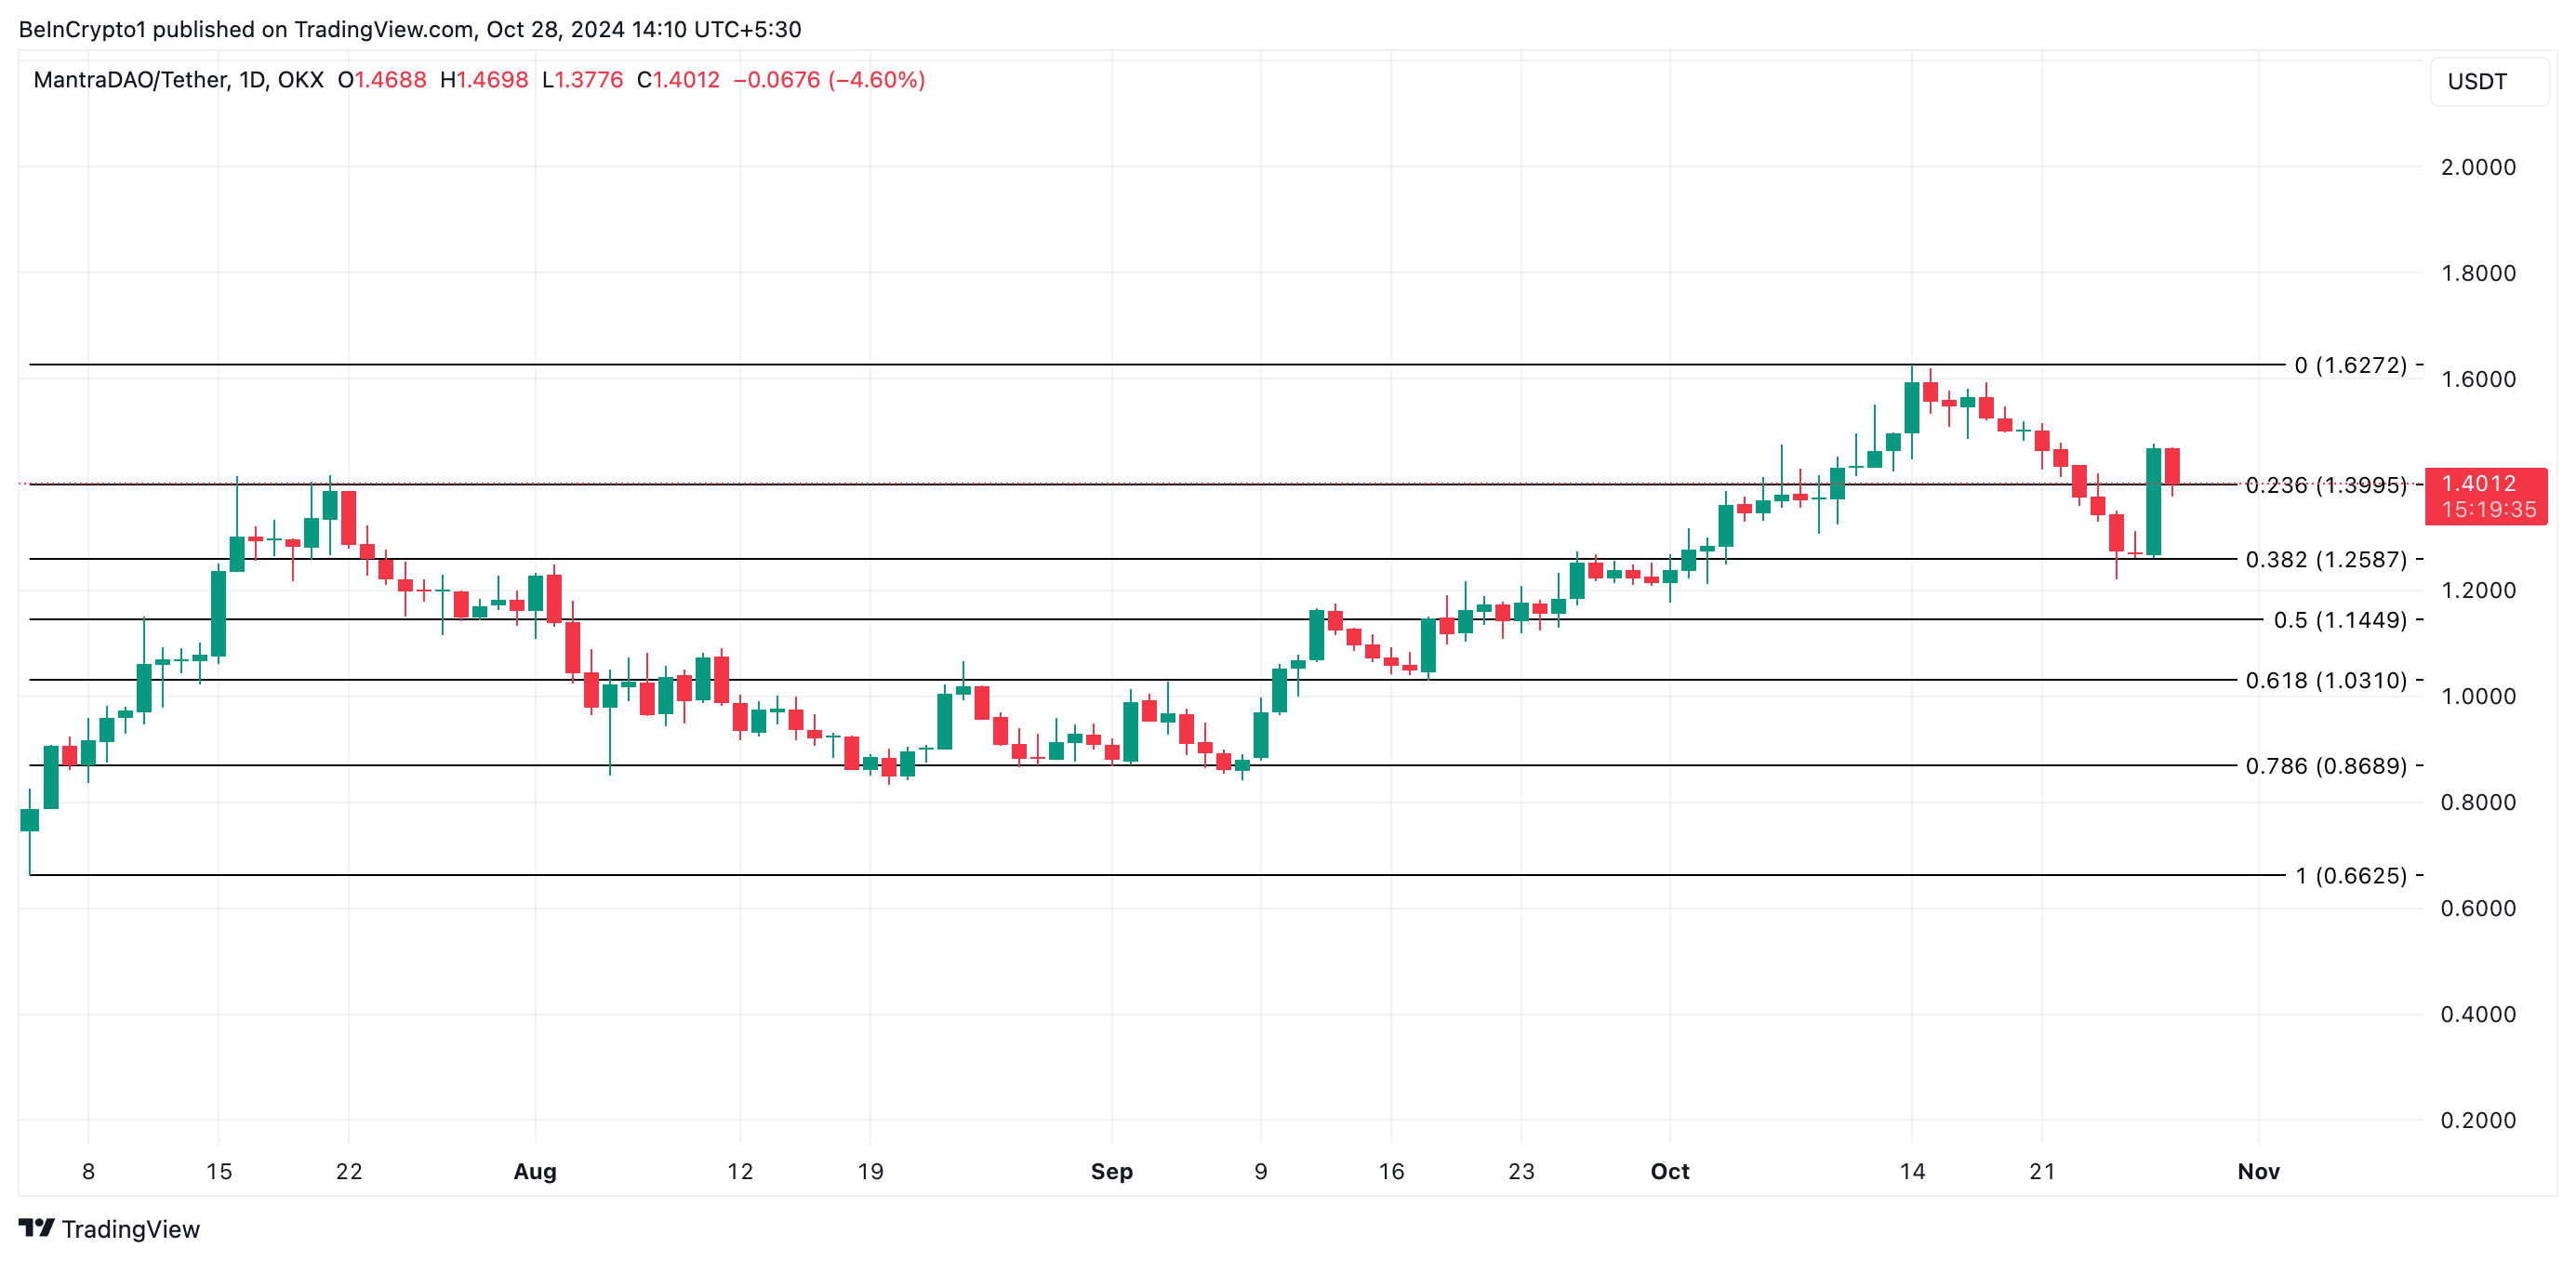
However, if the current market trend holds, the support floor at $1.39 could remain strong, allowing OM’s price to potentially reclaim its all-time high of $1.62—and even rally past it.
Disclaimer
In line with the Trust Project guidelines, this price analysis article is for informational purposes only and should not be considered financial or investment advice. BeInCrypto is committed to accurate, unbiased reporting, but market conditions are subject to change without notice. Always conduct your own research and consult with a professional before making any financial decisions. Please note that our Terms and Conditions, Privacy Policy, and Disclaimers have been updated.