

ApeCoin (APE) price is down roughly 15% in the last 24 hours after rising more than 100% between October 19 and October 21. The MVRV suggests that many holders are still in a position of unrealized losses, indicating weak market sentiment.
The RSI also shows a shift from overbought conditions, implying that bullish momentum may have diminished. Despite some signs of support, key levels and trend indicators suggest that the current correction might not be over yet.
APE MVRV Shows an Important Signal
The APE 7D MVRV is currently at -11.85 %, which indicates that, on average, holders of APE tokens have experienced unrealized losses of 11.85% over the past week. MVRV (Market Value to Realized Value) is a metric used to assess token holders’ average profit or loss.
The 7D MVRV specifically looks at the profit or loss of investors who acquired their tokens within the last seven days. Negative values, like -11.85%, suggest that the majority of recent buyers are underwater, meaning they bought APE at higher prices than it is currently trading at.
Read more: ApeCoin (APE) Price Prediction 2024/2025/2030
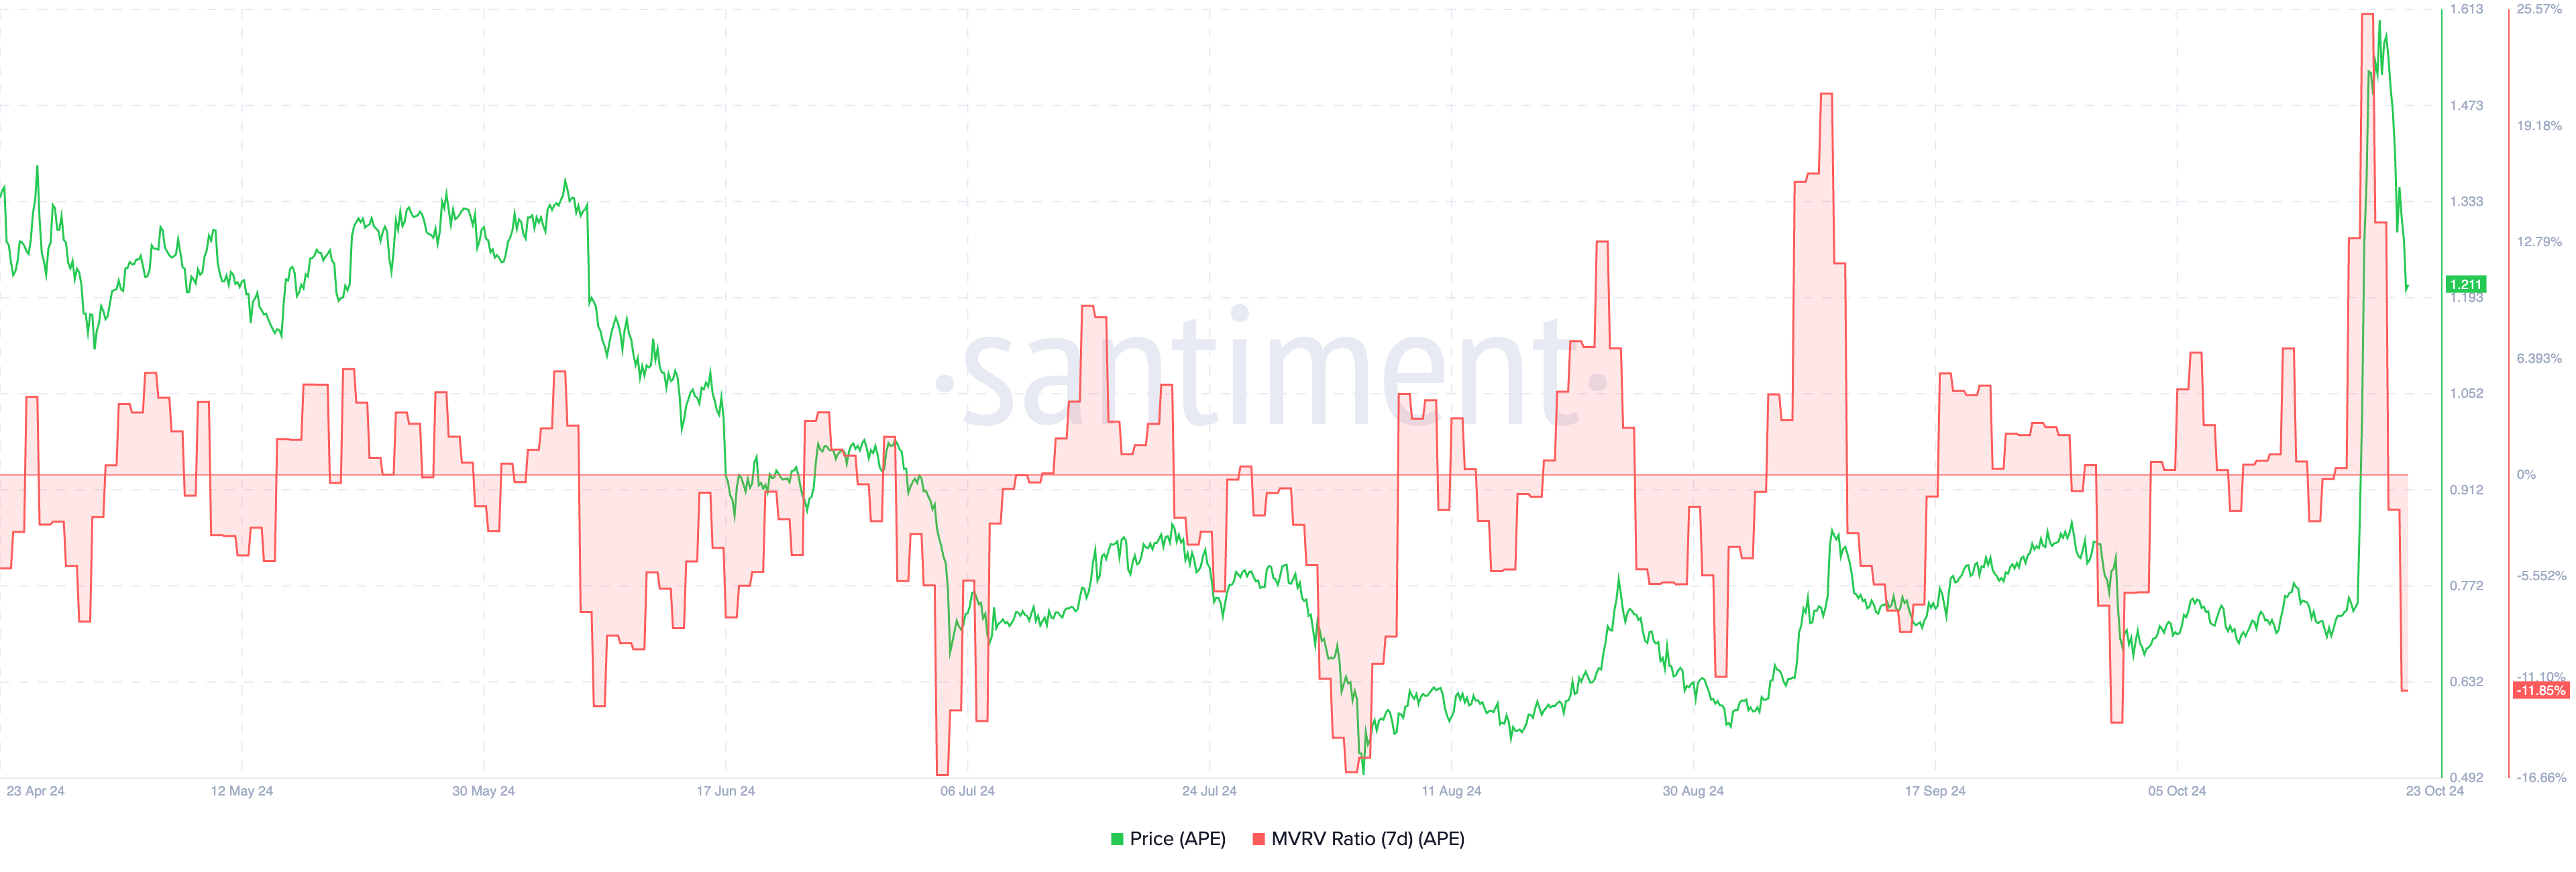
Despite the current negative 7D MVRV reading, historical data from the past six months suggests that APE tends to make strong rebounds whenever the MVRV reaches the -13% level. This implies that there is often significant buying interest around such deeply negative MVRV levels, leading to a price reversal.
However, since the current MVRV value has not yet reached that historical rebound threshold, the ongoing correction may not be over, and further downside movement is possible before any significant recovery.
ApeCoin RSI Is Now Neutral After a Huge Surge
The APE RSI is currently at 45.68, having dropped from over 90 just a few days ago following a rapid 100% price surge in just two days. That happened after the announcement of ApeChain, Yuga Labs own blockchain. The RSI (Relative Strength Index) is a momentum indicator used to gauge whether an asset is overbought or oversold.
RSI values range from 0 to 100, with levels above 70 typically indicating an overbought condition—suggesting the asset may be due for a correction. On the other hand, values below 30 indicate an oversold condition, implying potential buying opportunities.
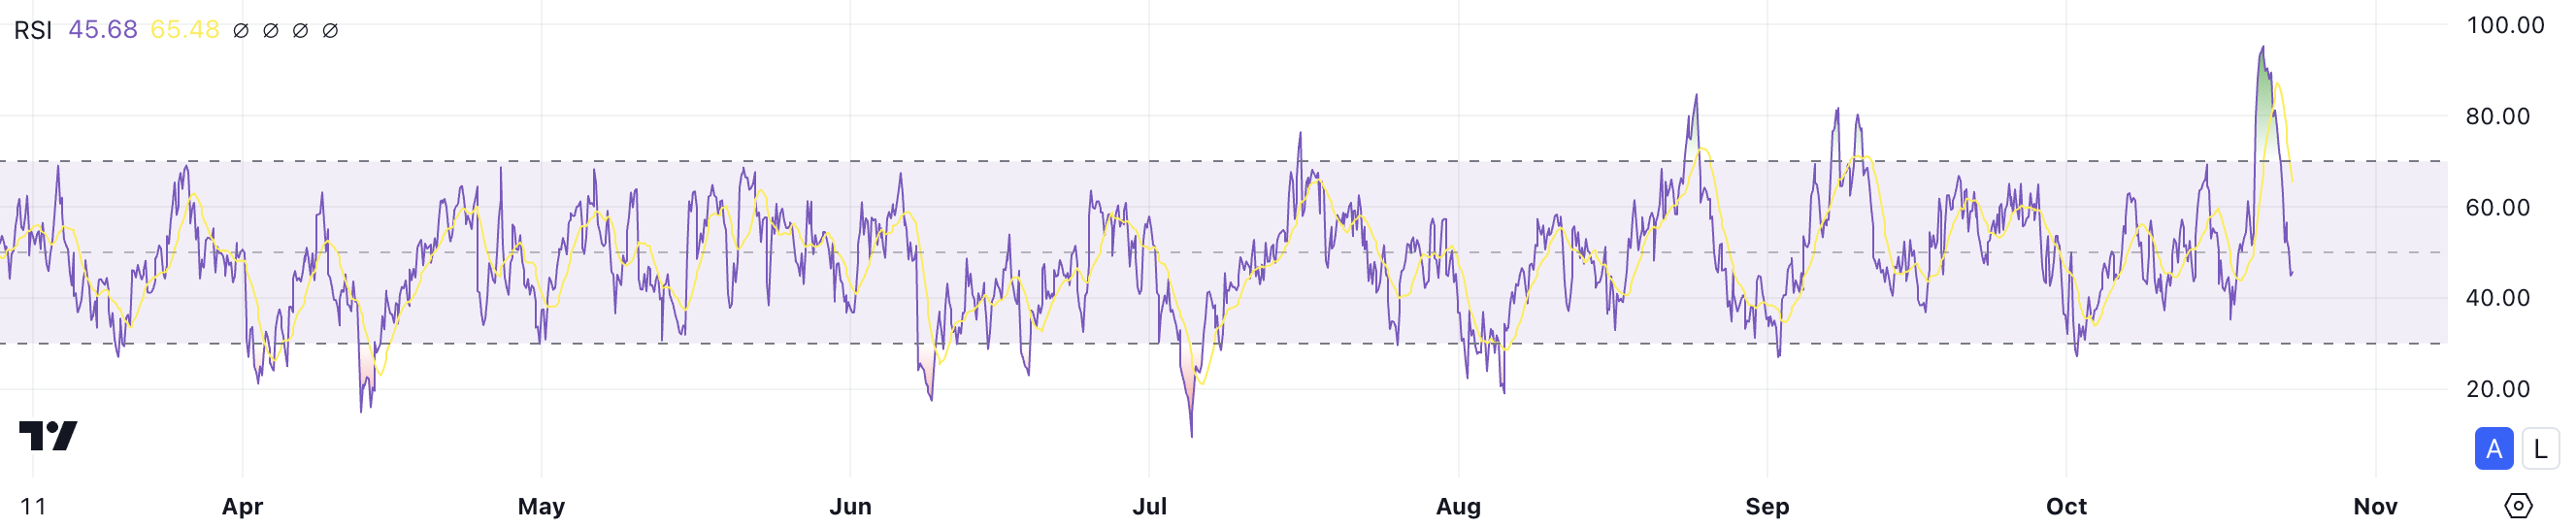
With the current RSI level at 45.68, APE is neither overbought nor oversold, suggesting a neutral momentum after its recent pump. This level indicates that the token is still in a corrective phase, with the potential for more downside movement before reaching oversold territory.
Since it has not yet dropped below the 30 mark, which would signal oversold conditions, the ongoing correction could continue further before any significant reversal occurs.
APE Price Prediction: Will It Go Below $1?
The EMA lines on the APE chart suggest a rapid change in momentum following the recent price pump. The shorter-term EMAs have sharply risen above the longer-term EMAs, indicating that bullish momentum was strong during the rapid surge.
However, with prices now pulling back to around $1.20, the narrowing gap between these EMAs suggests that the bullish momentum might be fading. The proximity of the EMAs also points towards potential consolidation or a lack of clear direction moving forward.
Read more: ApeCoin (APE): Everything You Need To Know
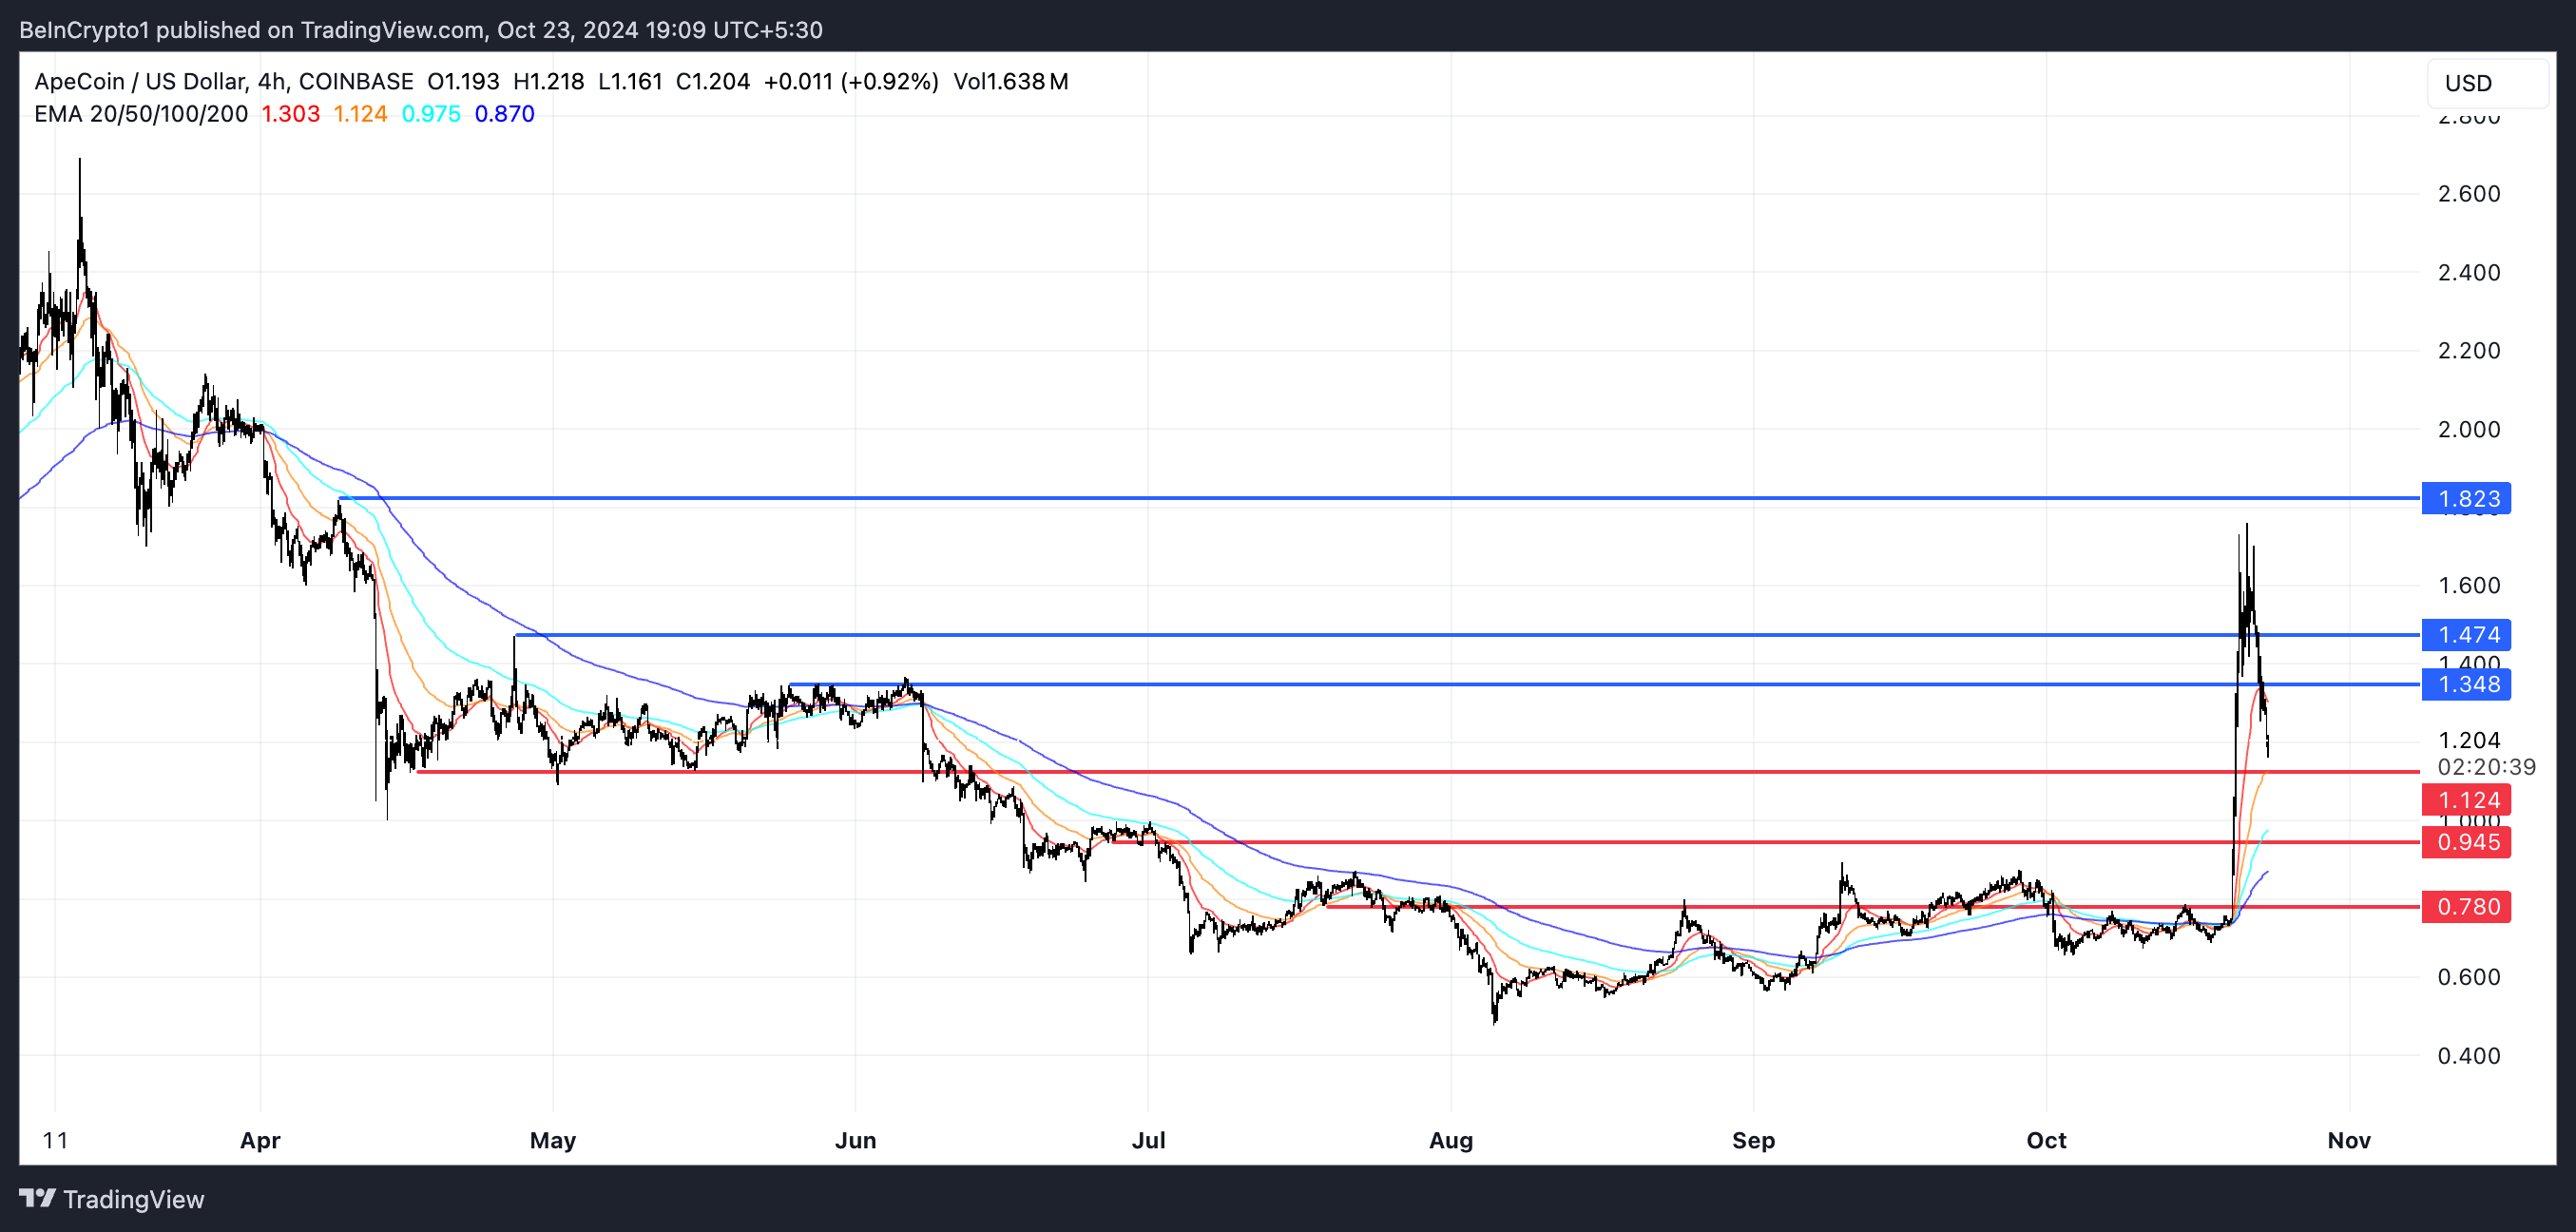
Regarding support and resistance, APE has several key levels to watch. Resistance levels are at $1.34, $1.47, and $1.82, the biggest price for ApeCoin since April. On the downside, support is marked at $1.12, $0.94, and $0.78.
If APE fails to hold the $1.12 support, further downside correction toward $0.94 or even $0.78 is possible. Conversely, if the uptrend appears again, APE price could test the $1.34 resistance and even try $1.47 after that.
Disclaimer
In line with the Trust Project guidelines, this price analysis article is for informational purposes only and should not be considered financial or investment advice. BeInCrypto is committed to accurate, unbiased reporting, but market conditions are subject to change without notice. Always conduct your own research and consult with a professional before making any financial decisions. Please note that our Terms and Conditions, Privacy Policy, and Disclaimers have been updated.