

The Solana (SOL) price failed to move above a long-term resistance level. However, it is trading inside a bullish pattern, from which a breakout is expected.
However, while the price action is bullish, short-term indicator readings do not confirm if the price will break out or not.
Solana Fails to Move Above Long-Term Resistance
The price of SOL has declined below a descending resistance line that has been in place since it reached its highest price ever in November 2021. This long-term trend suggests a bearish outlook as long as SOL continues to trade below the line.
Furthermore, the resistance line currently intersects with the significant $26 resistance level, reinforcing its importance. In April, the price of SOL was rejected at the intersection of these levels, as indicated by the red circle. It created a large bearish candlestick next week.
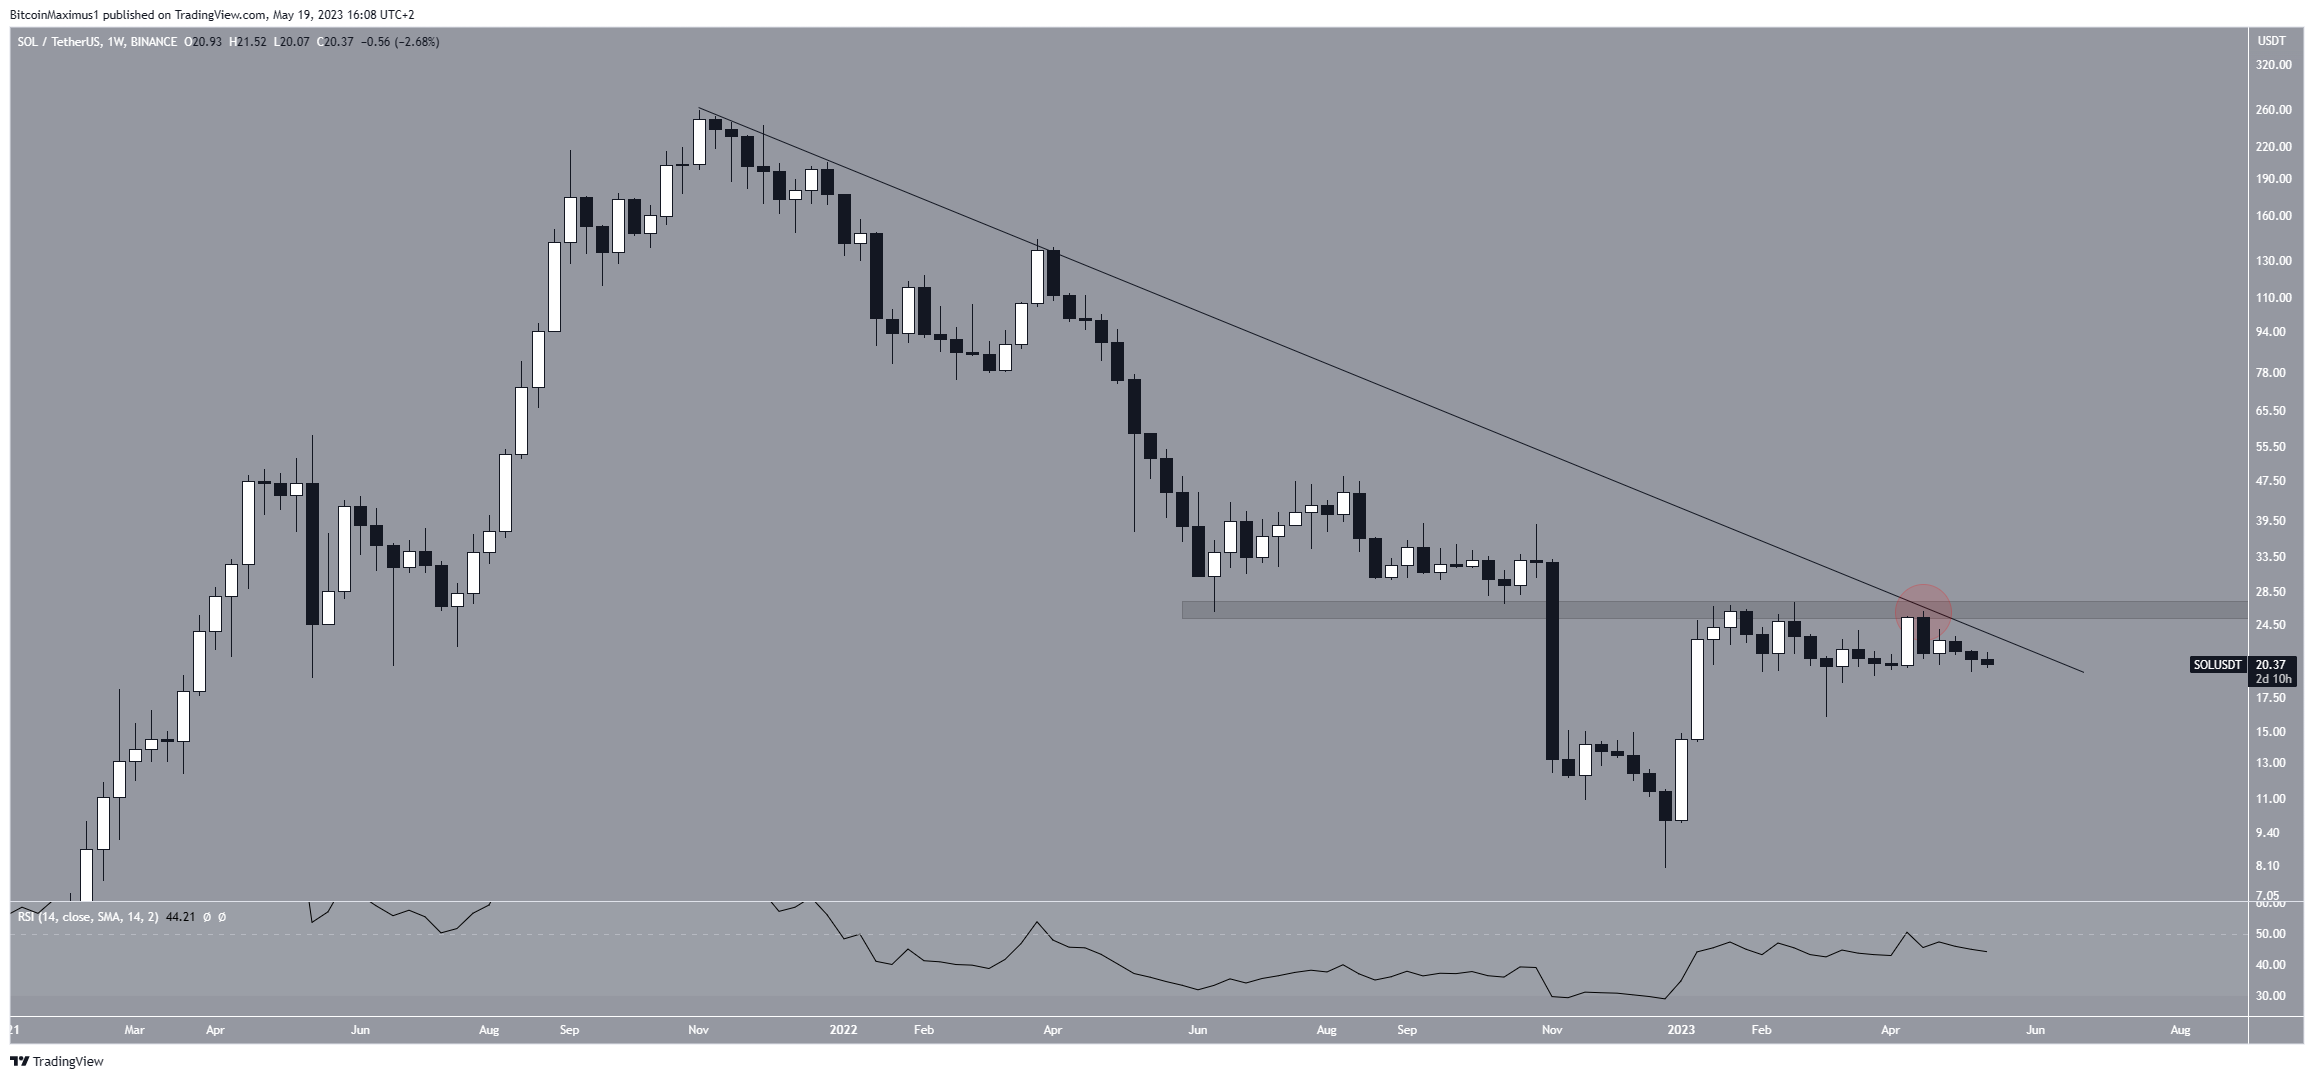
The weekly Relative Strength Index (RSI), which is a momentum indicator used by traders to assess market conditions, is providing mixed signals.
The RSI value above 50 and an upward trend indicate that the bulls still have an advantage, while values below 50 suggest the opposite. Although the RSI is currently below 50, it has been increasing since the start of the year.
SOL Price Prediction: Will Bullish Pattern Lead to Breakout?
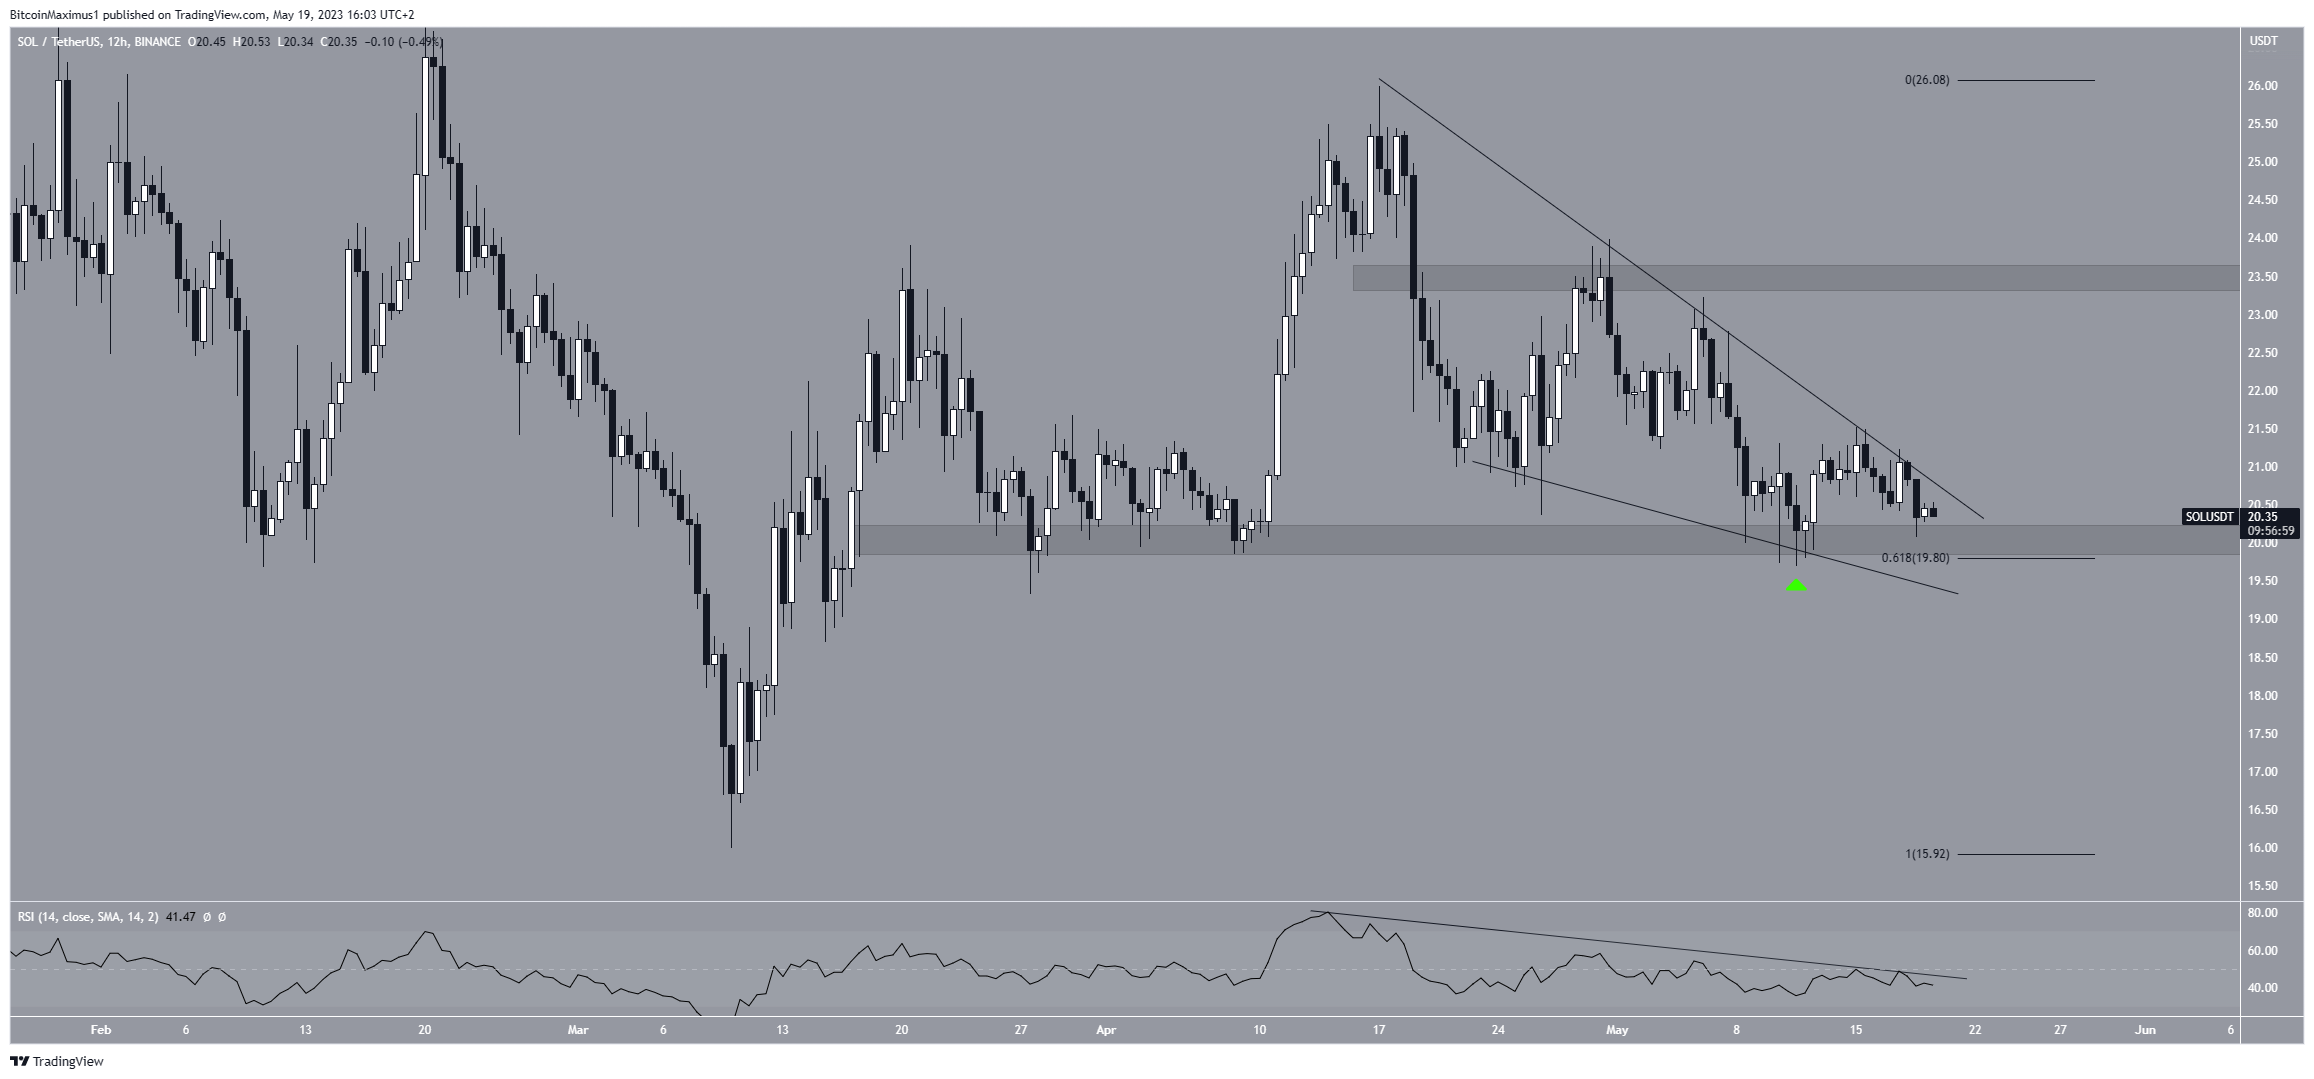
The technical analysis from the six-hour time frame shows that the SOL price has traded inside a descending wedge since April 16. The descending wedge is considered a bullish pattern. Therefore, a breakout from it is the most likely scenario.
The price bounced on May 11, validating the wedge’s support line, 0.618 Fib retracement support level, and $20 horizontal support area. Due to all these methods aligning at the same support level, their significance is increased.
So, the trend can be considered bullish as long as the SOL price trades above it. Moreover, the price may break out after bouncing in the area.
However, the price failed to break out at the first attempt and has returned to the area again.
Moreover, the RSI does not confirm the possibility of a breakout. The indicator is following a descending resistance line and is still below 50. So, it does not confirm if the price will break out.
So, whether the SOL price breaks out or down from the wedge will likely determine the future trend.
A breakout will take the price to $23.50, while a breakdown could cause a drop to $16.50.
For BeInCrypto’s latest crypto market analysis, click here.
Disclaimer
In line with the Trust Project guidelines, this price analysis article is for informational purposes only and should not be considered financial or investment advice. BeInCrypto is committed to accurate, unbiased reporting, but market conditions are subject to change without notice. Always conduct your own research and consult with a professional before making any financial decisions. Please note that our Terms and Conditions, Privacy Policy, and Disclaimers have been updated.
