

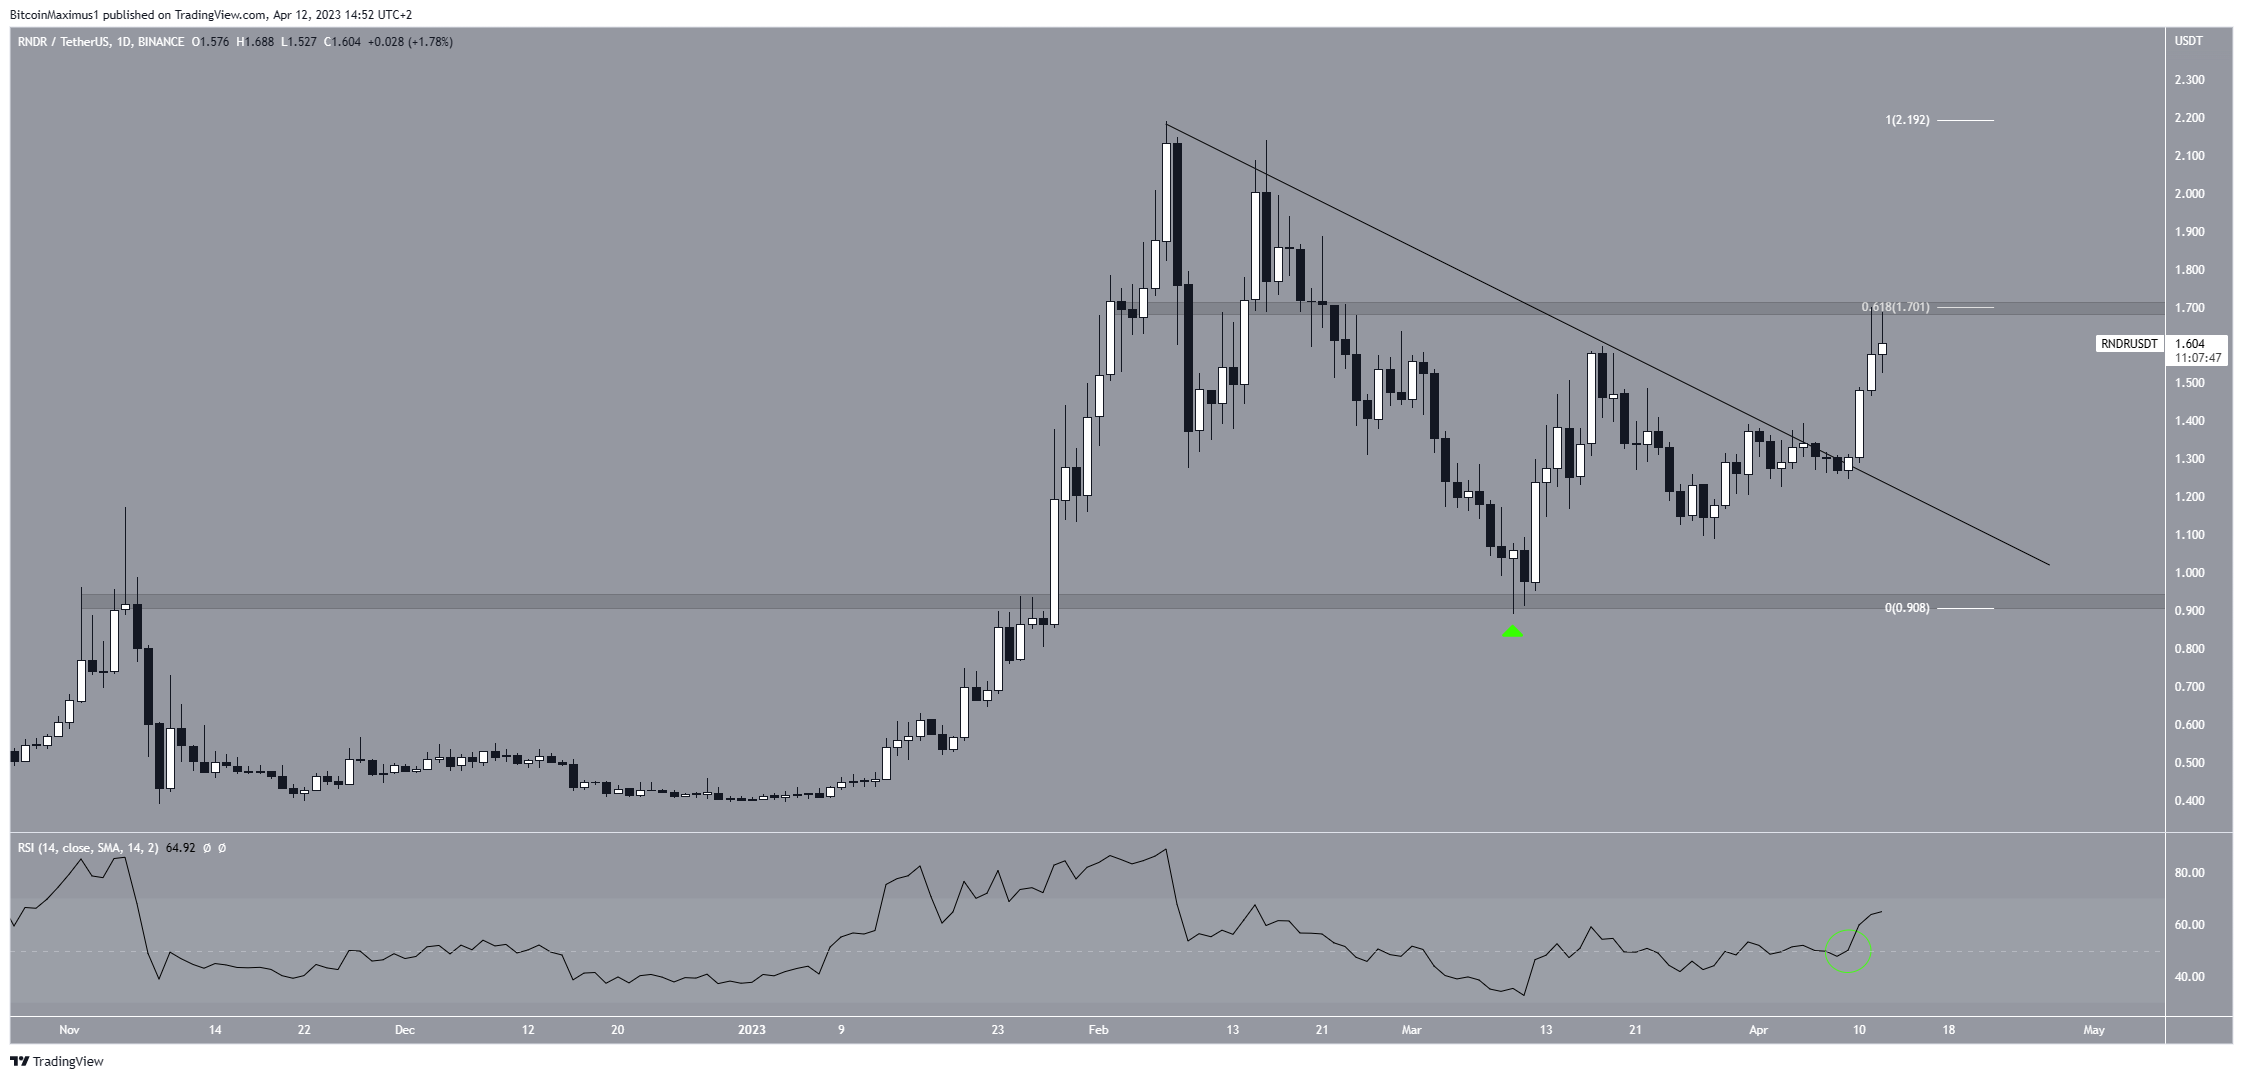
After breaking out from a descending resistance line, the Render Token (RNDR) price is attempting to clear an important horizontal resistance area.
The RNDR price has decreased under a descending resistance line since Feb. 7. The decrease led to a low of $0.89 on March 10. The RNDR price has increased since, creating a long lower wick (green icon) and validating the $0.94 horizontal area as support.
On April 9, the price broke out from the resistance line and reached a high of $1.70 two days later. The breakout was combined with an RSI movement above 50 (green line), while the high was made inside the 0.618 Fib retracement resistance level.
If the price breaks out, the next resistance would be at an average price of $2.20. However, if a rejection occurs, RNDR could decrease to the resistance line at $1.10.
Render (RNDR) Price Prediction for April: Beginning of New Increase?
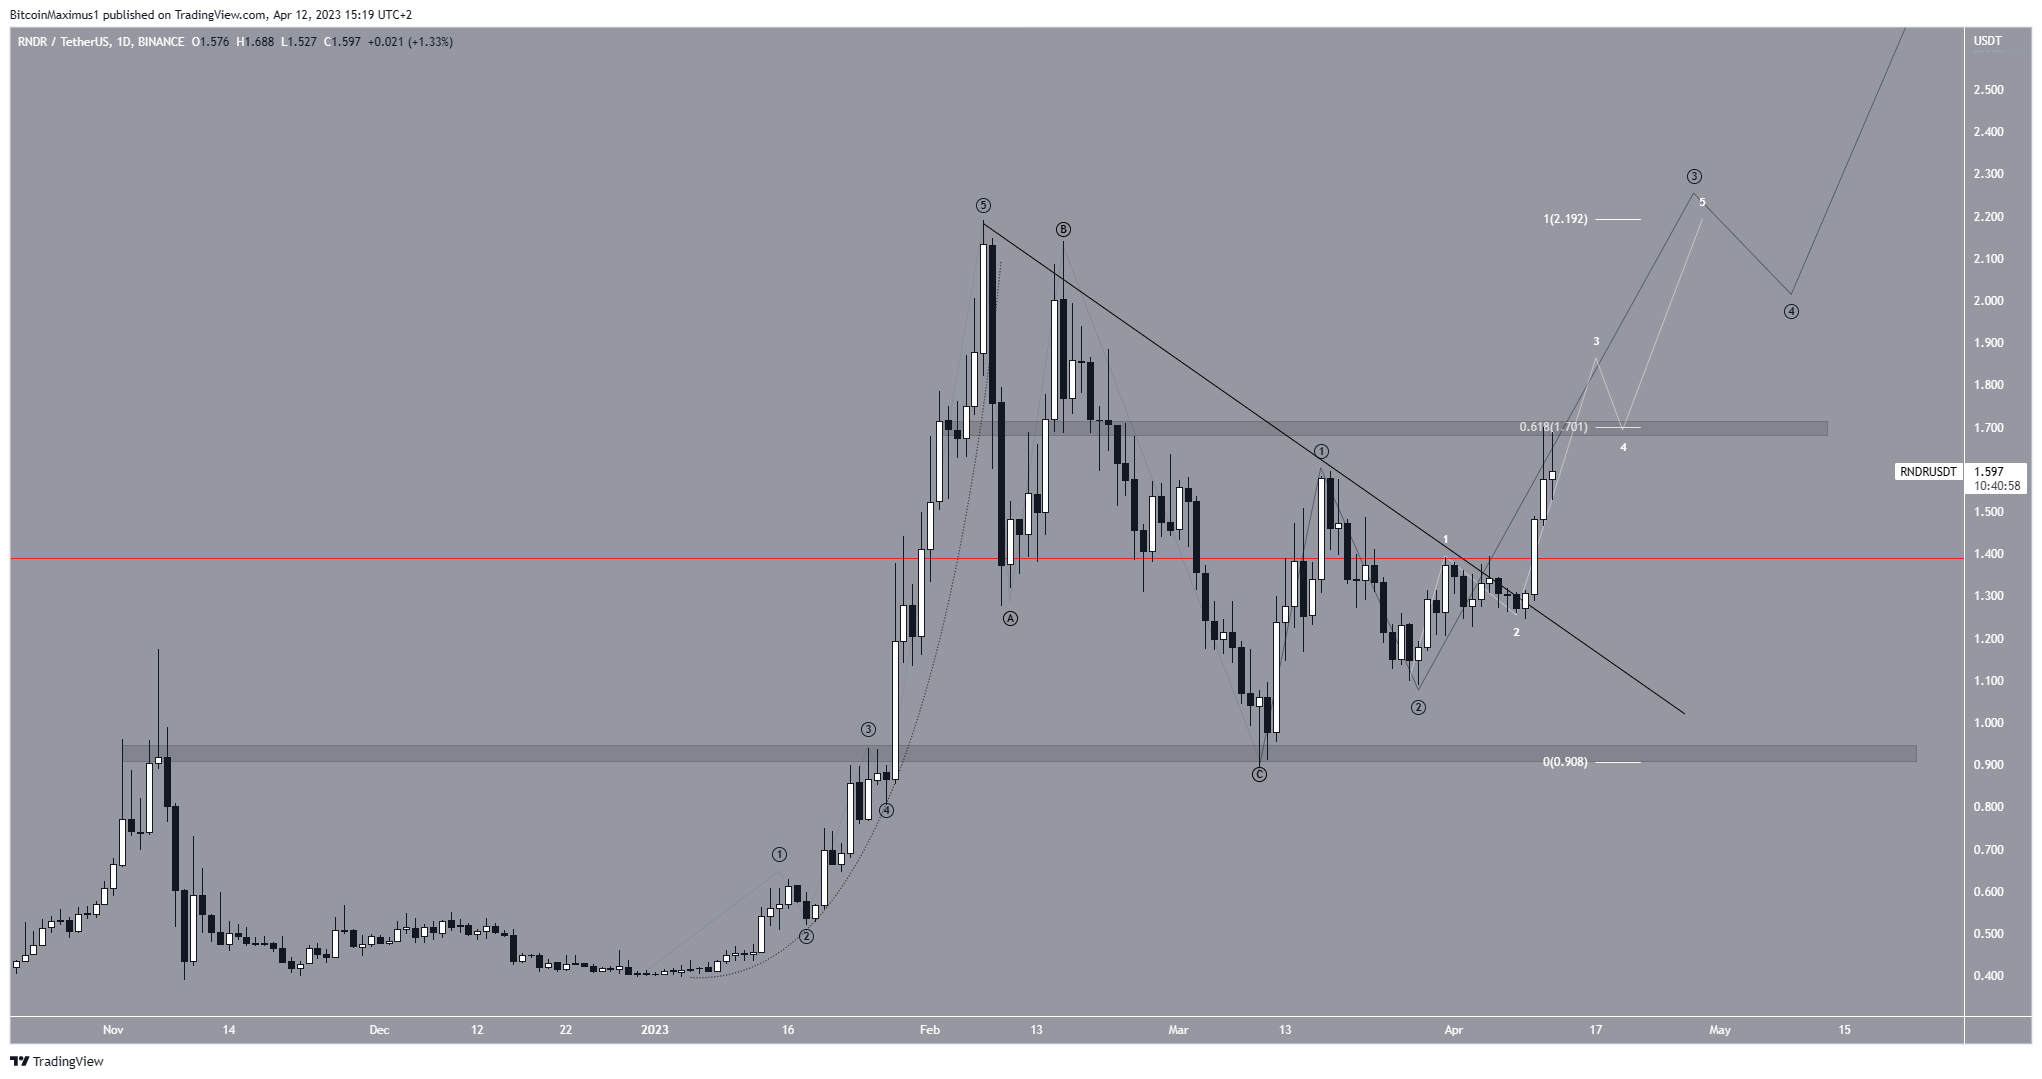
The wave count supports the continuation of the increase and reclaim of the $1.70 resistance area.
At the beginning of the year, the RNDR price completed a five-wave upward movement and an A-B-C corrective structure afterward. If so, it seems that the price has now begun a new five-wave increase (black). If so, it is currently in the third wave, which is often the sharpest of the five. Moreover, the sub-wave count is given in white, showing that the price is in sub-wave three.
If the count is correct, the RNDR price will increase and reach a new yearly high before correcting. A potential target for the top of the entire increase would be at the long-term $3.0 resistance area.
However, a decrease below the sub-wave one high (red) at $1.39 would invalidate this bullish outlook. In that case, a drop to $0.94 could follow.
To conclude, the most likely RNDR price prediction for April is an increase toward a new yearly high and potentially to $3.0. This Render Token price forecast would be rendered invalid with a drop below $1.39. In that case, RNDR could decrease to $0.92.
For BeInCrypto’s latest crypto market analysis, click here.
Disclaimer
In line with the Trust Project guidelines, this price analysis article is for informational purposes only and should not be considered financial or investment advice. BeInCrypto is committed to accurate, unbiased reporting, but market conditions are subject to change without notice. Always conduct your own research and consult with a professional before making any financial decisions. Please note that our Terms and Conditions, Privacy Policy, and Disclaimers have been updated.
