The Polygon (MATIC) price has confirmed an essential long-term level at $0.77 as support. The trend is considered bullish as long as it is trading above it.
On Jan. 7, it was reported that Polygon received a $3 million grant in order to migrate from the Solana to the Polygon blockchain. The grant will reportedly be used to expand the team and kick-start an incubator.
The same day, Mastercard announced that it was partnering with the MATIC network to provide a platform for new music artists. The partnership will begin with the Mastercard Artist Accelerator Program that is due to begin in spring 2023.
The partnership will begin with the Mastercard Artist Accelerator Program, which will begin in spring 2023.
Finally, there will be a Polygon hard fork on Jan. 17, which will improve the user and developer experience. The fork will try to tackle gas spikes and address chain reorganizations.
Polygon Price Reclaims Long-Term Level
The MATIC price broke out above the $0.77 horizontal area in July 2022. Afterward, it validated it as support twice (green icons), in Sept. and Dec., respectively.
After the second bounce, the price initiated an upward movement that is still ongoing.
The weekly RSI is showing an interesting bullish sign. The indicator broke out from its bearish divergence trend line (black line) and is now in the process of moving above 50. Since the divergence trend line was the catalyst for the entire downward movement since the all-time high, breaking out above is an extremely positive sign.
Furthermore, there is no significant overhead resistance until $1.38. This could allow for a quick and sharp increase toward the area.
As a result, the trend is considered bullish unless the Polygon price reaches a weekly close below $0.77.

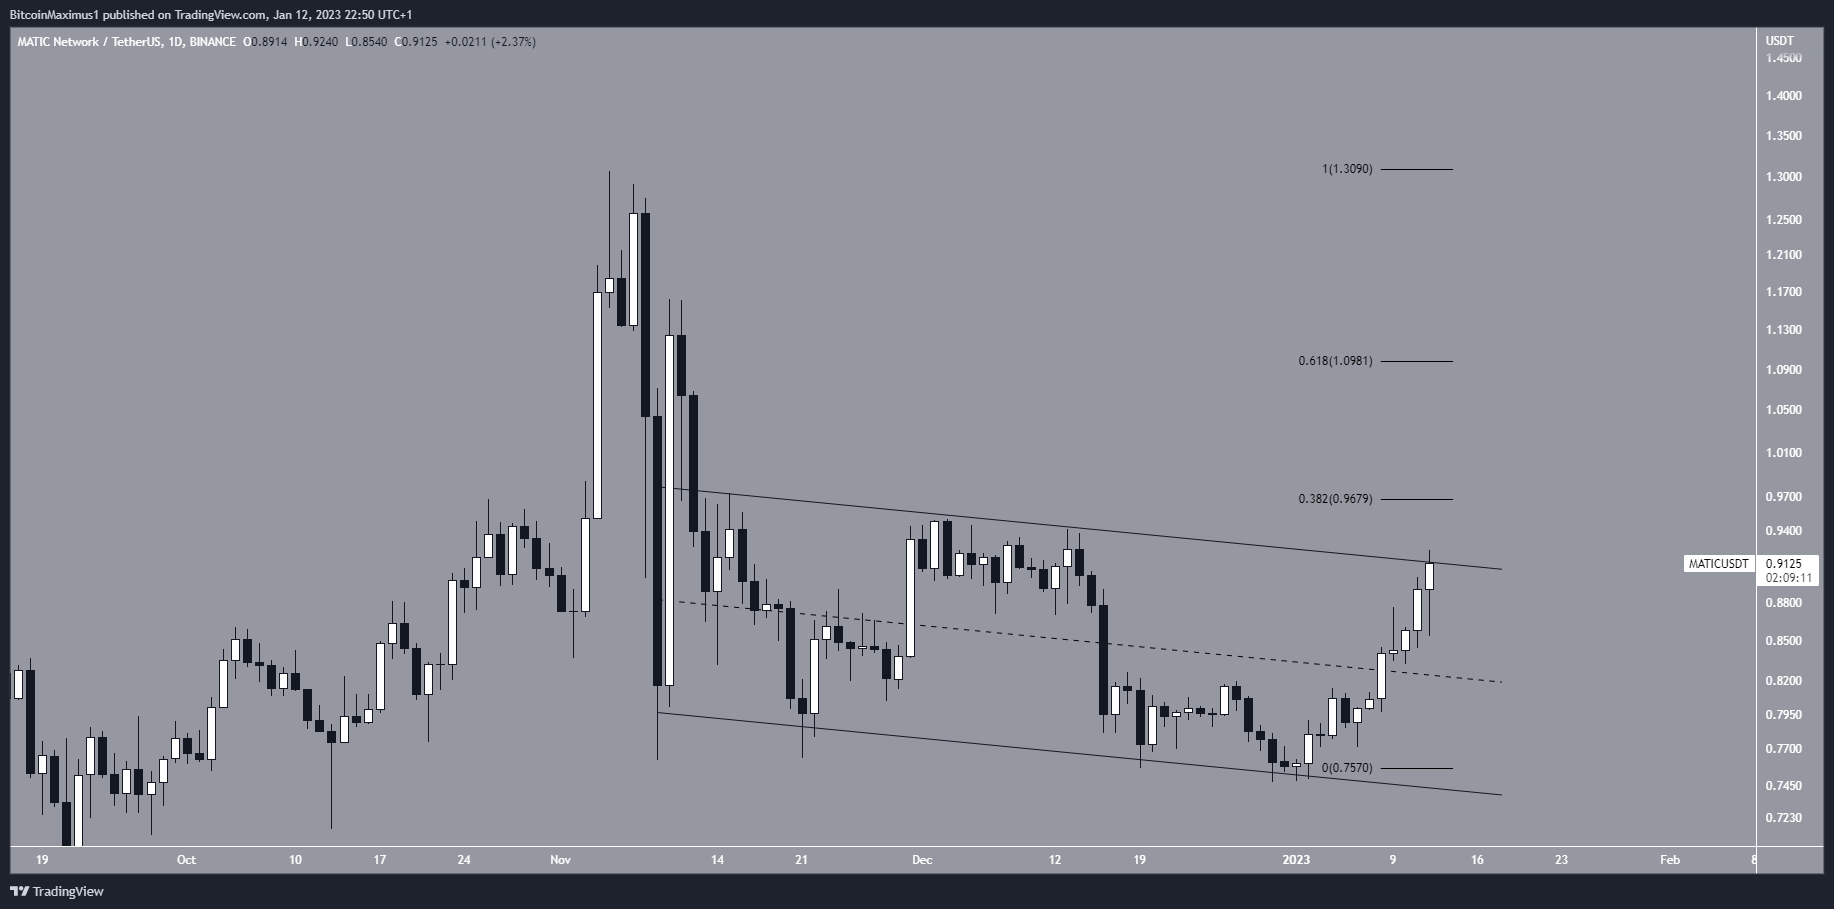
The shorter-term daily time frame is in alignment with the bullish reading. The Polygon price is in the process of breaking out from a descending parallel channel. Such channels usually contain corrective movements. Therefore, since the channel is facing downward, the most likely outlook is a breakout from it.
If the MATIC token price breaks out, there would be Fib resistances at $0.97 and $1.10 before the main resistance area at $1.38.
On the other hand, a drop below the channel’s midline could indicate that new lows are expected. Since the midline coincides with the $0.77 support area, a weekly close below it would be a bearish long-term development.

MATIC/BTC Could be Facing a Rough Ride
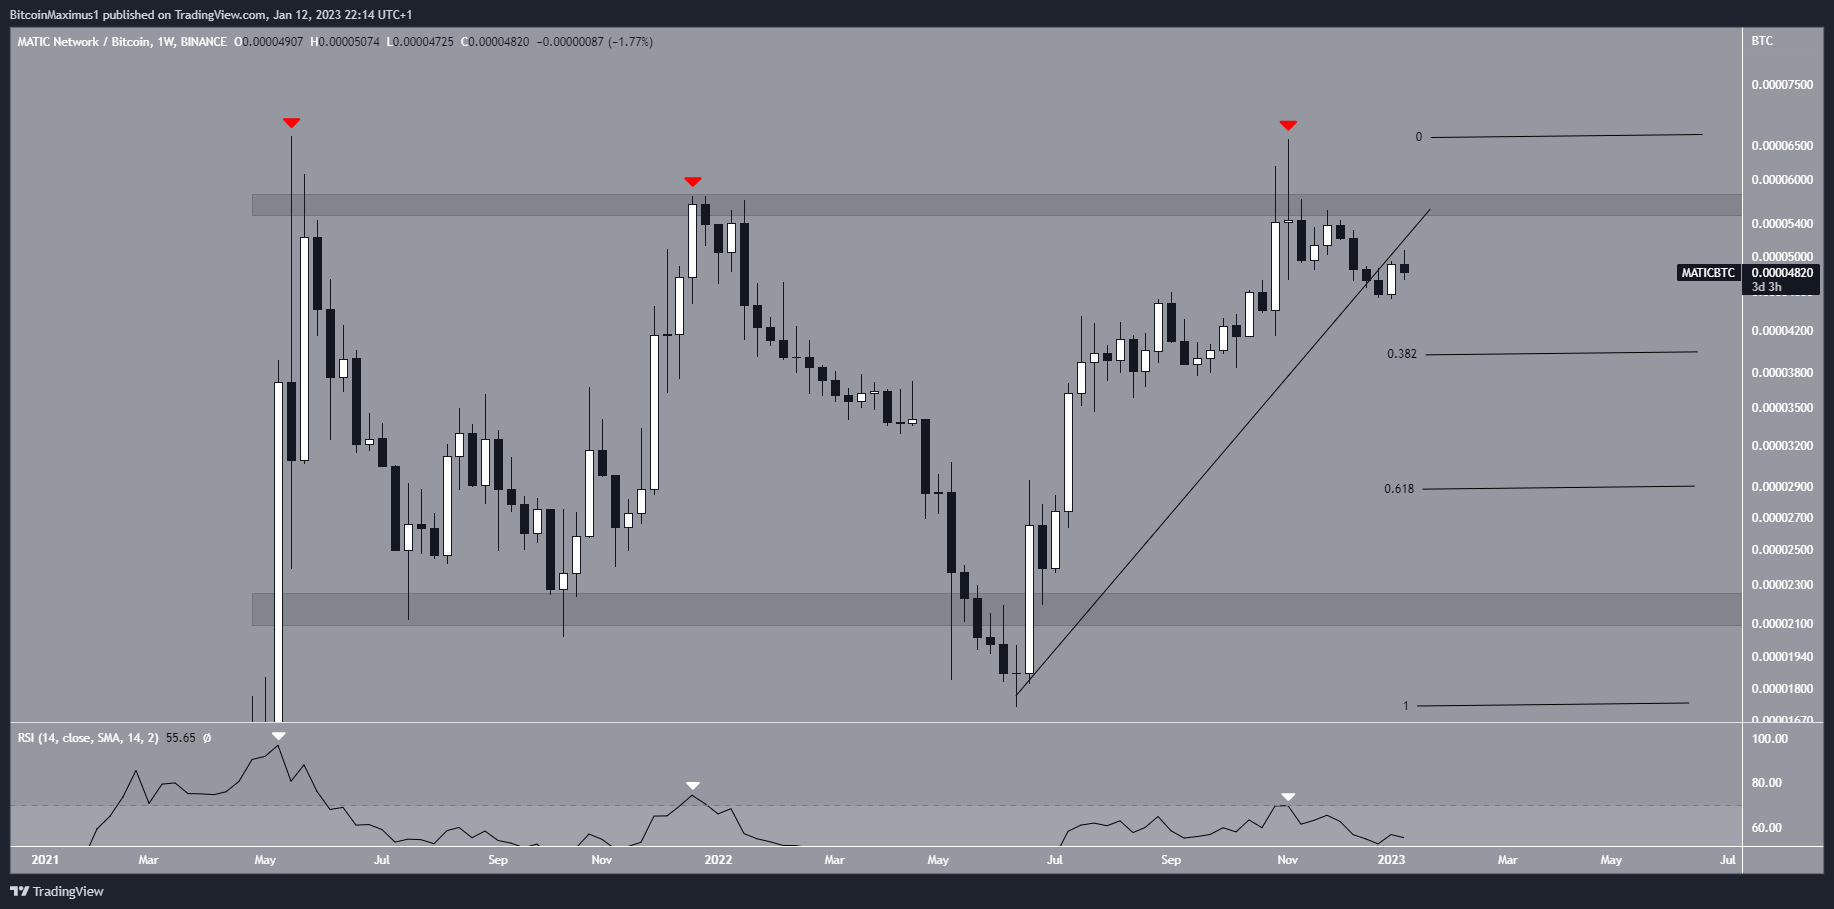
The MATIC/BTC price has fallen since Nov. 2022, when it barely failed to reach a new all-time high, culminating at 66,060 Satoshis. The decrease confirmed a triple top pattern (red icons) and the 57,000 Satoshi resistance area. The triple top is considered a bearish pattern.
Shortly afterward, the MATIC price broke down from an ascending support line, further supporting the possibility that a top has been reached.
Moreover, technical indicators support the downward movement. This can be seen in the weekly RSI, which has created three lower highs (white icons) during the triple top pattern.
If the downward movement continues, there is Fib support at 40,000 and 29,000 Satoshis. However, the main support area is at 23,000 Satoshis.

To conclude, while the readings for the MATIC/USDT pair are bullish, those for the MATIC/BTC pair are bearish. A close below $0.77 would be required for the former to turn bearish, while one above 57,000 Satoshis for the latter to turn bullish.
For BeInCrypto’s latest crypto market analysis, click here.
Disclaimer
In line with the Trust Project guidelines, this price analysis article is for informational purposes only and should not be considered financial or investment advice. BeInCrypto is committed to accurate, unbiased reporting, but market conditions are subject to change without notice. Always conduct your own research and consult with a professional before making any financial decisions. Please note that our Terms and Conditions, Privacy Policy, and Disclaimers have been updated.


