Enjin Coin (ENJ) could be nearing the bottom of its short-term correction, after which the breakout that began in Jan could continue.
ENJ has been falling since reaching an all-time high price of $4.84 on Nov 25. So far, the downward movement has led to a low of $1.15 on Feb 24.
The weekly chart shows that the price could be trading inside a very long-term ascending parallel channel. Such channels usually contain corrective movements. Therefore, an eventual breakout from it would be expected.
Currently, the price is trading very close to the bottom of the channel. In addition to this, both the RSI and MACD have generated significant hidden bullish divergences (green lines).
Therefore, it is possible that the price is close to a reversal.
ENJ breaks out
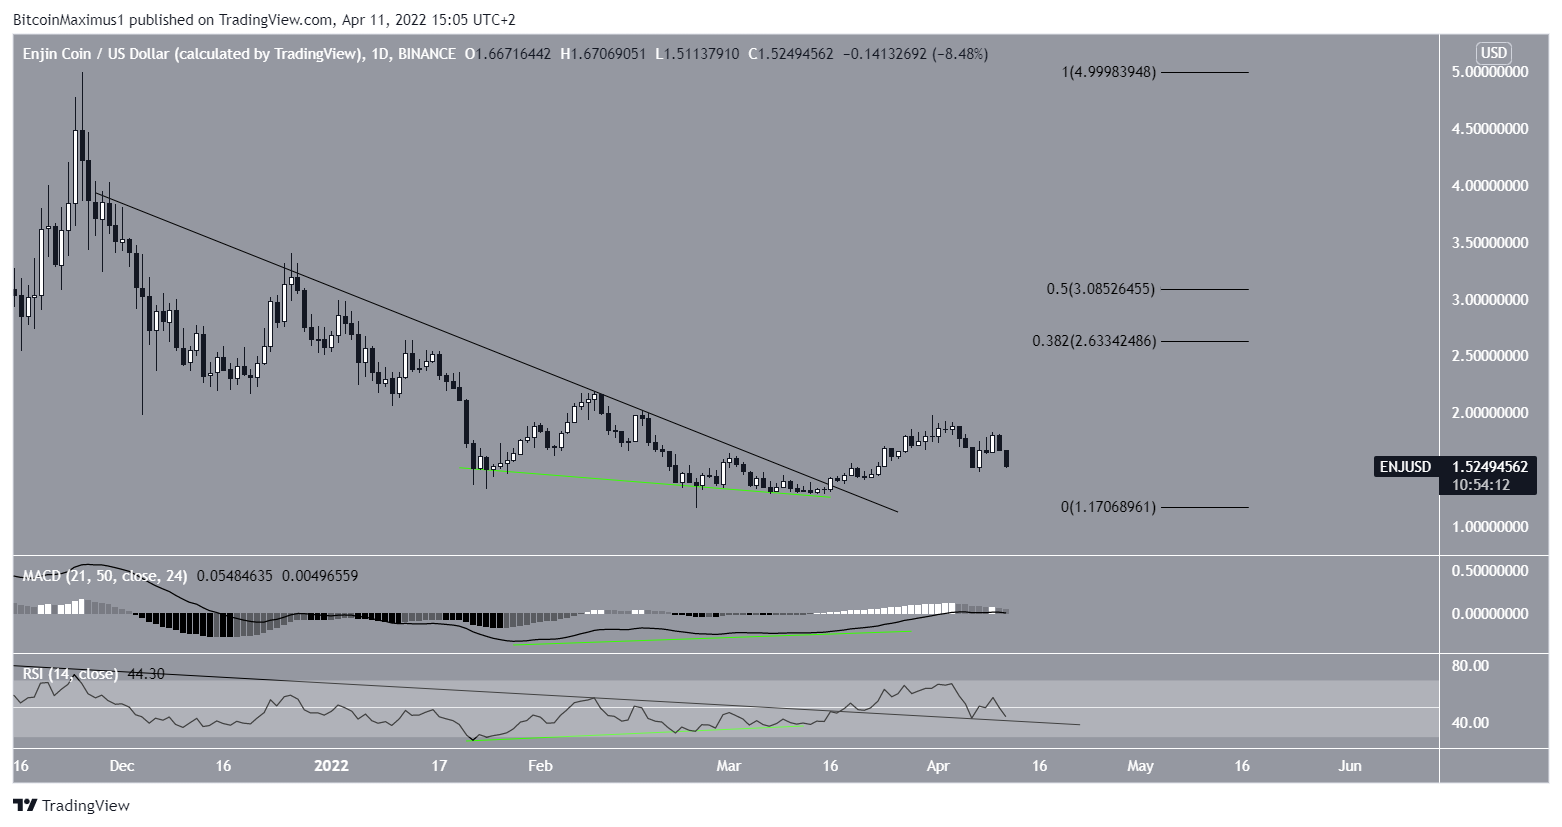
The daily chart shows that ENJ has broken out from a descending resistance line, after both the RSI and MACD generated significant bullish divergences (green lines).
Furthermore, the RSI also broke out from a descending resistance line at the same time.
However, while this breakout was expected to lead to a significant upward movement, the price broke down instead. It did so prior to reaching even the 0.382 Fib retracement resistance level.
ENJ is currently approaching its Jan 24 lows once more.
Short-term ENJ movement
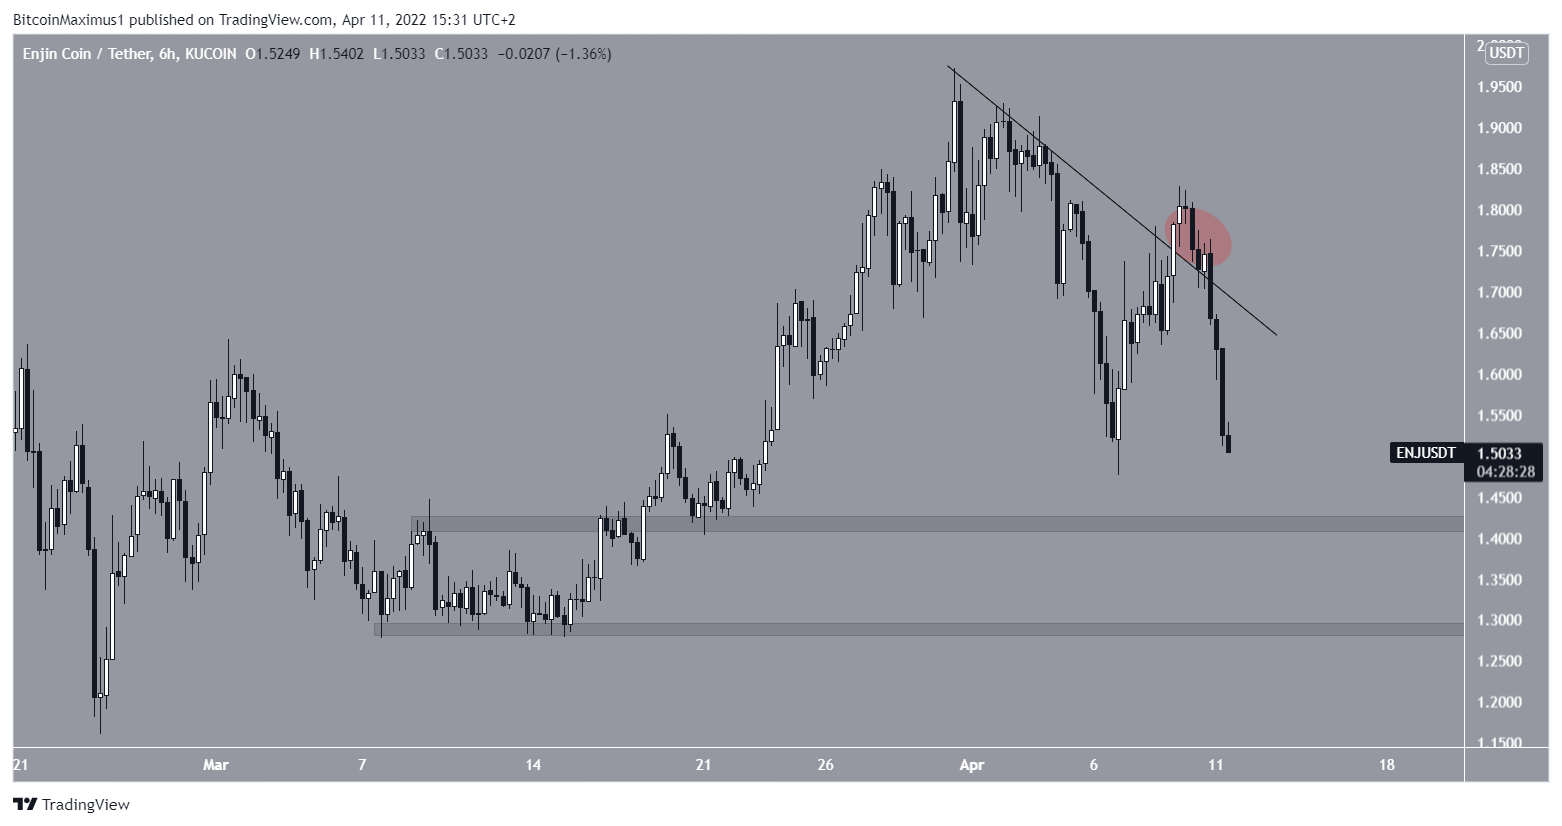
Cryptocurrency trader @eliz883 tweeted a chart of ENJ, stating that a potential retest could be taking place.
However, since the tweet, the price failed to hold on above the previous descending resistance line and broke down instead. As a result, the short-term breakout (red circle) is now considered a deviation.
The main support areas are at $1.42 and $1.28.
Therefore, it is crucial that ENJ creates a higher low above these levels if the upward movement since Jan is expected to continue.
Wave count analysis
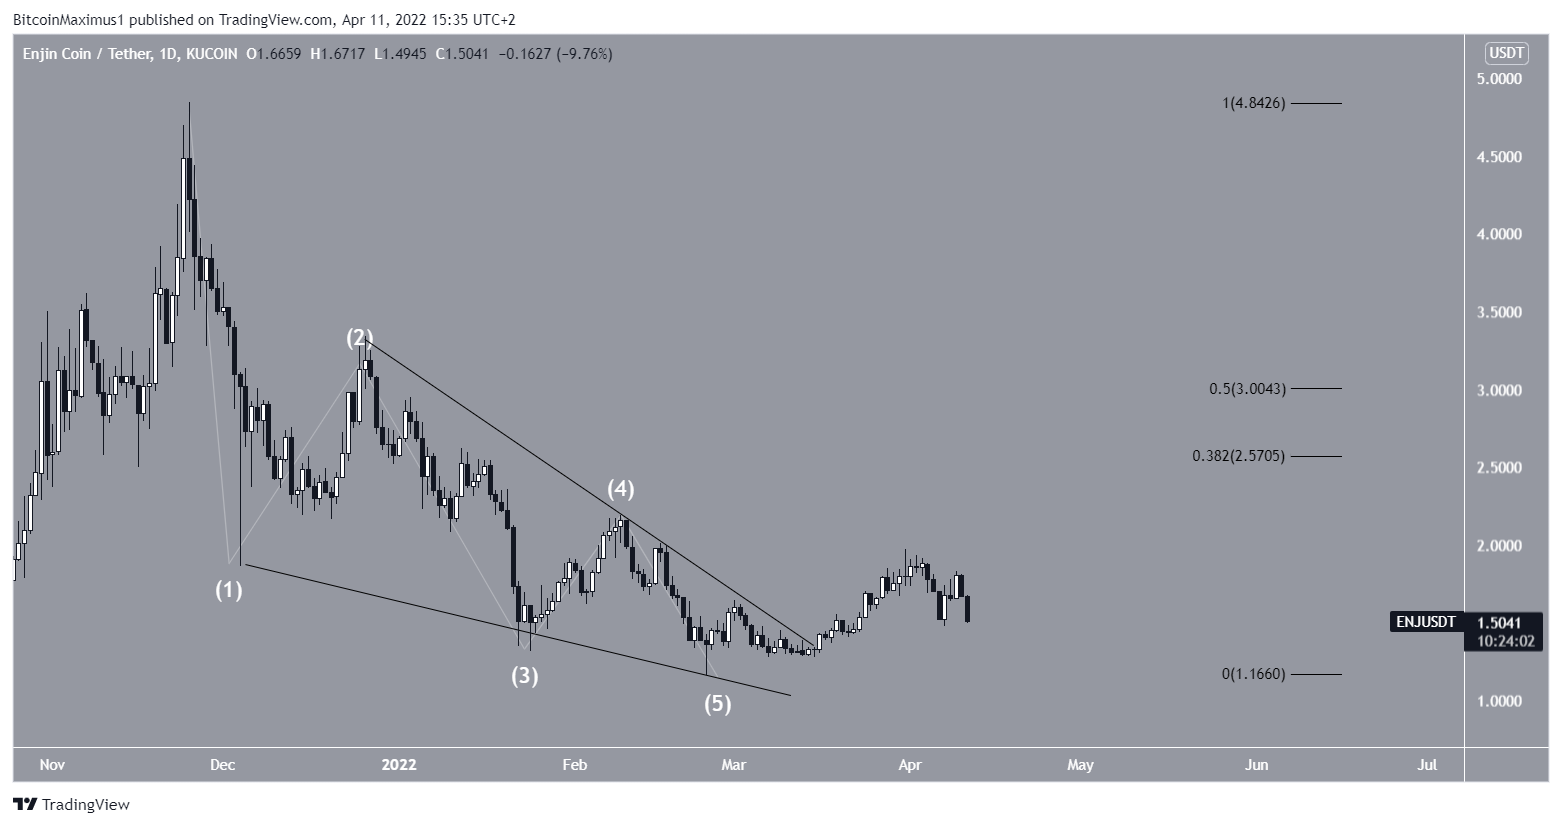
The decrease since the Nov all-time high is likely a five-wave downward movement, which developed into a diagonal. The ensuing breakout was a sign that the correction is complete.
However, diagonals are usually retraced completely in a swift fashion. Contrary to this, the price failed to even reach the 0.382 Fib retracement resistance level after breaking out.
Therefore, it is likely that the breakout is not yet complete.
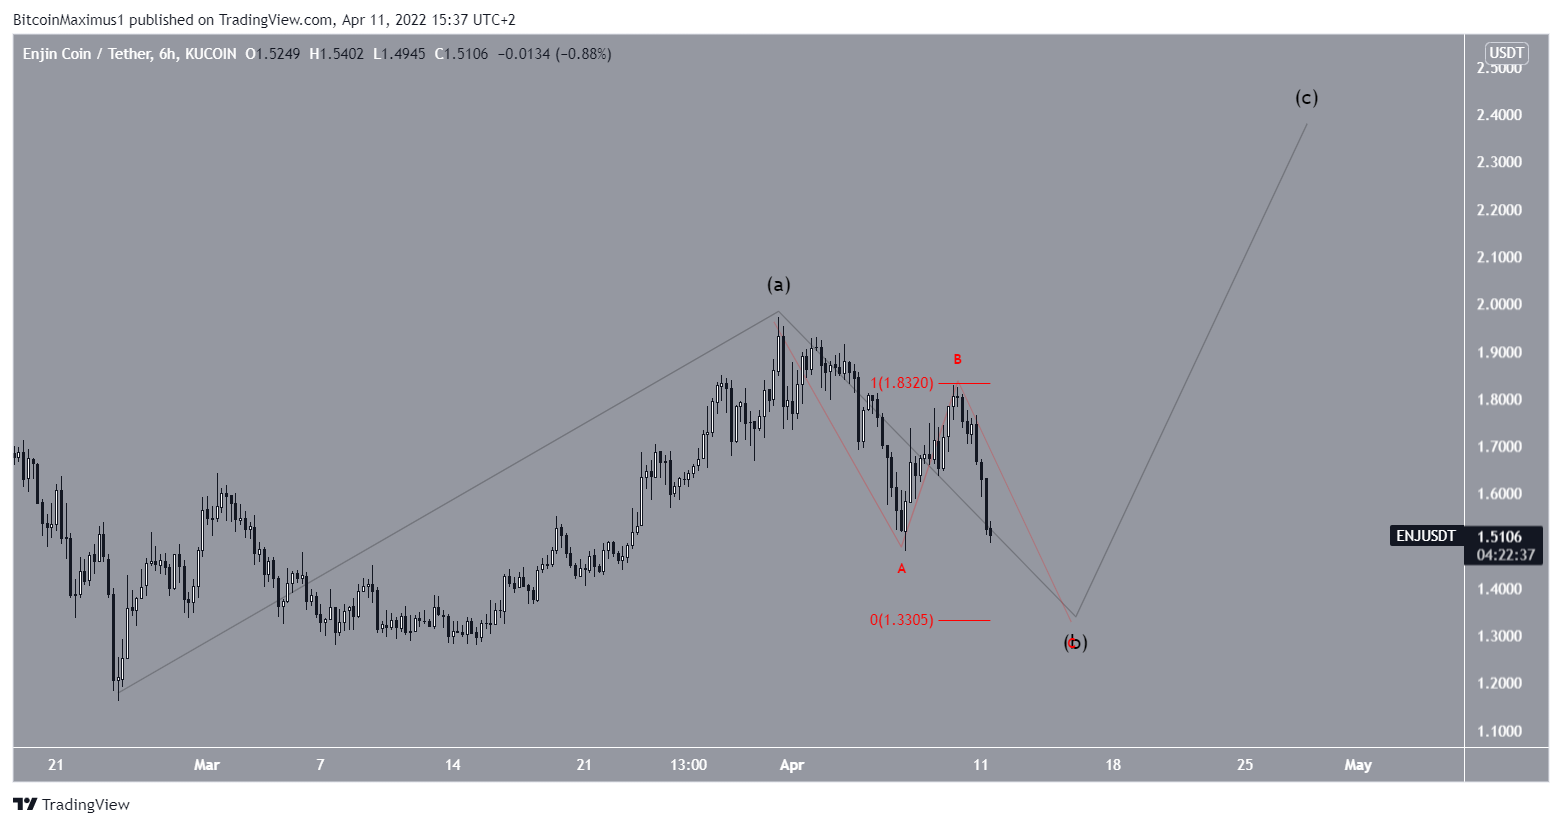
In this case, the short-term movement suggests that ENJ is in the B wave of an A-B-C corrective structure (black). The sub-wave count is given in red.
A potential level for the completion of the correction is at $1.33. This would give sub-waves A:C a 1:1 ratio.
Afterward, an upward movement that takes the price above $2 would be expected.
For Be[in]Crypto’s latest Bitcoin (BTC) analysis, click here
Disclaimer
In line with the Trust Project guidelines, this price analysis article is for informational purposes only and should not be considered financial or investment advice. BeInCrypto is committed to accurate, unbiased reporting, but market conditions are subject to change without notice. Always conduct your own research and consult with a professional before making any financial decisions. Please note that our Terms and Conditions, Privacy Policy, and Disclaimers have been updated.


