
ZORA has been one of the fastest-rising new tokens in the past week, jumping nearly 80% in just seven days to reach a high of $0.14. Much of this ZORA price surge has been driven by a sharp rise in activity on its NFT minting platform, which has been attracting new creators and collectors.
This growth in protocol use has coincided with large holders steadily adding to their positions, even as the price climbed, a sign of conviction buying rather than short-term speculation. At the time of writing, ZORA’s price is consolidating near $0.12, and the key question is whether this pause signals a trend reversal or simply a breather before another attempt at new highs.
Whales Accumulate Through the 80% Rally
On-chain data from Nansen shows that over the same seven-day period where ZORA price surged 80%, exchange whales and high-profile wallets continued to accumulate.
This is notable because accumulation during rapid price appreciation often signals confidence in further upside; most whales tend to take profits into strength, not add exposure unless they are very sure about the rally continuing.
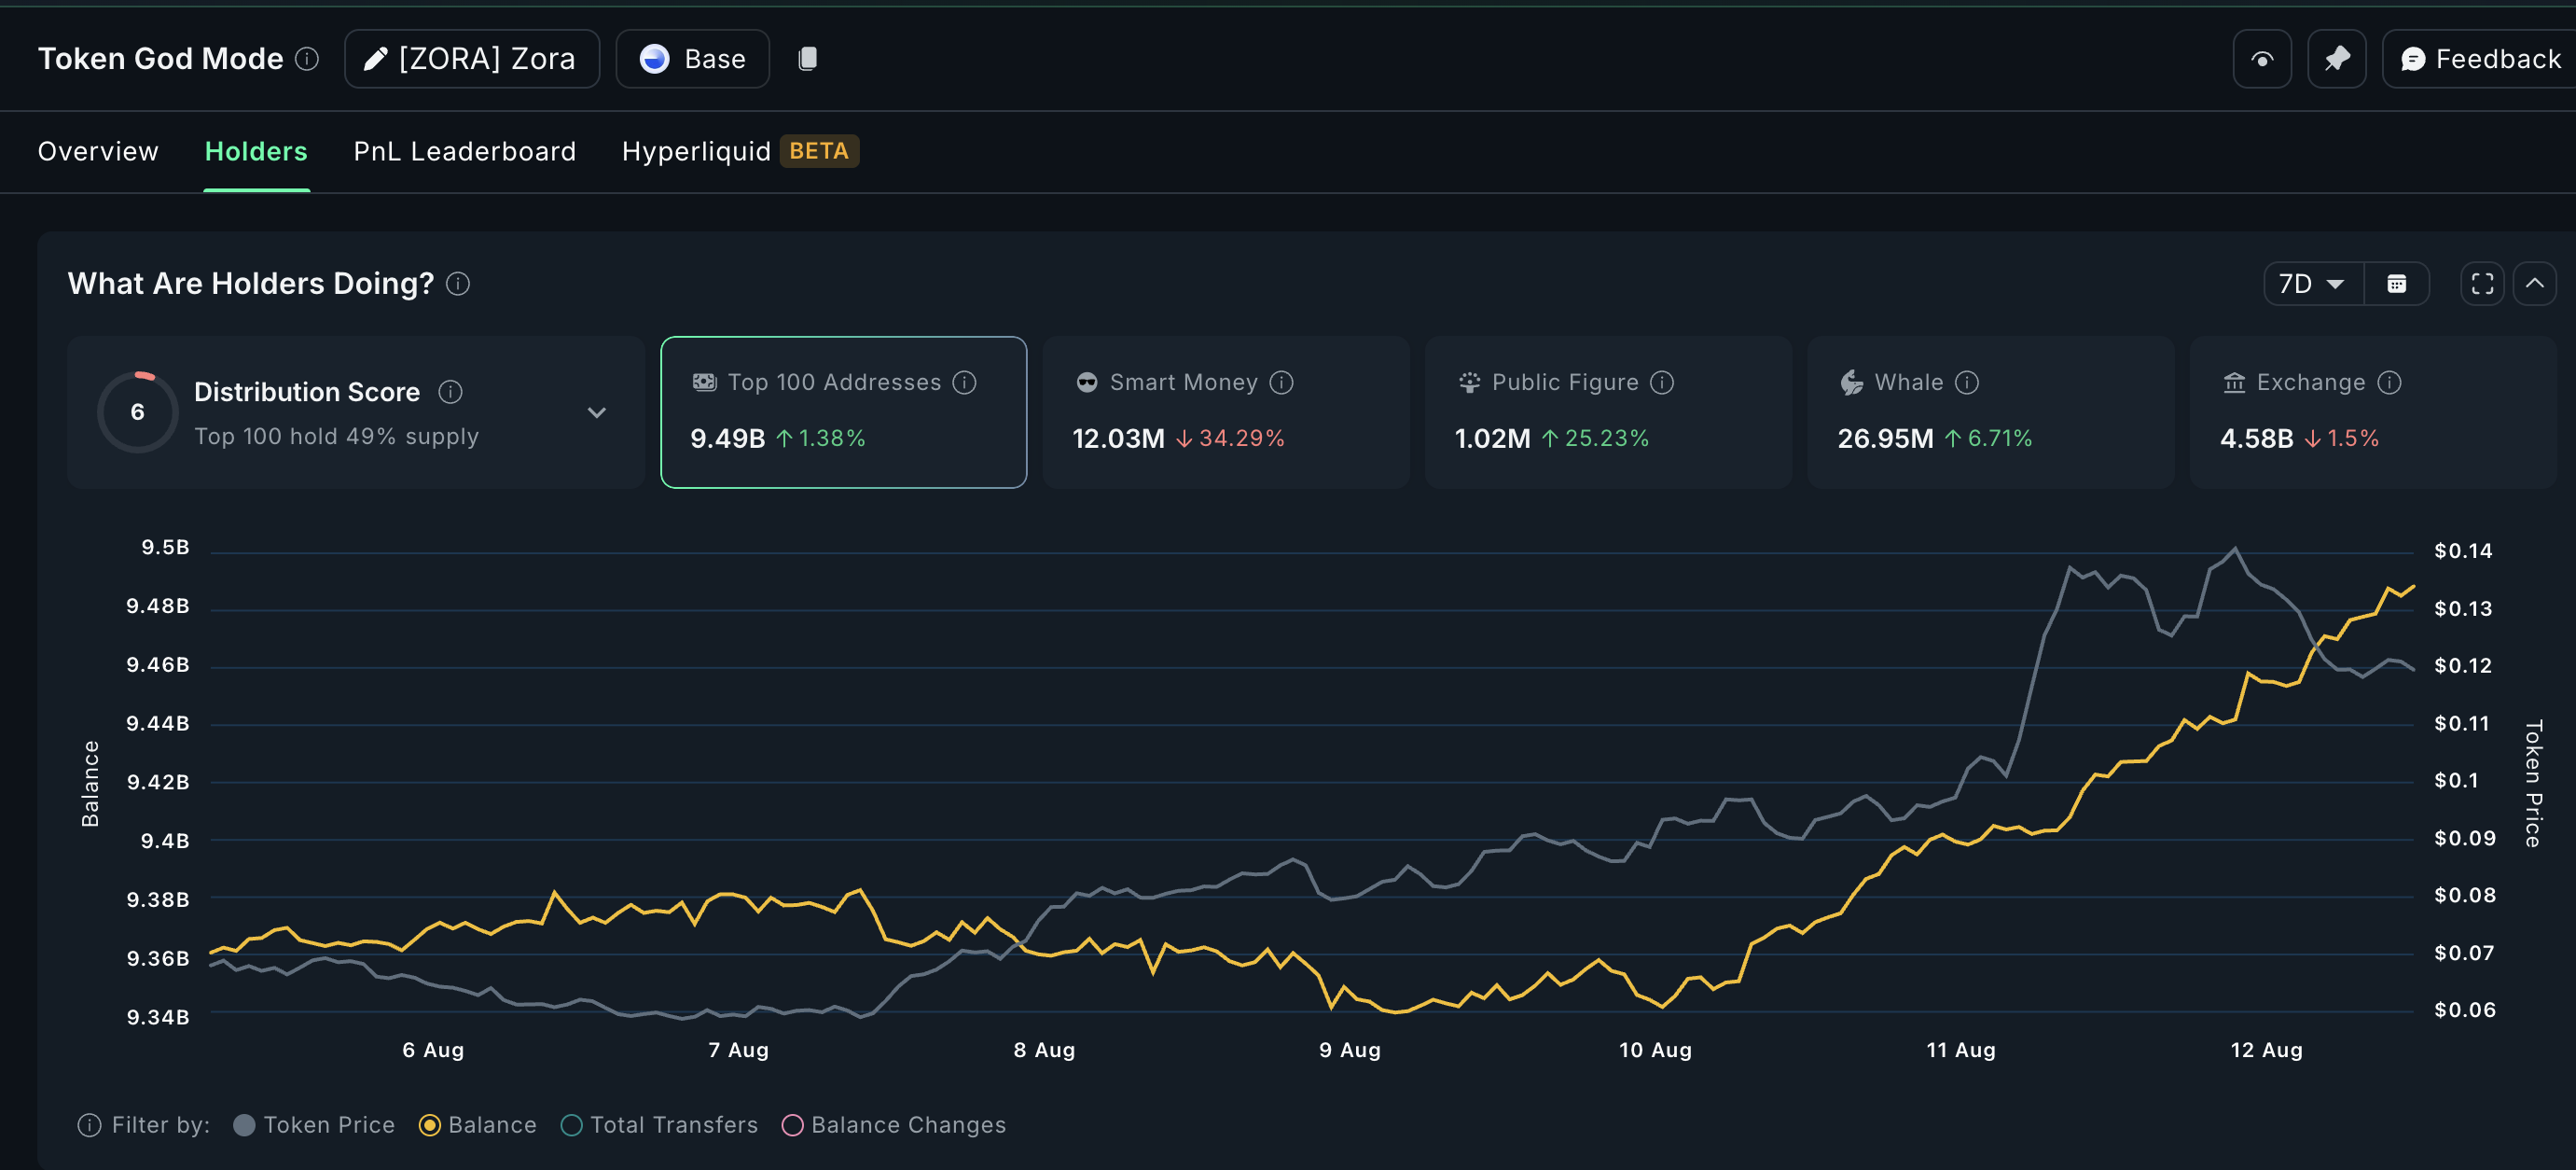
Exchange balances for Zora have also fallen over the week, meaning fewer tokens are available to sell on the open market. Over the past seven days, 69.75 million ZORA tokens have left exchanges.
The only group bucking this trend is “smart money,” tagged addresses known for precise market timing, which have reduced holdings by 6.28 million. That kind of outflow from the most tactical wallets could explain why the rally has paused, but the broader holding pattern among whales suggests the uptrend still has strong support.
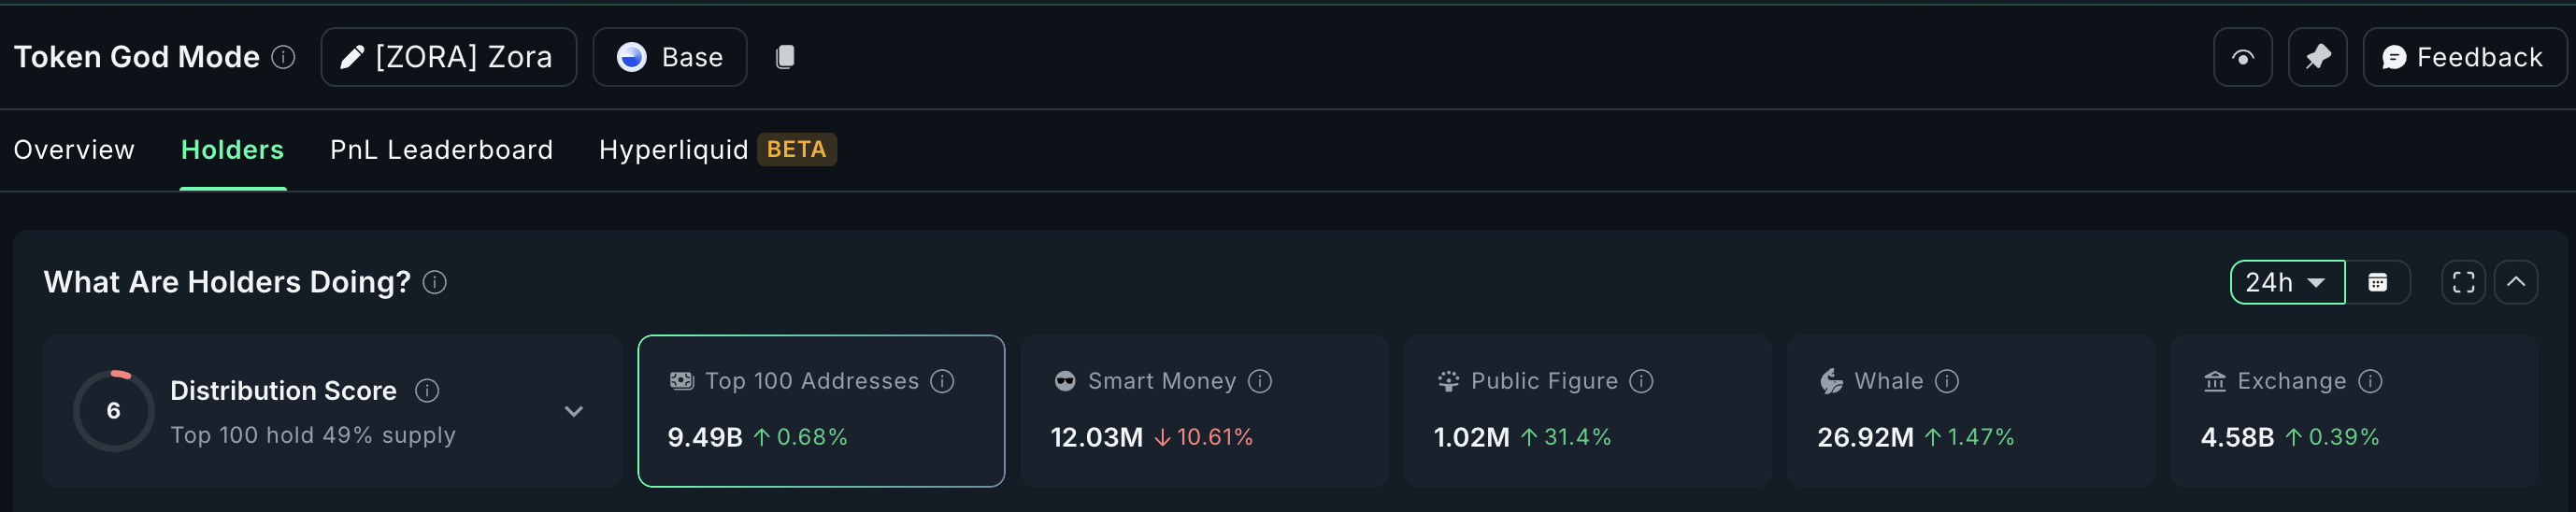
And the most supportive argument in favor of ZORA price consolidation is the 24-hour accumulation trend. Despite the dip, whales have continued the shopping spree.
For token TA and market updates: Want more token insights like this? Sign up for Editor Harsh Notariya’s Daily Crypto Newsletter here.
Hidden Bullish Divergence Signals Trend Still Alive
Looking at Zora’s 4-hour chart (rather than daily) is essential here because the token only launched a few months ago, leaving limited historical data. On this shorter timeframe, the Relative Strength Index (RSI) has formed a lower low while price has made a higher low; a hidden bullish divergence.
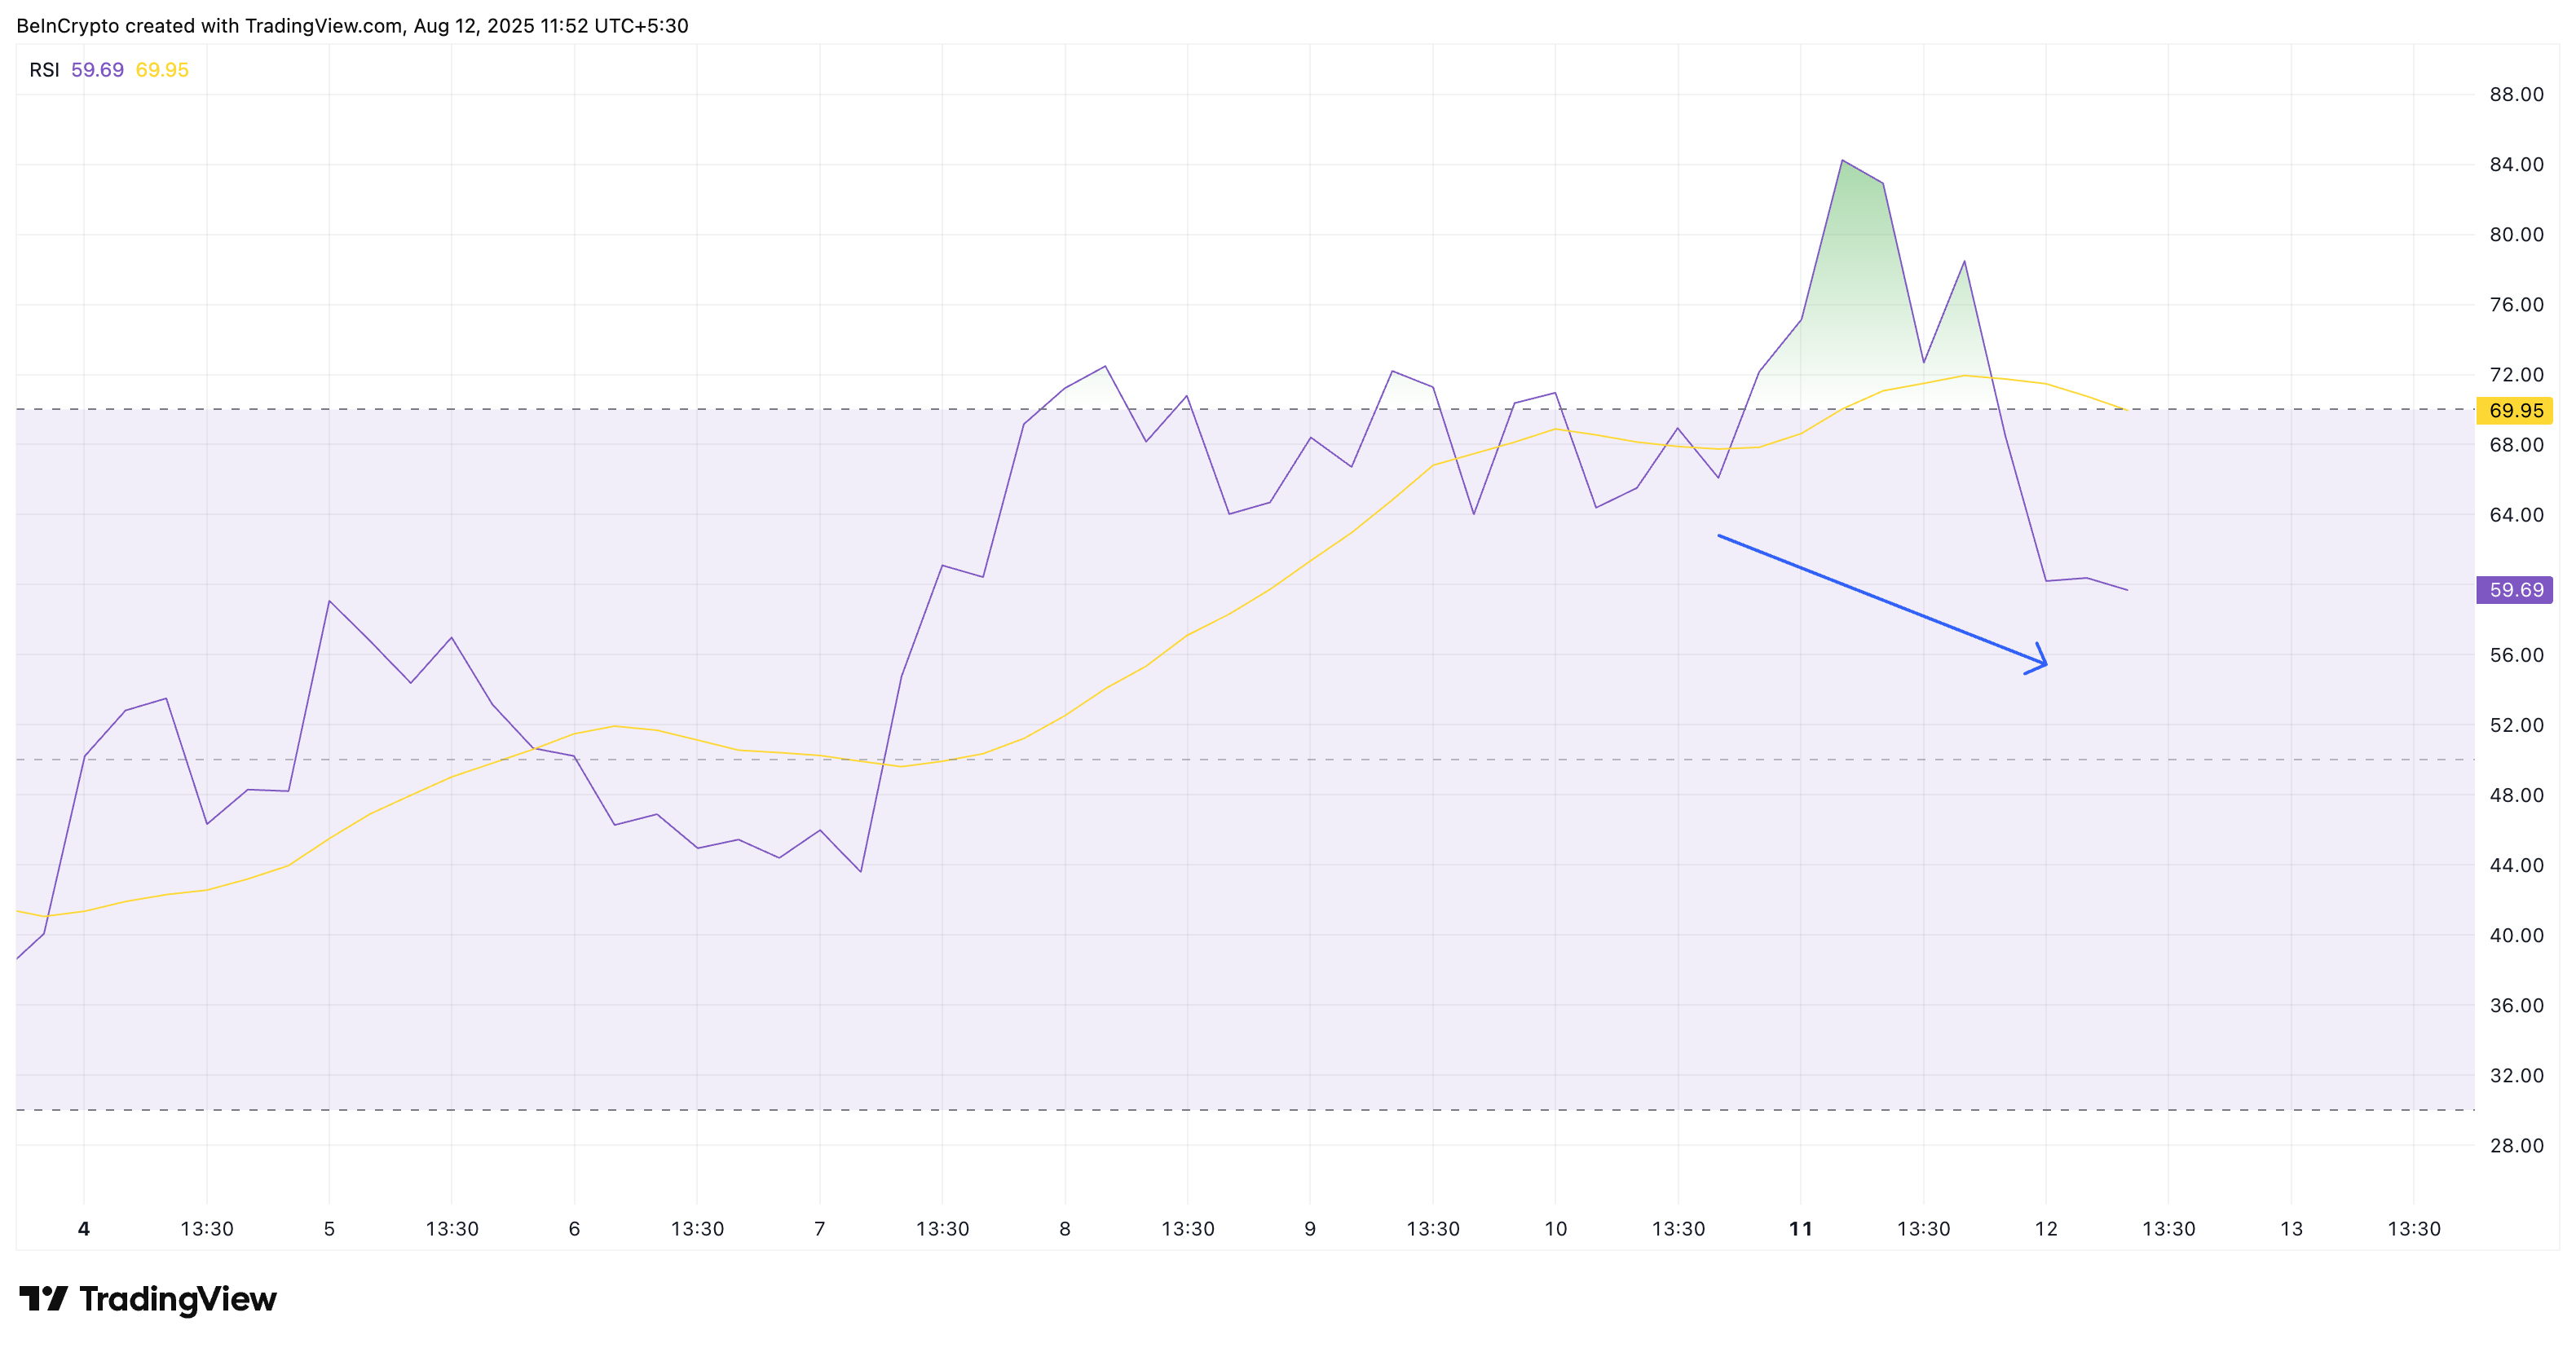
This pattern often occurs in the middle of a trend, during quick pullbacks, indicating momentum has cooled but the underlying structure remains bullish.
The Relative Strength Index (RSI) is a momentum indicator that measures how fast and how much the price of a coin is moving.
In practical terms, the market is resetting without breaking its uptrend, which aligns with the accumulation trends seen on-chain.
Key Levels That Decide The Next ZORA Price Level
Zora remains inside an ascending broadening wedge, typically a bearish reversal setup. The upper boundary near $0.148 remains the key short-term target. Another test of this level could open the way for a continuation move, but a decisive break below $0.11 support would shift the bias toward a deeper correction.
While the structure remains bearish, on a shorter timeframe — specifically, the 4-hour timeframe — the pattern hints at consolidation rather than a breakdown.
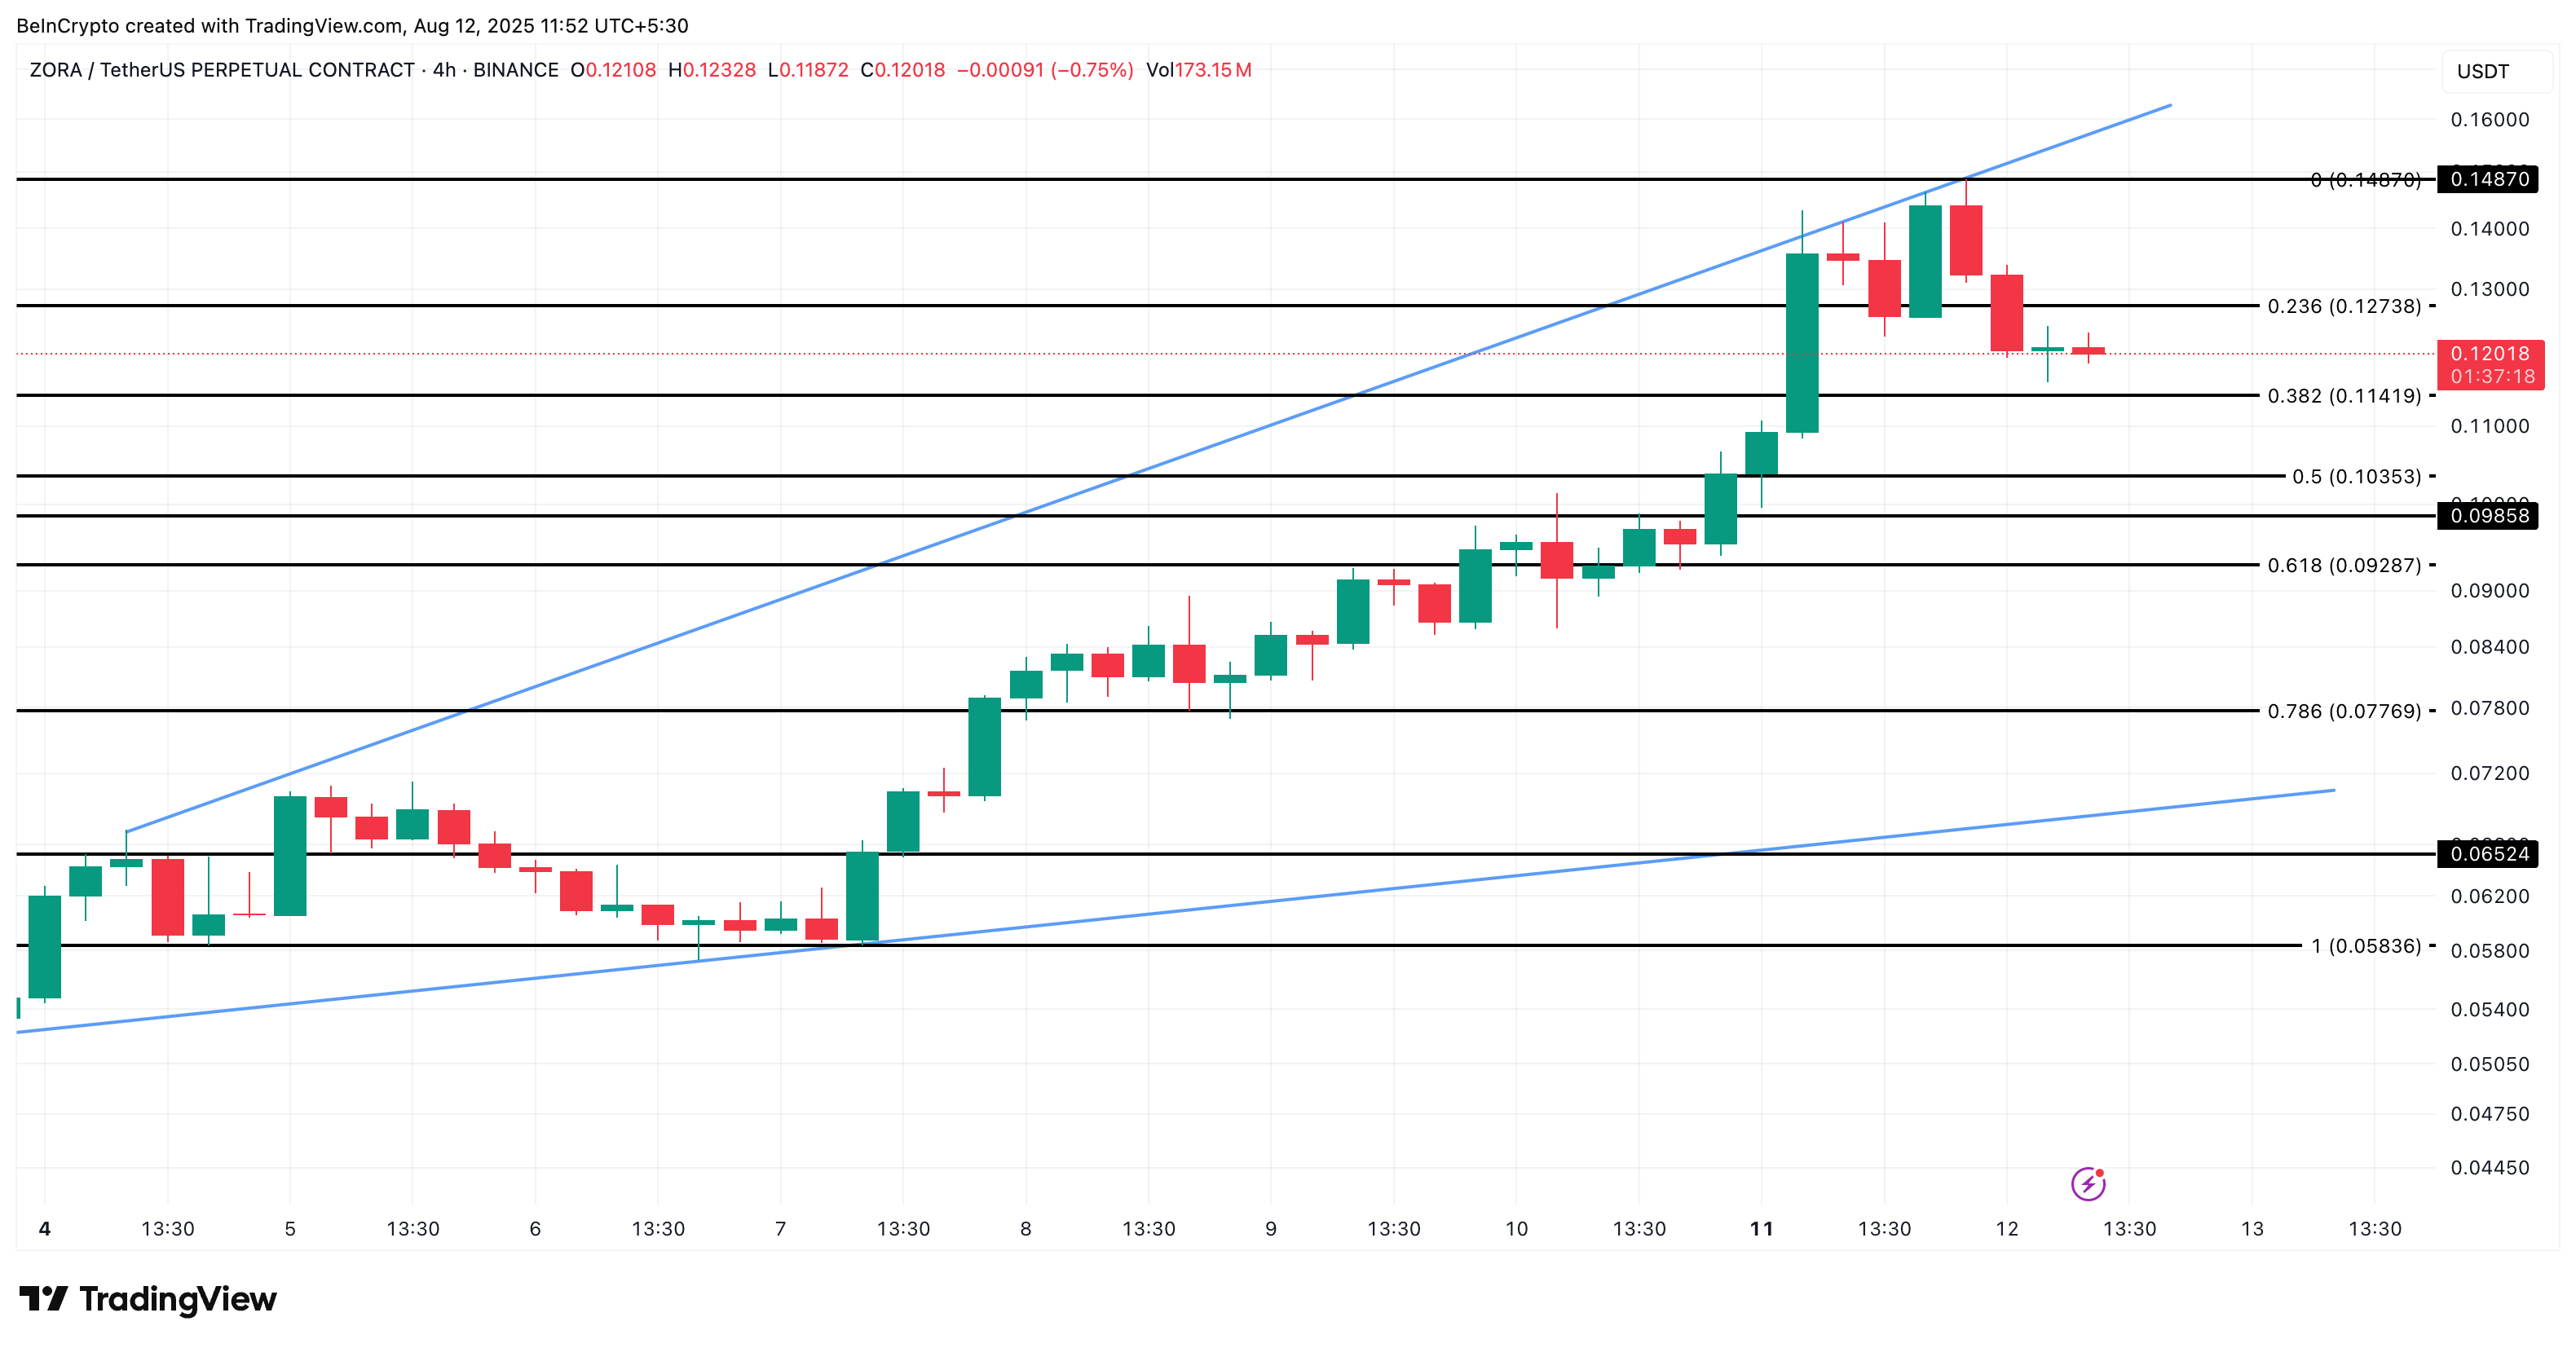
If buyers defend $0.11 and $0.10, the combination of whale accumulation, hidden bullish divergence, and ongoing NFT-driven activity could see the ZORA price retest the highs and potentially post a new all-time high in the next leg up.
But then, if the ZORA price drops under $0.09, the entire structure would turn bearish in the short term.
