

Zilliqa (ZIL) price has been consolidating above a descending support line over the past month and could soon initiate a short-term upward movement. However, there are no long-term bullish reversals signs in place yet.
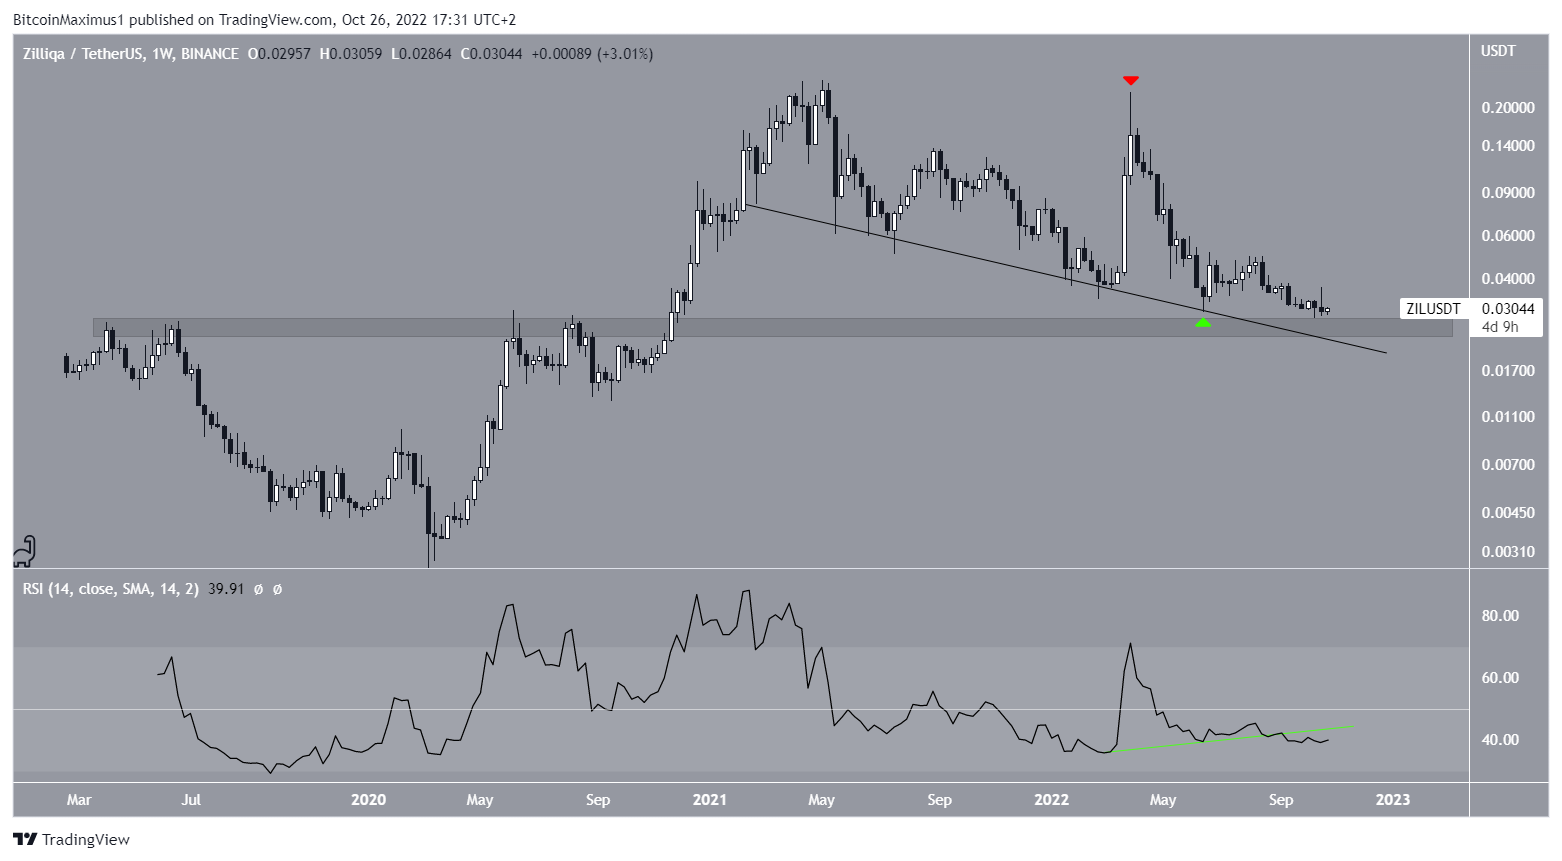
ZIL price has been decreasing since reaching an all-time high of $0.254 in April 2021. After a failed attempt at initiating a reversal, the price reached a lower high (green icon) and fell at an accelerated rate afterward. The downward movement has so far led to a low of $0.027 in Oct. 2022.
Throughout the decrease, the Zilliqa price has followed a descending support line, which now coincides with the $0.025 horizontal support area. The most recent time the line was touched was in June 2022 (green icon).
The weekly RSI has not given any bullish reversal signs. While it previously generated bullish divergence (green line), the trend line is now broken. Additionally, the indicator is below 50.
So, the technical analysis from the weekly time frame gives a bearish ZIL price prediction. It suggests that the price will decrease towards the $0.025 support area.
ZIL Price Prediction Supports Short-Term Relief
The daily timeframe price action shows that in similar fashion to the weekly time frame, the ZIL price has been following a descending support line.
While it is possible that the price is also trading inside a descending wedge, the resistance line of the wedge (dashed) has not been validated sufficient times. So, the validity of the pattern cannot be confirmed.
In any case, the daily RSI has been generating bullish divergence over the past two months. This is a sign that supports a breakout for the future price. It would be confirmed with an RSI increase above 50.
In that case, the Zilliqa price is expected to increase towards the closest resistance at $0.037. However, due to the bearish readings from the weekly time frame, another decrease would then be expected.
Conversely, successive daily closes above the $0.037 area would invalidate the bearish prediction.

For the latest BeInCrypto Bitcoin (BTC) and crypto market analysis, click here
Disclaimer: BeInCrypto strives to provide accurate and up-to-date information, but it will not be responsible for any missing facts or inaccurate information. You comply and understand that you should use any of this information at your own risk. Cryptocurrencies are highly volatile financial assets, so research and make your own financial decisions.
Disclaimer
In line with the Trust Project guidelines, this price analysis article is for informational purposes only and should not be considered financial or investment advice. BeInCrypto is committed to accurate, unbiased reporting, but market conditions are subject to change without notice. Always conduct your own research and consult with a professional before making any financial decisions. Please note that our Terms and Conditions, Privacy Policy, and Disclaimers have been updated.
