


Zilliqa (ZIL) has been moving downwards since attaining an all-time high in May but has bounced after reaching a long-term support area.
The bounce led to a breakout from a descending wedge. ZIL is now aiming to move towards the two closest resistance areas at $0.09 and $0.115.
ZIL reaches long-term support
ZIL has been moving downwards since May 6, when it reached an all-time high price of $0.256. The downward movement continued until a low of $0.05 was reached on July 20.
The low was made inside the 0.786 Fib retracement support area at $0.056.
While ZIL has bounced slightly since the low, technical indicators are still bearish. The RSI is below 50, the Stochastic oscillator has made a bearish cross, and the MACD is nearly negative.

Wedge breakout
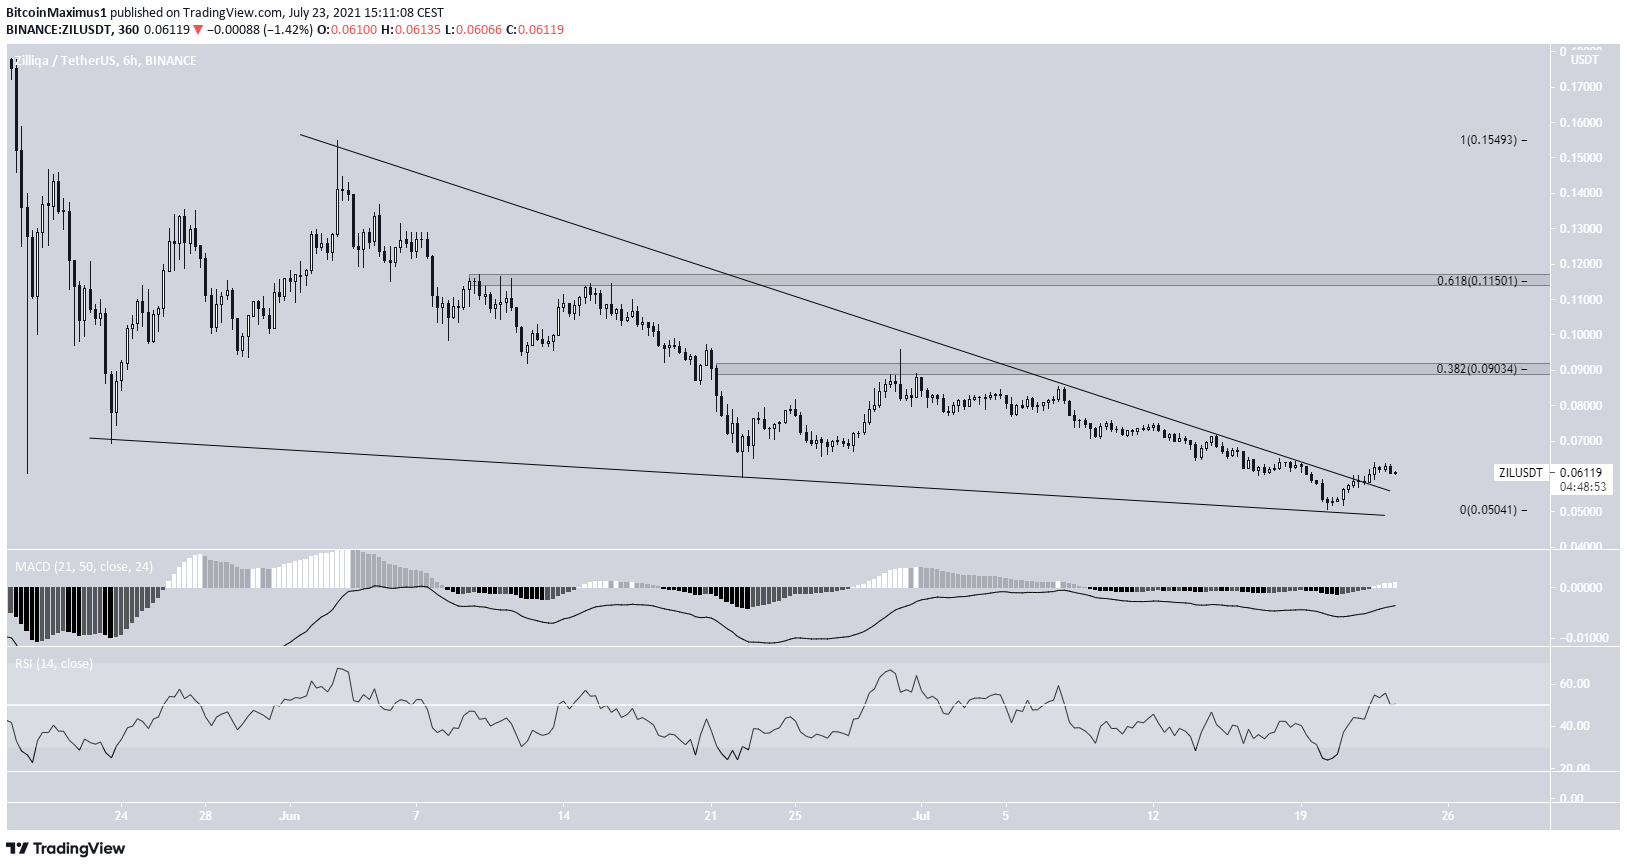
The shorter-term six-hour chart shows that ZIL had been trading inside a descending wedge since May 23. After consolidating inside the wedge until the aforementioned July 20 low, it broke out on July 22.
The MACD & RSI are both increasing, supporting the continuation of the upward movement. The closest resistance levels are at $0.09 and $0.115. These are the 0.382 and 0.618 Fib retracement resistance levels when measuring the entire length of the wedge.
Wave count
Cryptocurrency trader @CryptoTony_ outlined a ZIL chart, stating that the token has begun a new bullish impulse.
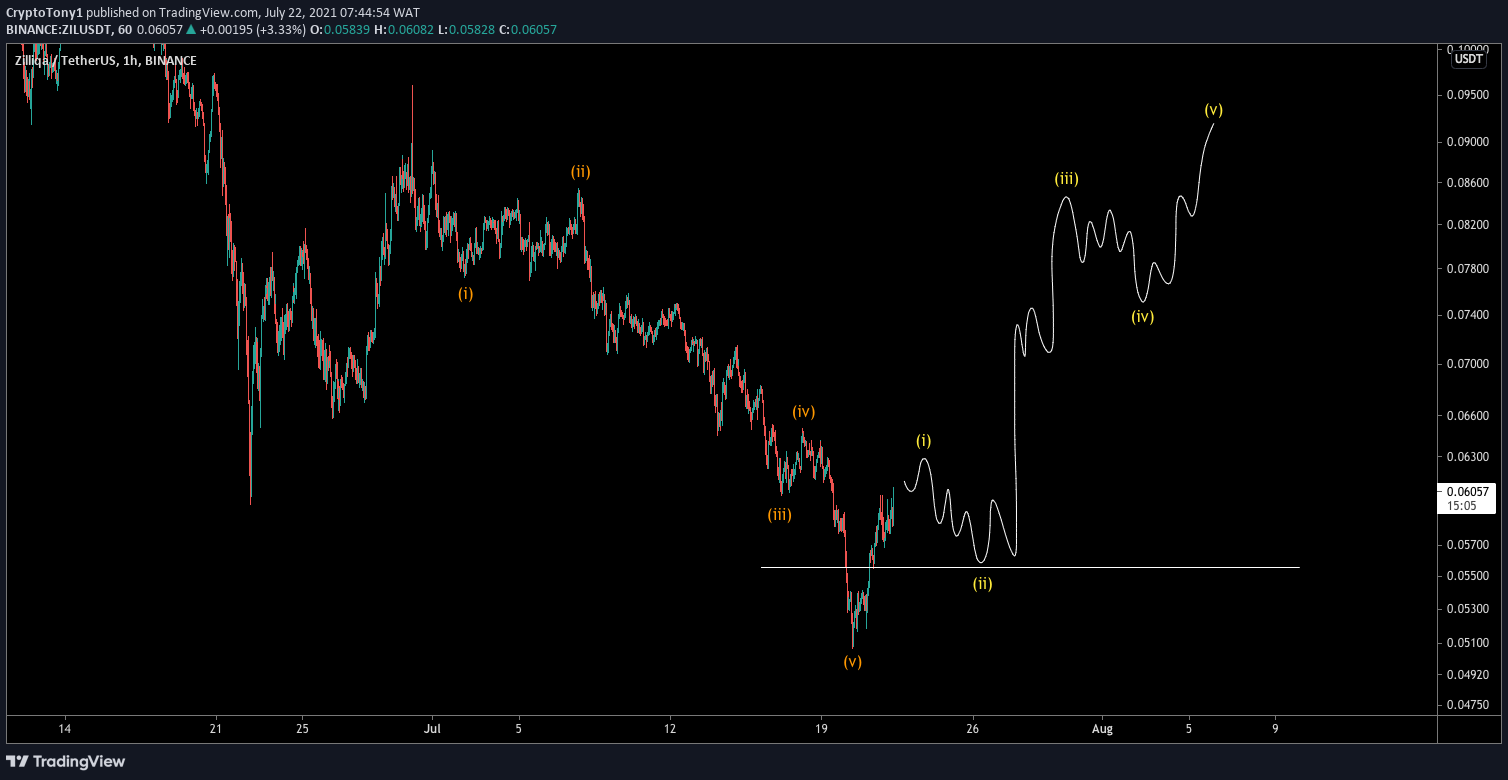
In the short-term, the upward movement does look like the beginning of a new bullish impulse.
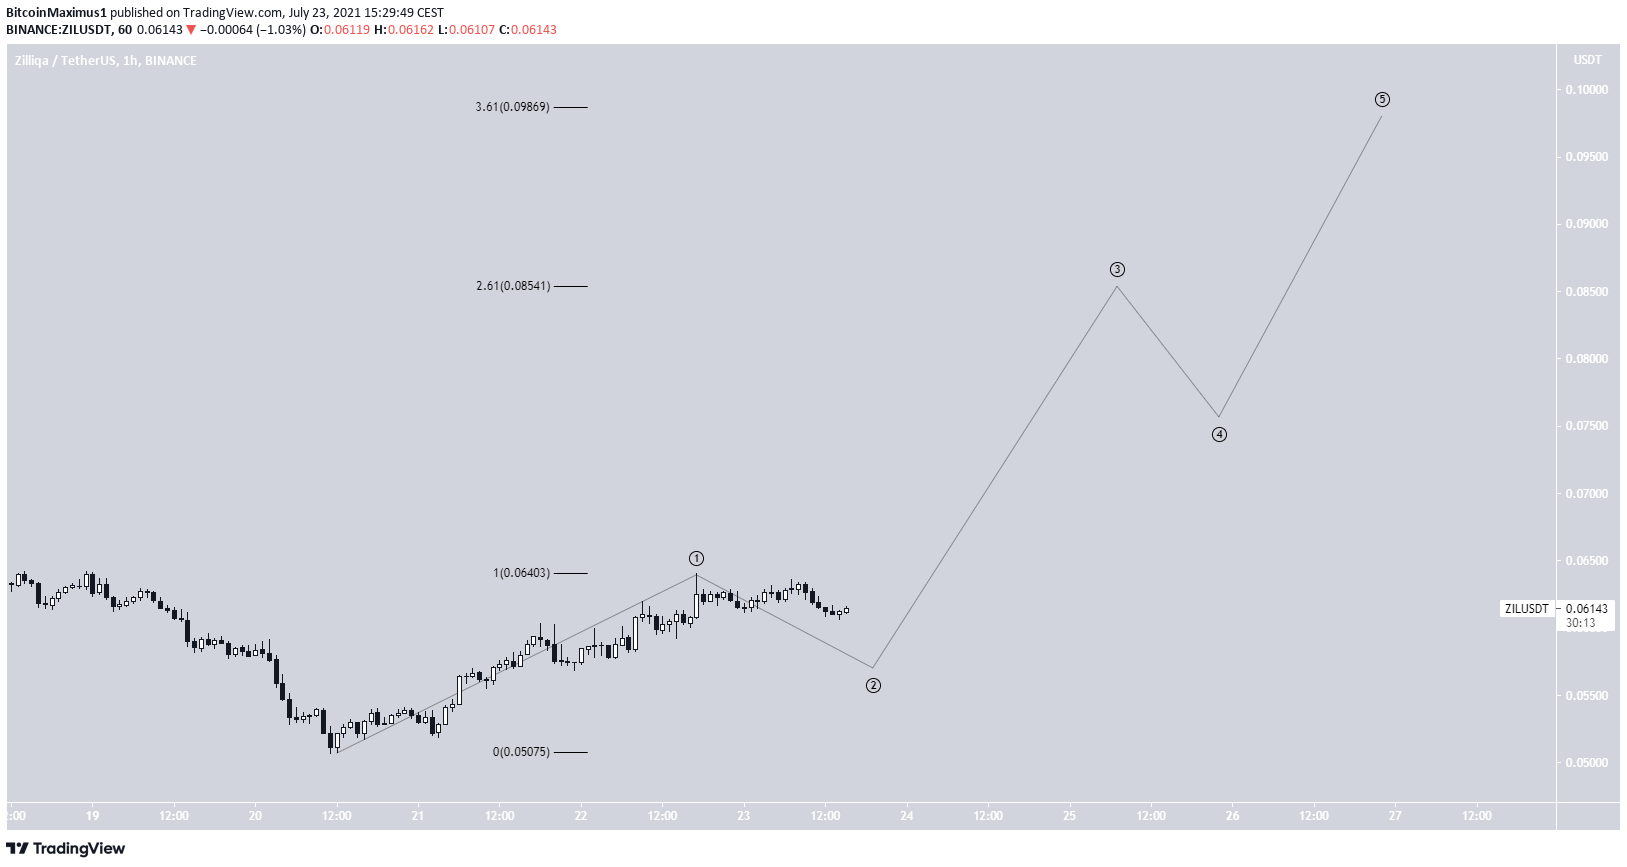
In this possibility, ZIL has just completed wave one (black) and is correcting in what is likely to be wave two.
The entire impulse could take the token towards the $0.09 and potentially $0.0115 resistance levels. The $0.09 resistance area also coincides with the 3.61 Fib extension of wave one.
ZIL/BTC
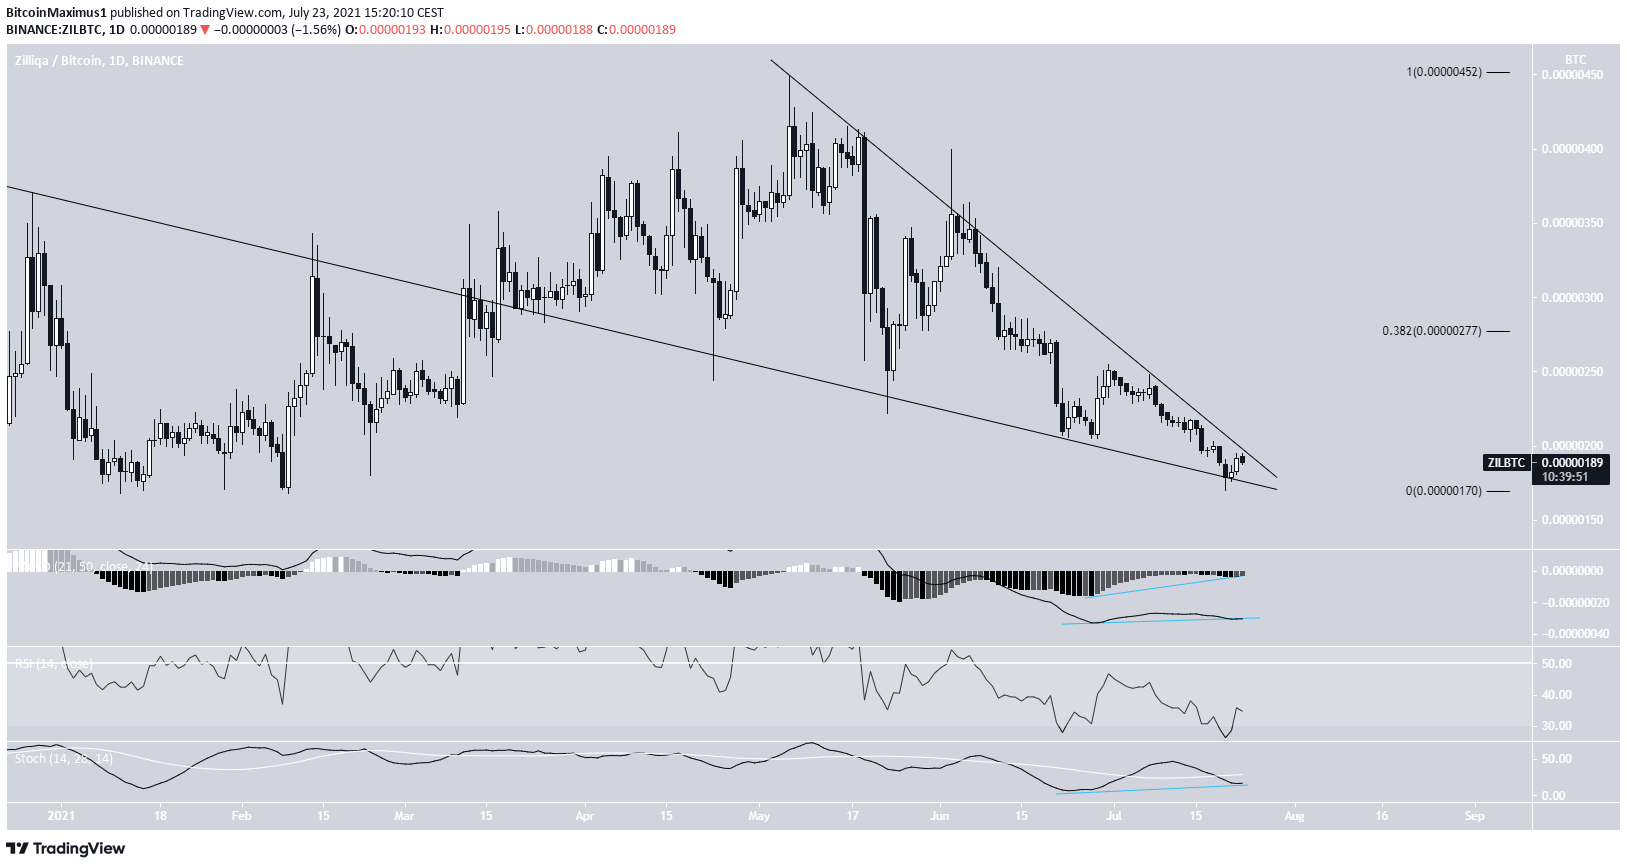
The ZIL/BTC chart looks decisively bullish. The token has been trading inside a descending wedge since May 6. It is nearing the end of the pattern, therefore a decisive movement is expected.
There is a bullish divergence in both the MACD & Stochastic oscillator. In addition, the RSI has moved above the 20 line.
If a breakout occurs, the closest resistance area would be at 277 satoshis.
For BeInCrypto’s latest bitcoin (BTC) analysis, click here.


