


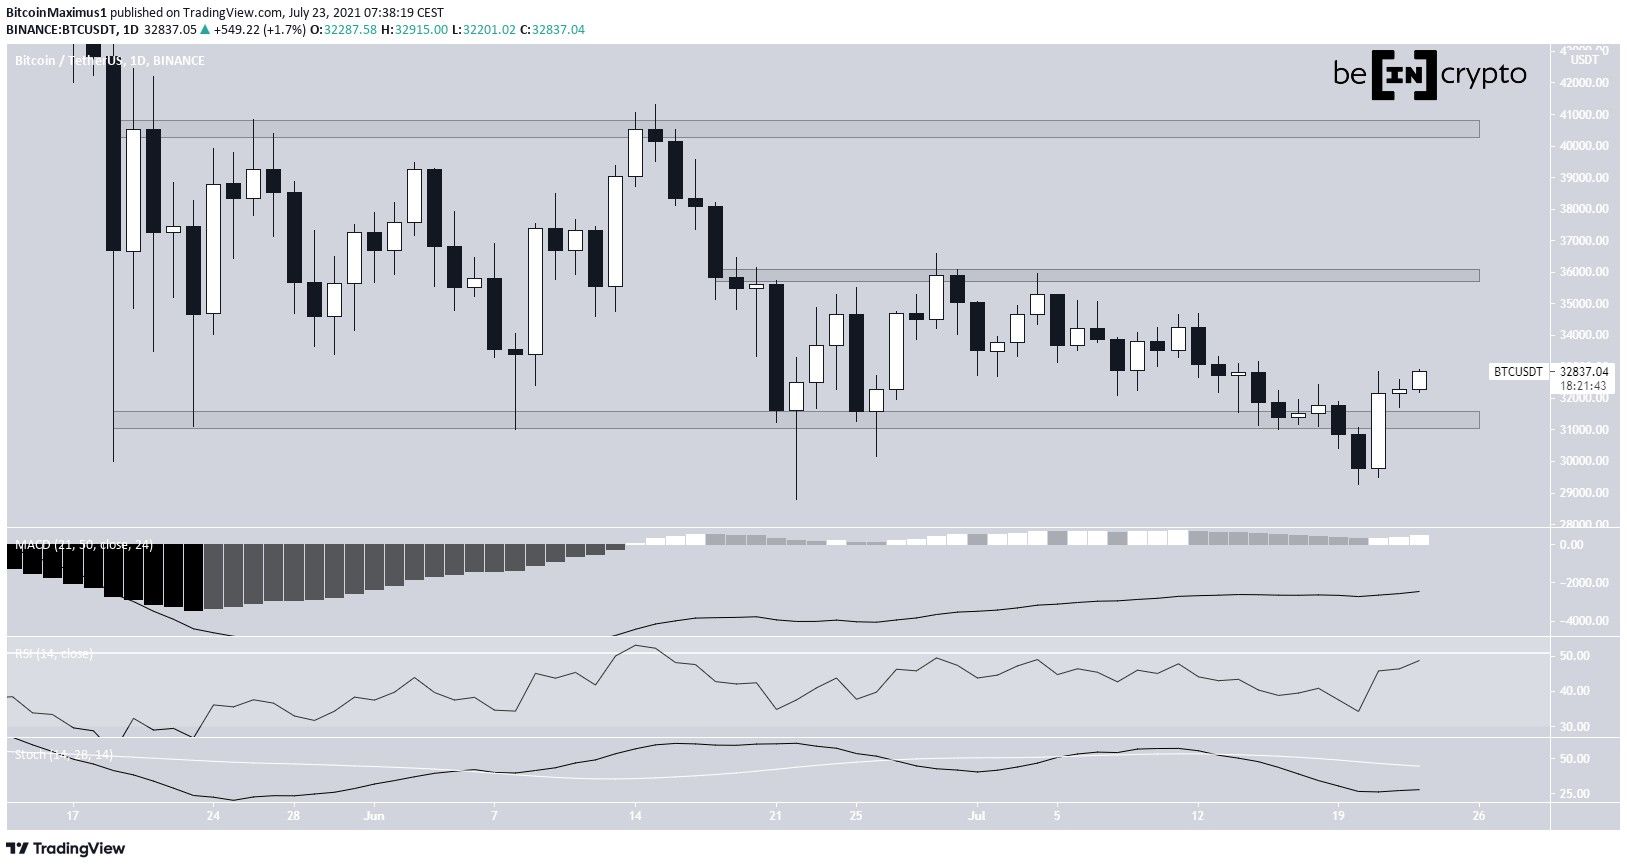
Bitcoin (BTC) sustained its upward movement on July 22, managing to hold on above the $31,300 horizontal area.
However, it has reached a descending resistance line that could cause a short-term rejection prior to the continuation of the upward movement.
Ongoing ascent
After the bullish engulfing candlestick on July 21, BTC increased slightly the next day, creating another small bullish candlestick.
It’s still holding on above the $31,300 horizontal support area, which has now been reclaimed.
Technical indicators are showing bullish signs. The MACD has created two higher momentum bars but is still below 0, the RSI is increasing and is almost above 50, and the slope of the stochastic oscillator is gradually turning bullish, but there is no bullish cross in place yet.
The closest resistance area is the middle of the range at $35,900.
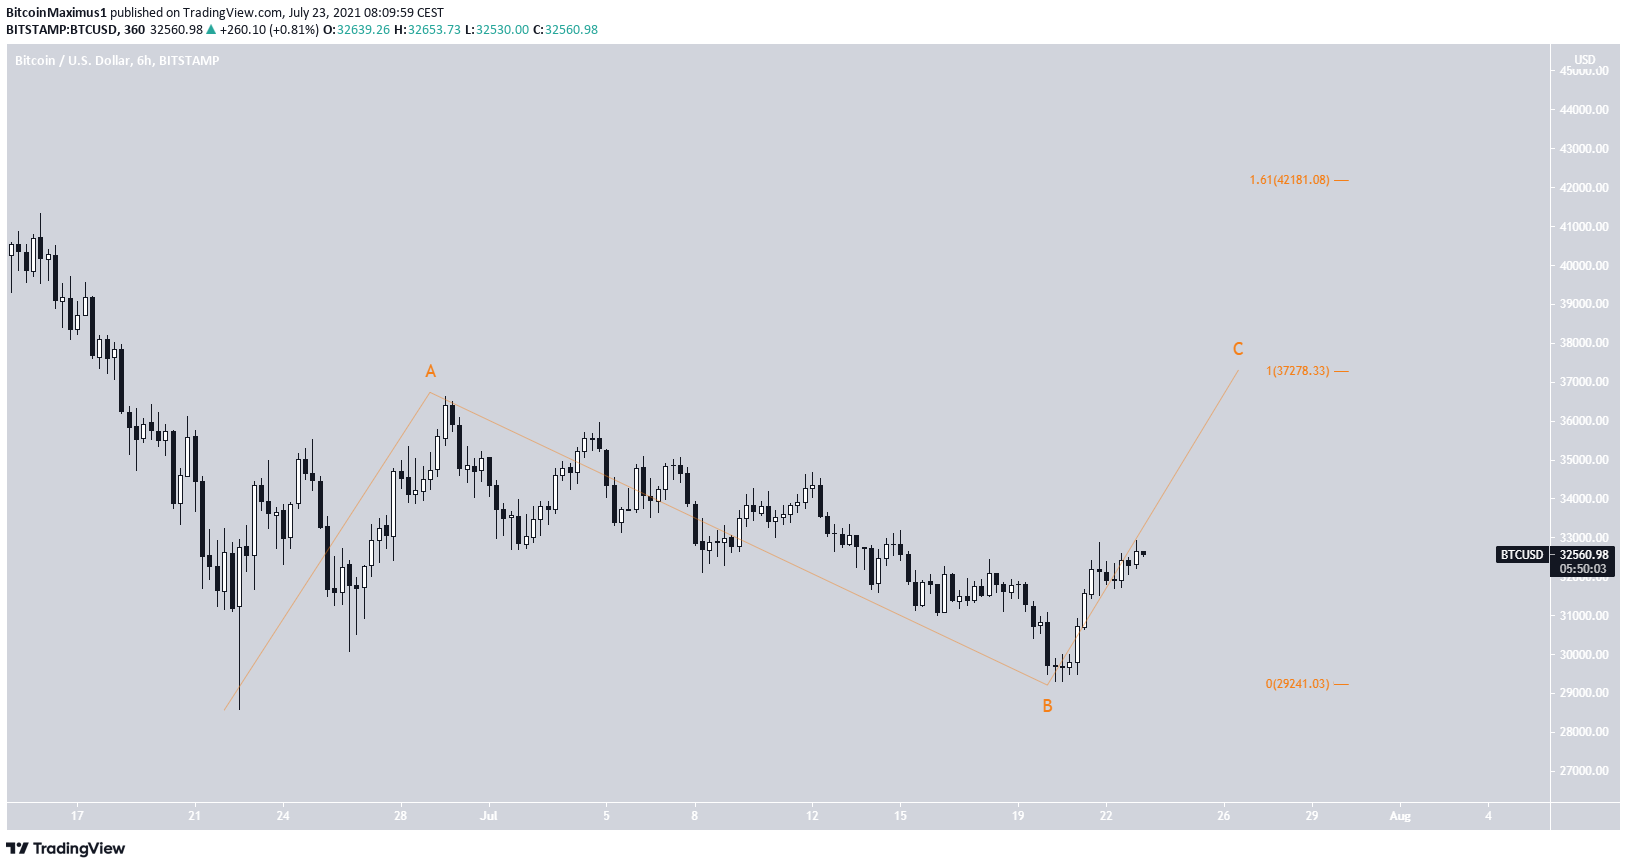
Will BTC break out?
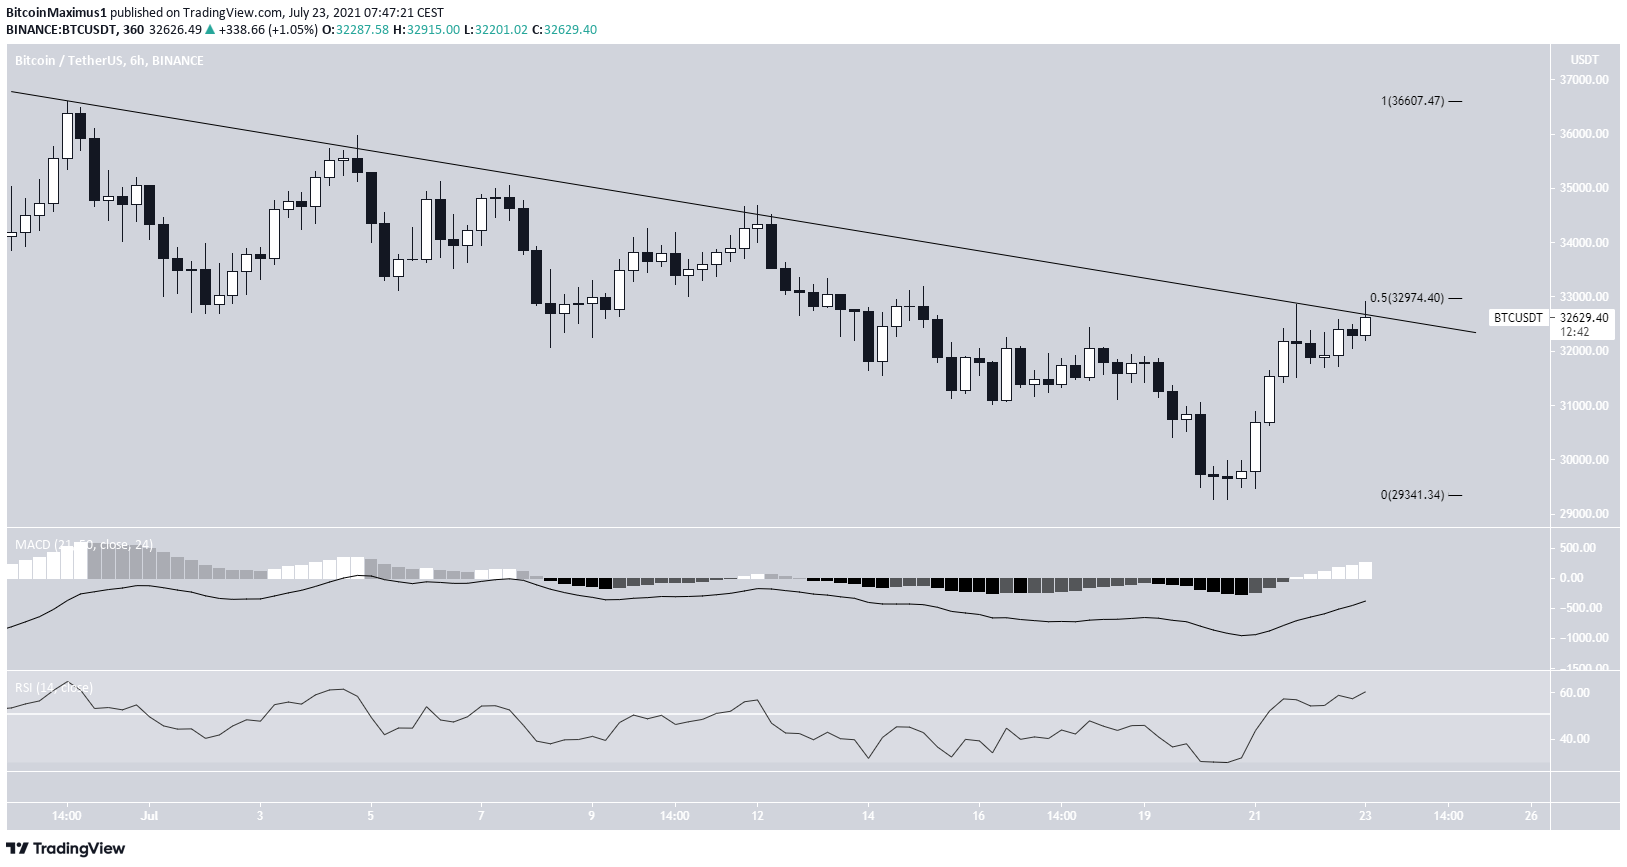
The six-hour chart shows that BTC is following a descending resistance line since June 29.
It has just reached the line for the fourth time.
The line also coincides with the 0.5 Fib retracement resistance level at $32,975. Therefore, BTC is currently facing a confluence of resistance levels.
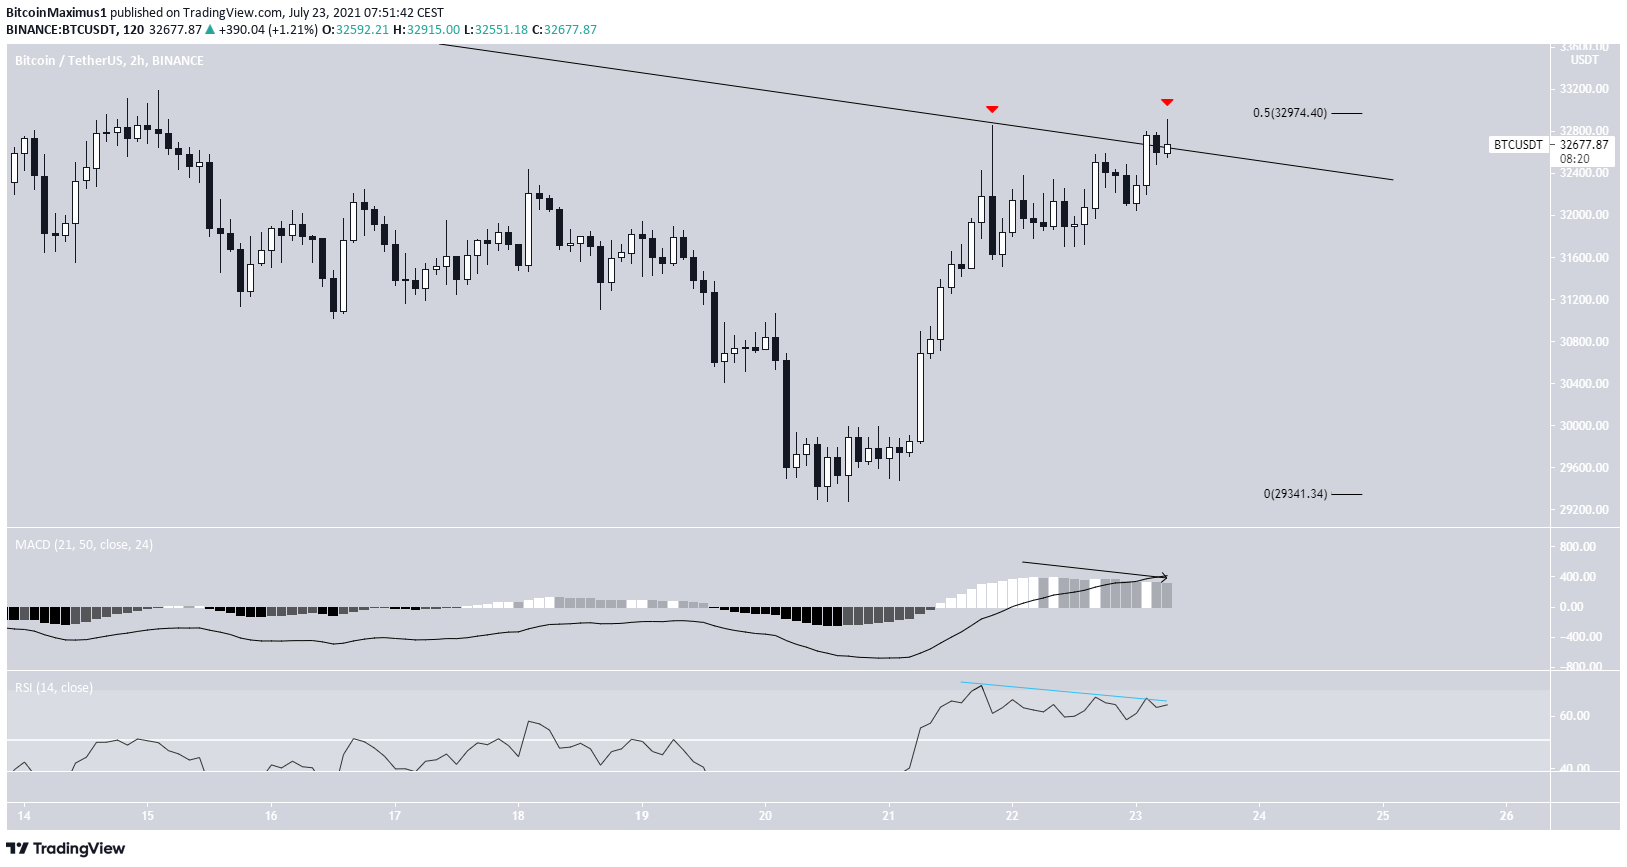
The two-hour chart is showing some weaknesses. BTC has created a double top pattern with two long upper wicks (red icon). In addition to this, the RSI and MACD have generated bearish divergences.
Therefore, it’s possible that BTC will get rejected and decrease.
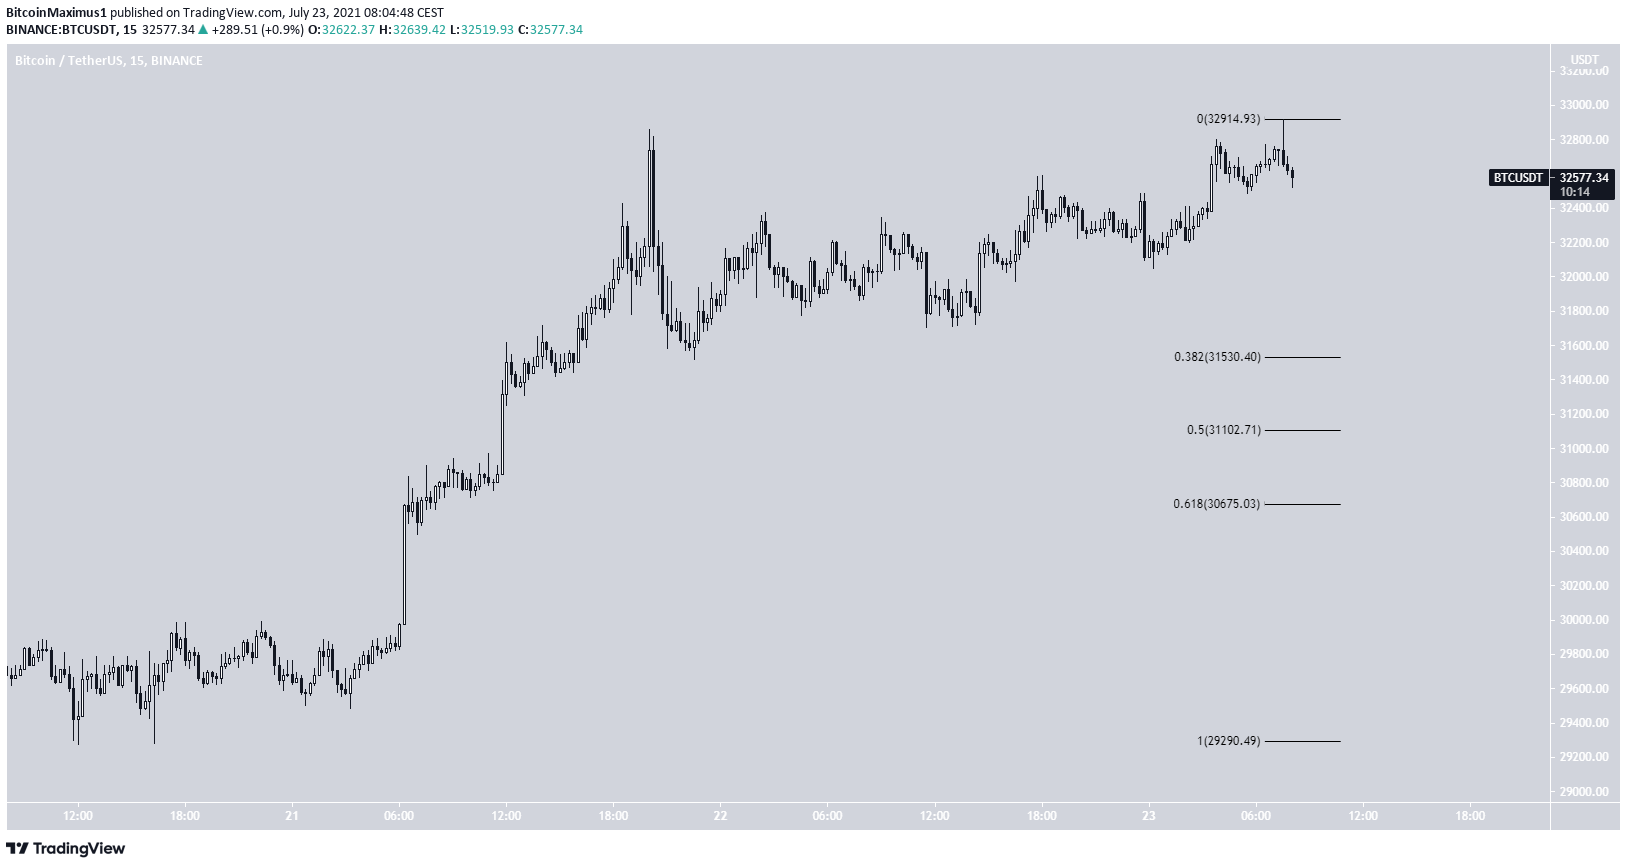
In this case, the three main support levels would be found at $31,530, $31,100 and $30,675. These are the 0.382, 0.5 and 0.618 Fib retracement support levels respectively.
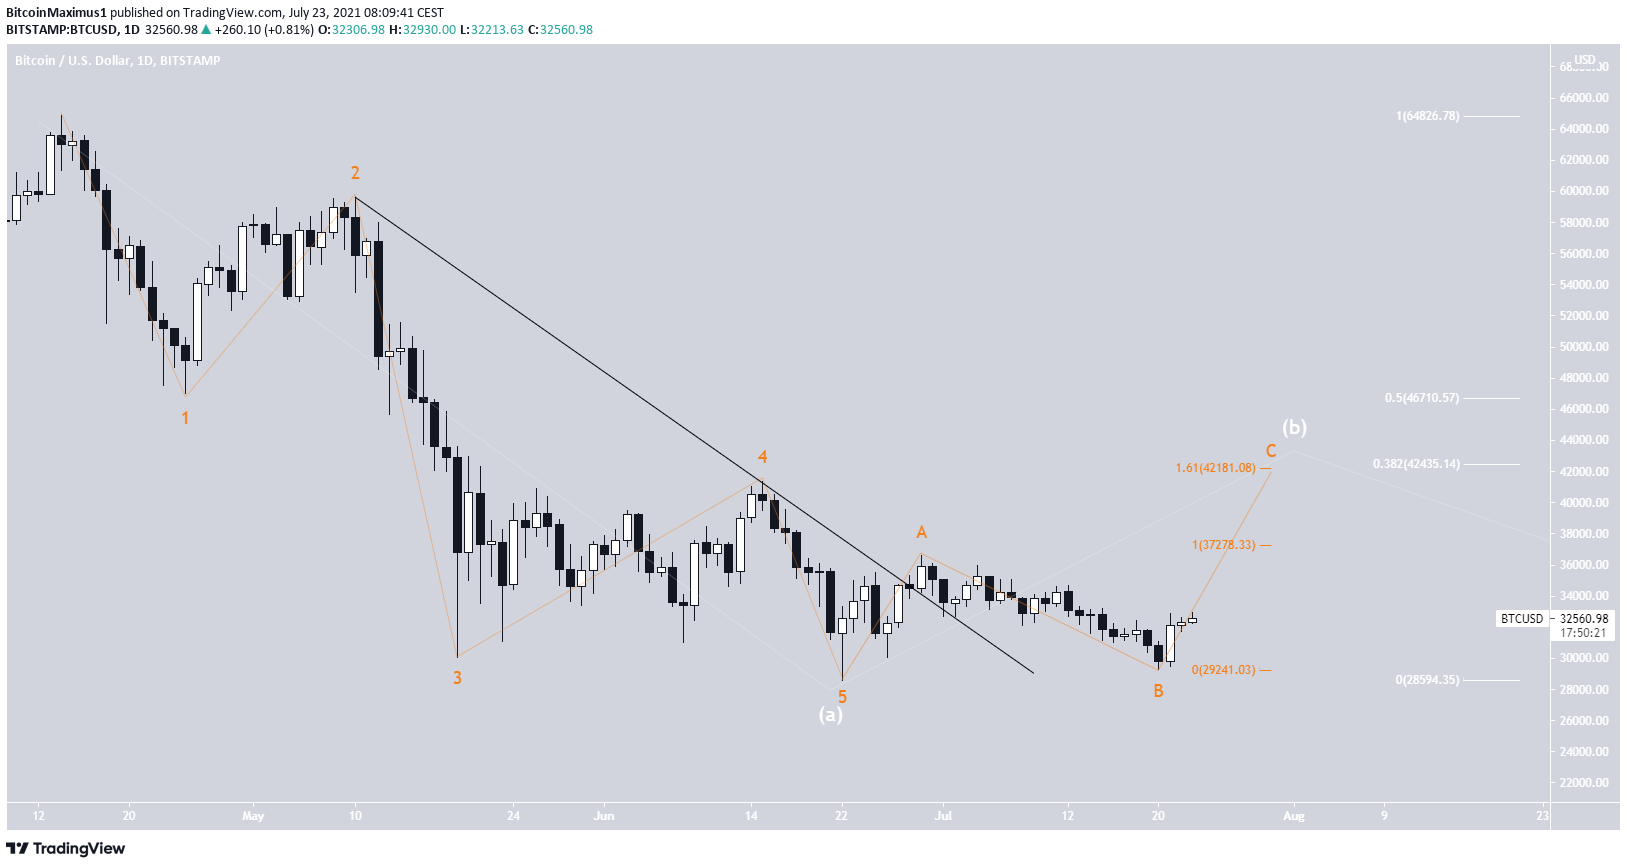
Wave count
The wave count suggests that BTC is in wave C of an A-B-C corrective structure.
If waves A:C have a 1:1 ratio, the formation would end near a high of $37,278. If they instead have a 1:1.61 ratio, it could reach a top near $42,181.
Looking at the slightly longer term movement, the second target of $42,181 would make more sense in relation to the length of the previous waves.
The level coincides with the 0.382 Fib retracement resistance level (white) when measuring the entire downward movement since the April all-time high.
For BeInCrypto’s previous bitcoin (BTC) analysis, click here.


