At BeInCrypto, we offer regular price analyses and predictions of the most popular and relevant cryptoassets. In our Apr 17 analysis of Zcash (ZEC), we predicted price decreases. Even though the price has increased slightly, losses may still be forthcoming. To learn more, read our latest ZEC/USD($) and ZEC/EUR(€) below:
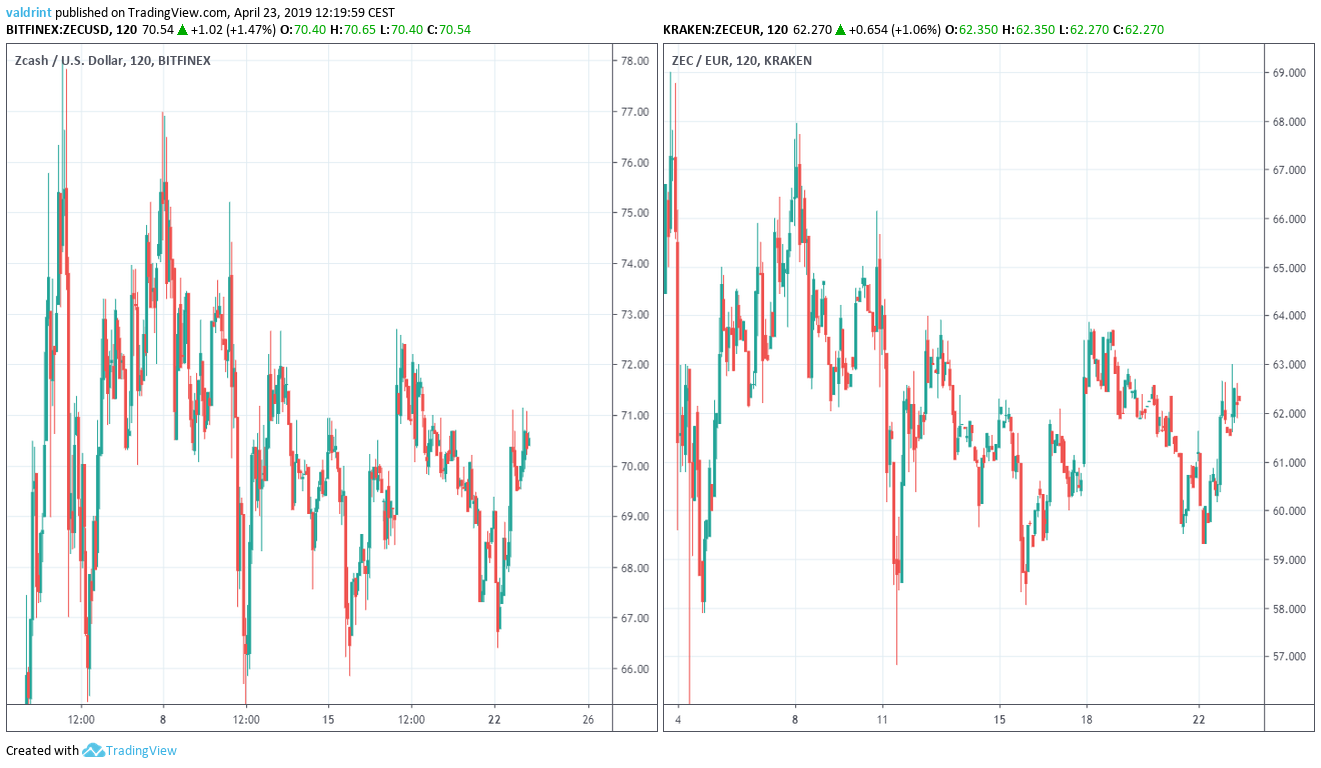
On Apr 3, 2019, the price of Zcash (ZEC) reached a high of $78 and €69. A sharp decrease was followed by a gradual increase. Highs on Apr 8 were slightly lower than on Apr 3. Heavy volatility has been experienced along a gradual downtrend since:
Zcash (ZEC): Trends and Highlights for Apr 23, 2019
- ZEC/USD and ZEC/EUR have been on a gradual downtrend since Apr 3.
- It is trading inside a descending triangle.
- Bearish divergence is developing in the RSI.
- Zcash is resistance from the 200-day moving average.
- There is support near $60 and €52.
The Current Trading Pattern
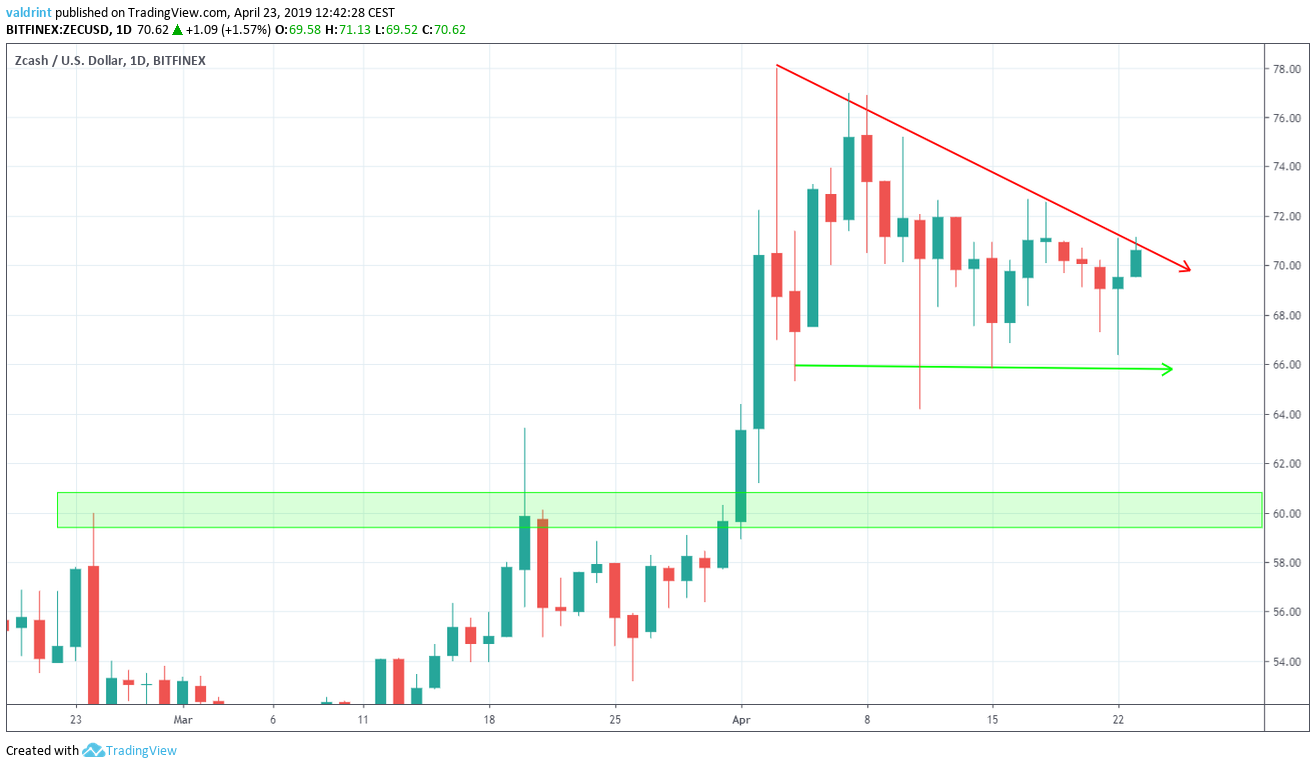
We analyze the price of ZEC on Binance at two-hour intervals from Apr 3 to Apr 23 in order to trace the current trading pattern. We do not include euros in this section because only one trading pair is needed to generate the current trading pattern. Both ZEC/USD and ZEC/EUR are discussed in the final two sections.
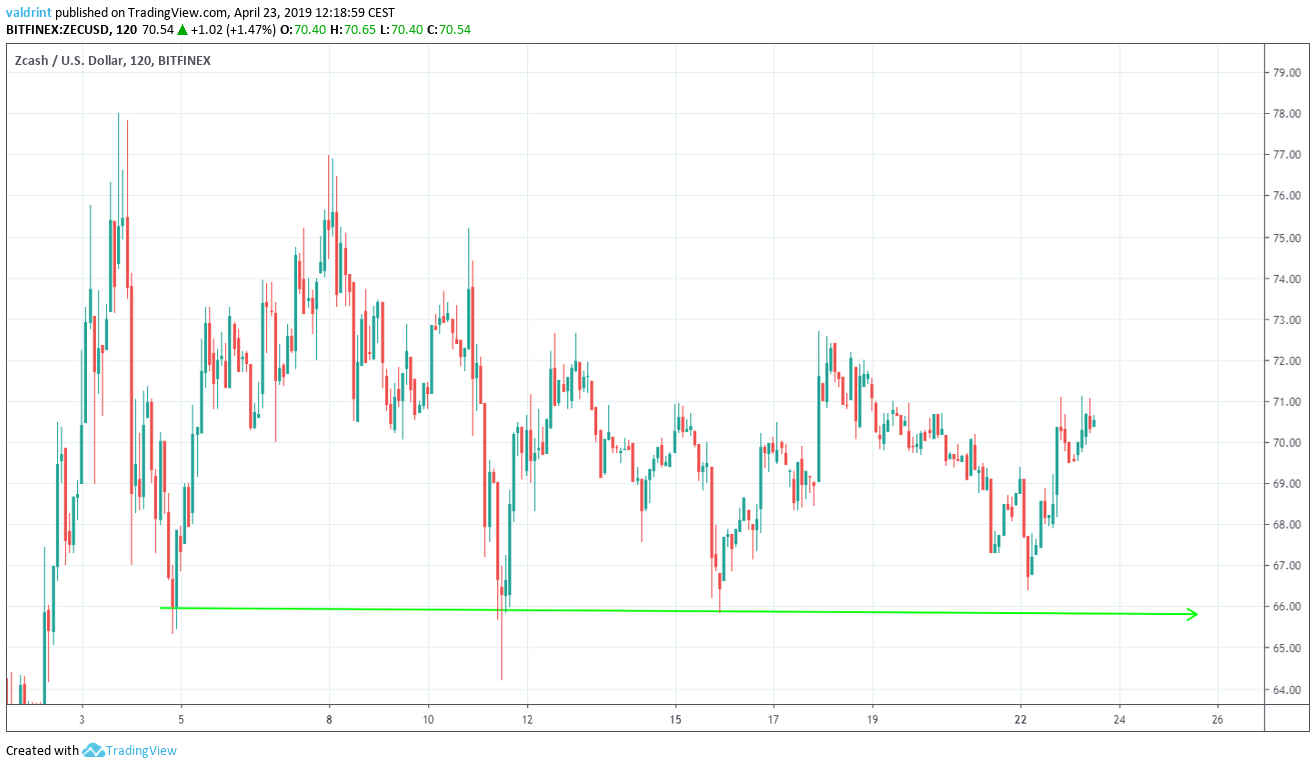
The price made a low of $65.32 on Apr 4. A gradual upward move followed. Several market cycles have been completed since and the price has reached the same level three times.
Tracing these lows gives us a horizontal support line:
 On Apr 3, the price reached a high of $78.0. A sharp drop was followed by a gradual increase. The price has made successively lower highs.
Tracing these highs gives us a descending resistance line:
On Apr 3, the price reached a high of $78.0. A sharp drop was followed by a gradual increase. The price has made successively lower highs.
Tracing these highs gives us a descending resistance line:
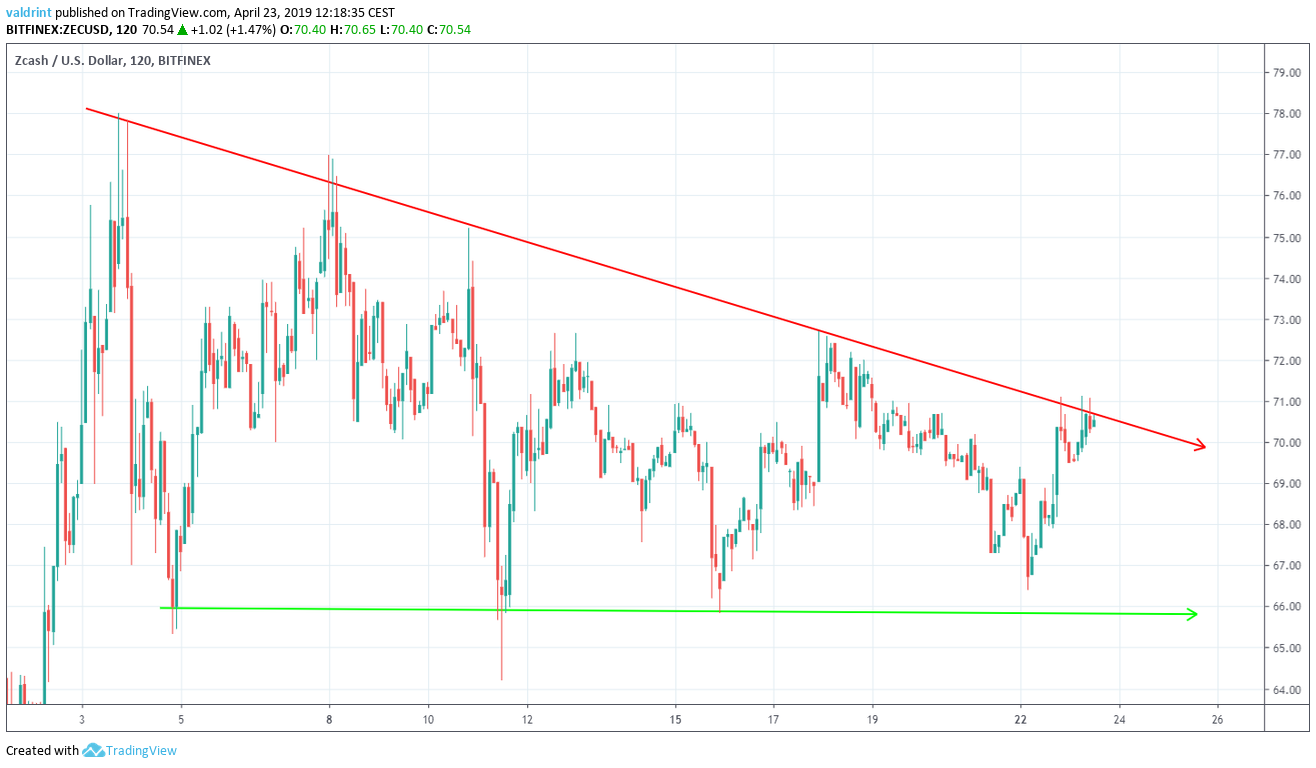 The resistance and support lines combine to create a descending triangle, which is a bearish pattern, making price decreases more likely.
It is likely that the price will keep trading within the confines of this triangle until a decisive move occurs.
In order to figure out the direction of the move, we need to take a look at a longer time-frame combined with technical indicators.
The resistance and support lines combine to create a descending triangle, which is a bearish pattern, making price decreases more likely.
It is likely that the price will keep trading within the confines of this triangle until a decisive move occurs.
In order to figure out the direction of the move, we need to take a look at a longer time-frame combined with technical indicators.
What Do the Technical Indicators Say?
In this section, the price of ZEC/USD is analyzed at one-day intervals from Apr 1 to Apr 23 alongside the RSI and the 200-day moving average.
The relative strength index (RSI) is an indicator which calculates the size of the changes in price in order to determine oversold or overbought conditions in the market.
Moving averages are tools used in technical analysis to smooth out price action. It is a lagging indicator since it is based on past prices. The relationship between price and moving averages can help in identifying resistance and support areas
RSI is traced in the chart below alongside the price and the 200-day moving average.
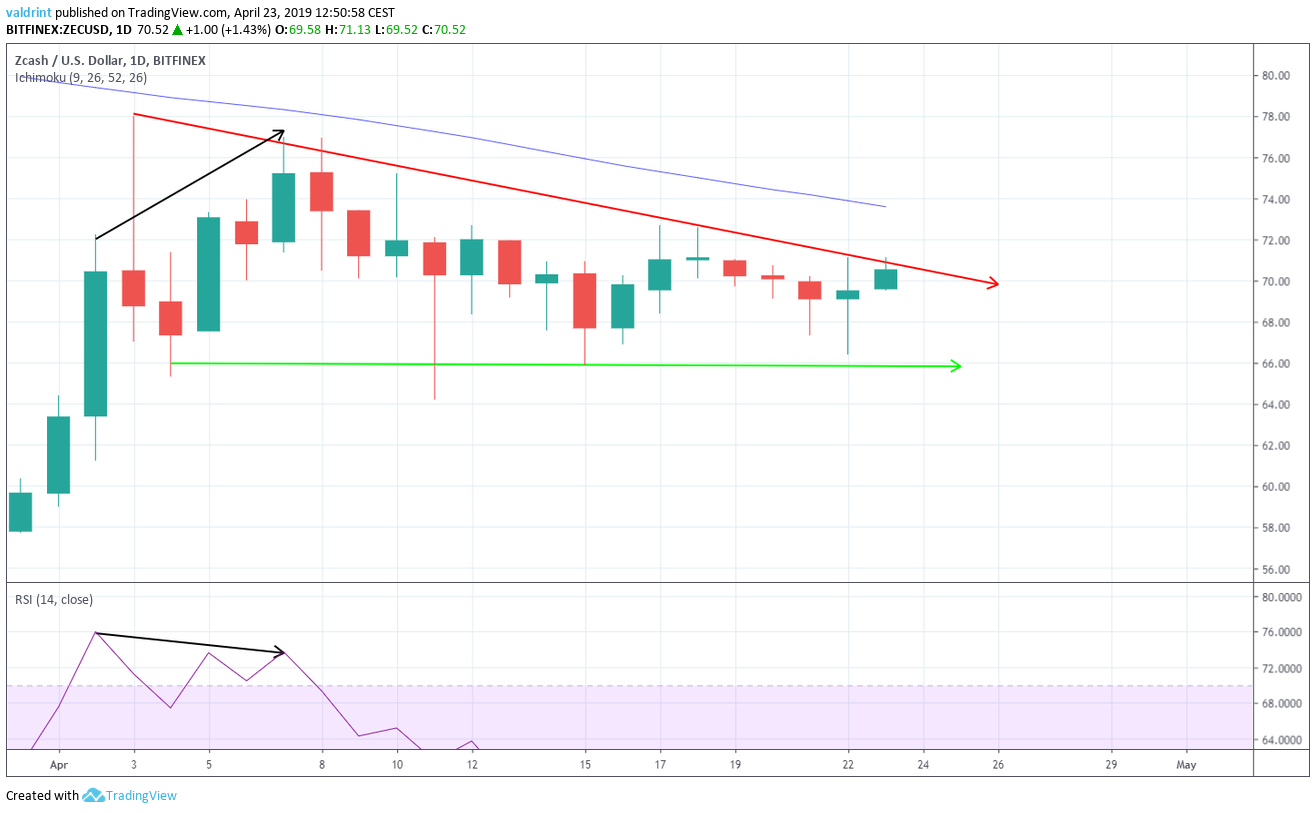 On Apr 2, the price reached a high of $72.24. It reached another high of $76.99 on Apr 7. Similarly, the RSI reached a high on Apr 2. However, it has proceeded to generate lower values.
This is known as bearish divergence and often precedes price decreases.
Furthermore, we can see that the price has unsuccessfully attempted to break out above and is facing very close resistance from the 200-day moving average.
The use of this indicator suggests that price may drop and possibly break down from the triangle.
On Apr 2, the price reached a high of $72.24. It reached another high of $76.99 on Apr 7. Similarly, the RSI reached a high on Apr 2. However, it has proceeded to generate lower values.
This is known as bearish divergence and often precedes price decreases.
Furthermore, we can see that the price has unsuccessfully attempted to break out above and is facing very close resistance from the 200-day moving average.
The use of this indicator suggests that price may drop and possibly break down from the triangle.
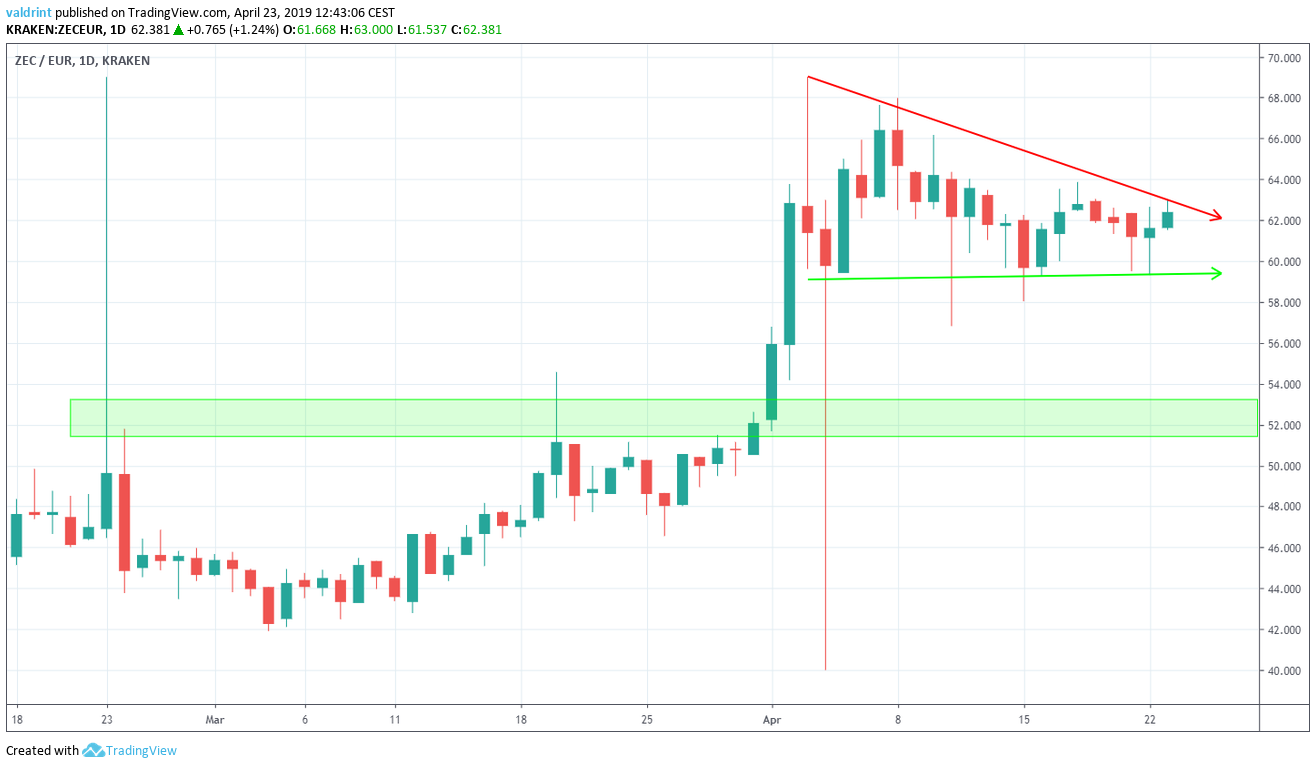
Finding Support
To determine possible future price levels in the event of a breakdown, we incorporate support areas into the analysis.
Support areas are created when the price reaches the same level several times. They can provide likely reversal areas in case a breakdown occurs.
One possible support area is shown for both ZEC/USD and ZEC/EUR below:
Summary of Analysis
Based on this analysis, the price will likely trade inside the confines of the descending triangle and eventually break down. It is likely it will move toward the support area outlined above and possibly reach $60 and €52. Do you think the price of ZEC will break down from the triangle? Let us know in the comments below. If you’d like to read the long-term price predictions of Zcash, click on the green button below: Disclaimer: This article is not trading advice and should not be construed as such. Always consult a trained financial professional before investing in cryptocurrencies, as the market is particularly volatile.
Top crypto projects in the US | April 2024
Trusted
Disclaimer
In line with the Trust Project guidelines, this price analysis article is for informational purposes only and should not be considered financial or investment advice. BeInCrypto is committed to accurate, unbiased reporting, but market conditions are subject to change without notice. Always conduct your own research and consult with a professional before making any financial decisions. Please note that our Terms and Conditions, Privacy Policy, and Disclaimers have been updated.

Valdrin Tahiri
Valdrin discovered cryptocurrencies while he was getting his MSc in Financial Markets from the Barcelona School of Economics. Shortly after graduating, he began writing for several different cryptocurrency related websites as a freelancer before eventually taking on the role of BeInCrypto's Senior Analyst.
(I do not have a discord and will not contact you first there. Beware of scammers)
READ FULL BIO
Sponsored
Sponsored