


On Apr 3, 2019, the price of Zcash (ZEC) reached a high of $78. A sharp decrease ensued. It reached similar levels on Apr 8. It has been decreasing since.
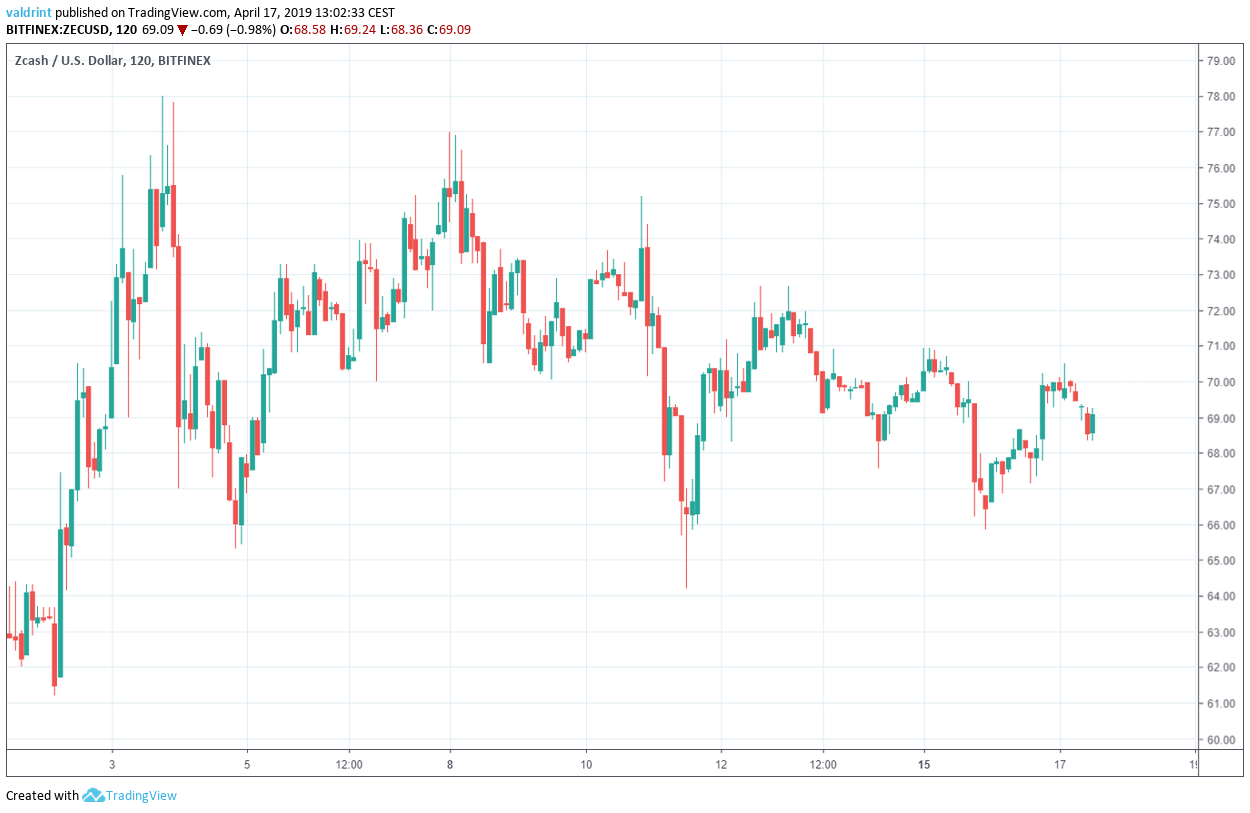
Will price losses continue for Zcash or can we expect a reversal soon?
Let’s find out.
Zcash (ZEC): Trends and Highlights for Apr 17, 2019
- The price of Zcash has been on a gradual downtrend since Apr 3.
- It is trading inside a descending triangle.
- There is bearish divergence developing in the RSI.
- There is support near $60.
Descending Triangle
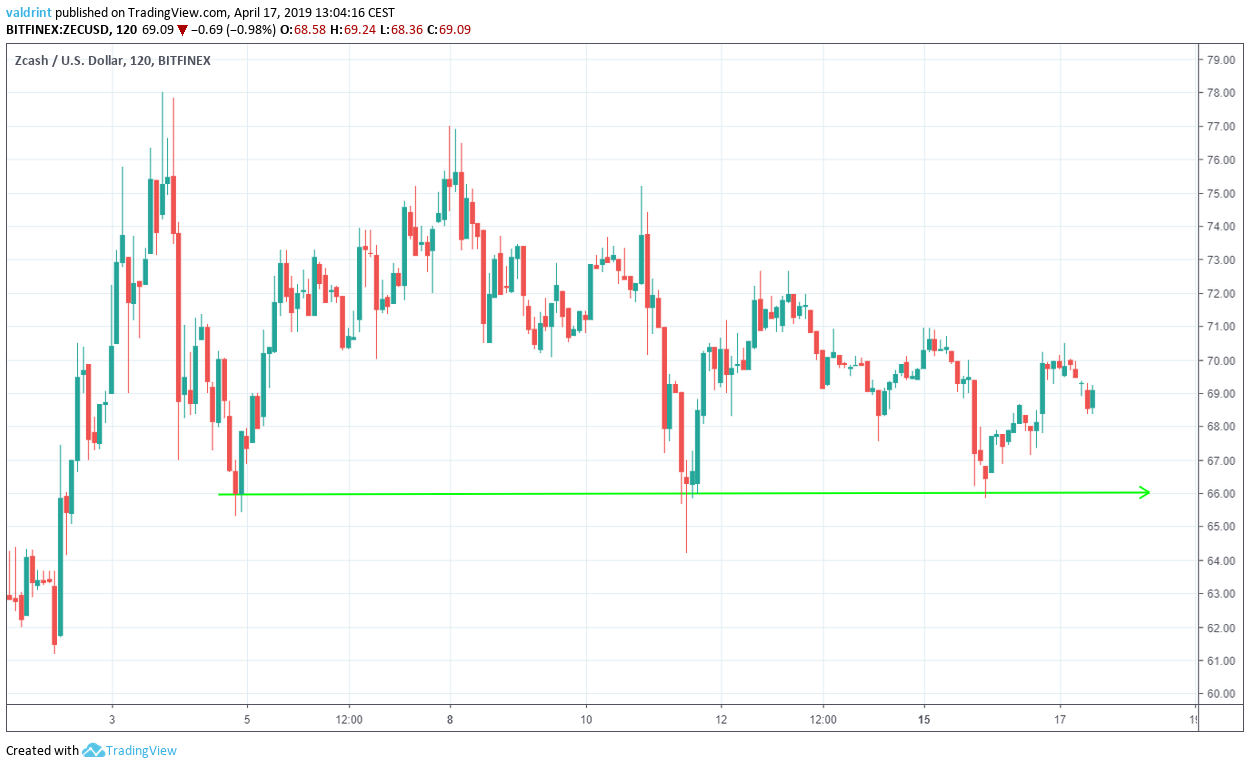
The price made a low of $65.32 on Apr 4. A gradual upward move followed. Several market cycles have been completed since and the price has reached the same level three times.
Tracing these lows gives us a horizontal support line:
On Apr 3, the price reached a high of $78. A sharp drop was followed by a gradual increase. The price has made successively lower highs.
Tracing these highs gives us a descending resistance line:
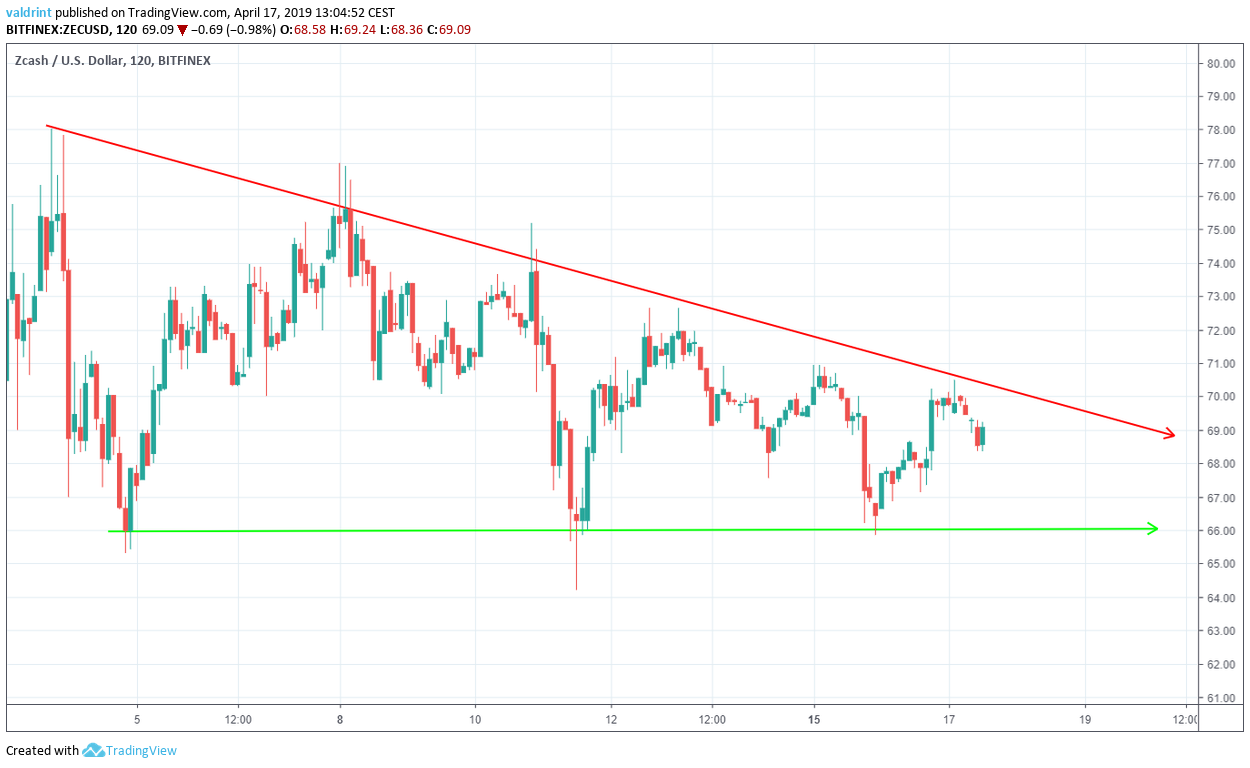
The resistance and support lines combine to create a descending triangle, which is a bearish pattern, making price decreases more likely.
It is likely that the price will keep trading within the confines of this triangle until a decisive move occurs.
In order to figure out the direction of the move, we need to take a look at some technical indicators.
Technical Indicators
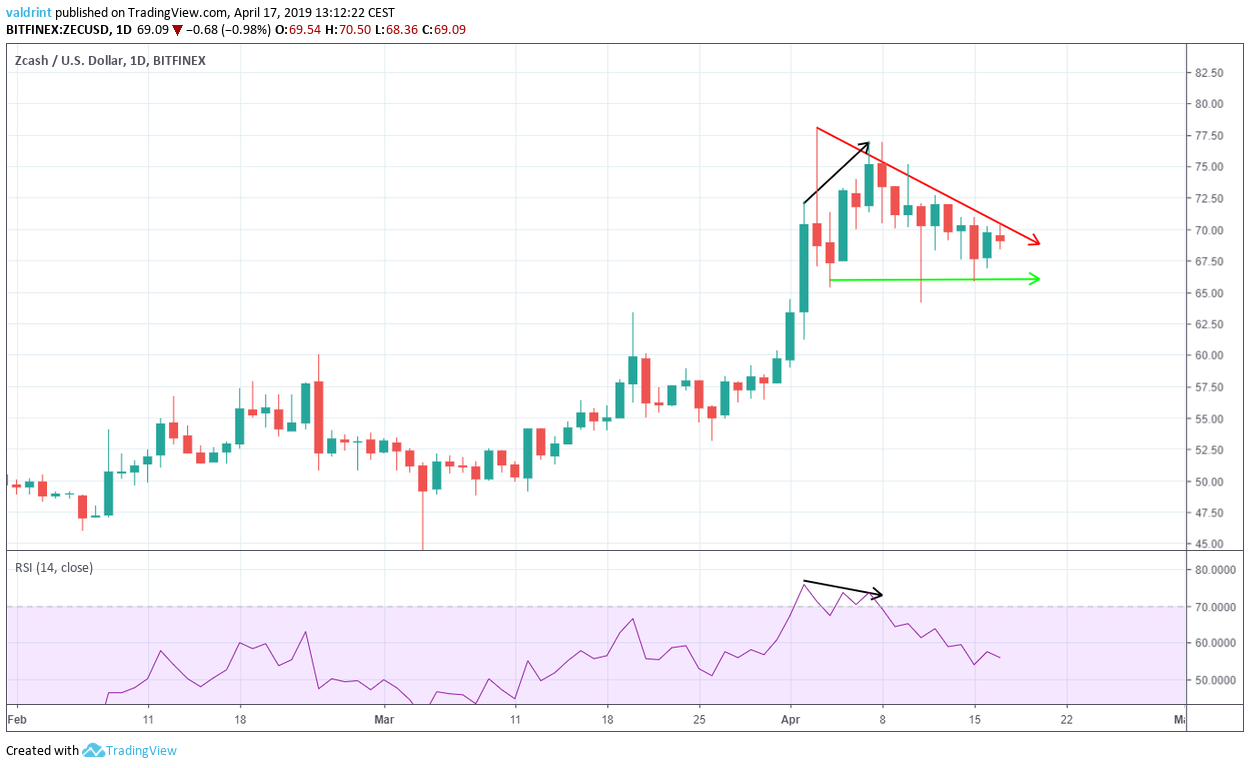
On Apr 2, the price reached a high of $72.24. It reached another high of $76.99 on Apr 7.
Similarly, the RSI reached a high on Apr 2. However, it has proceeded to generate lower values.
This is known as bearish divergence and often precedes price decreases.
The use of this indicator combined with the creation of a bearish pattern indicates that it is likely that the price will break down from the triangle.
Where will it find support?
Finding Support
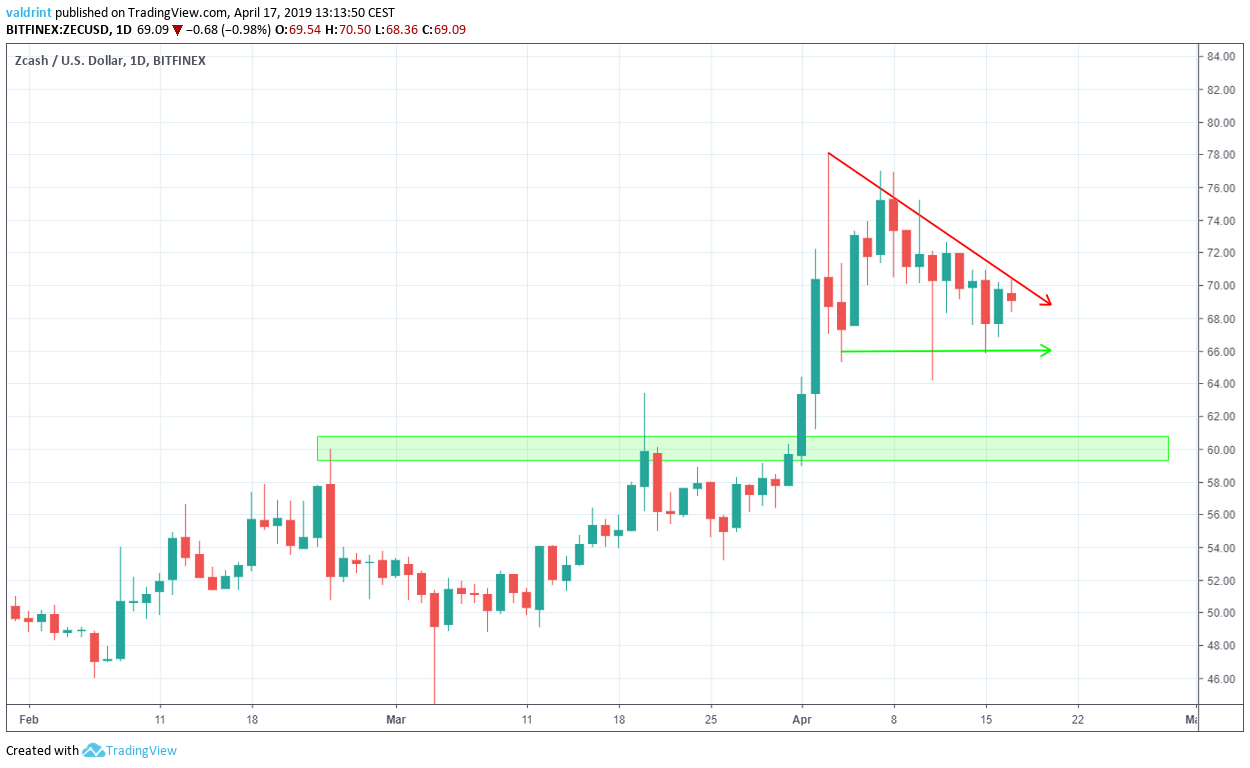
The closest support area is found near $60. It is likely that Zcash will continue moving toward this area, but a reversal may occur before it is reached. Furthermore, volatility may occur along this downtrend.
Summary of Analysis
Based on this analysis, the price will likely trade inside the confines of the descending triangle and eventually break down. It is likely it will move toward the support area outlined above and possibly reach $60.
Do you think the price of ZEC will break down from the triangle? Let us know in the comments below.
If you’d like to read long-term price predictions of Zcash, click on the green button below:
Disclaimer: This article is not trading advice and should not be construed as such. Always consult a trained financial professional before investing in cryptocurrencies, as the market is particularly volatile.


