
Zcash (ZEC) is currently making an attempt at breaking out from the $110 resistance area. This is a strong resistance level that has been in place for nearly 800 days.
The long-term trend seems to be bullish and Zcash is expected to be successful in breaking out.
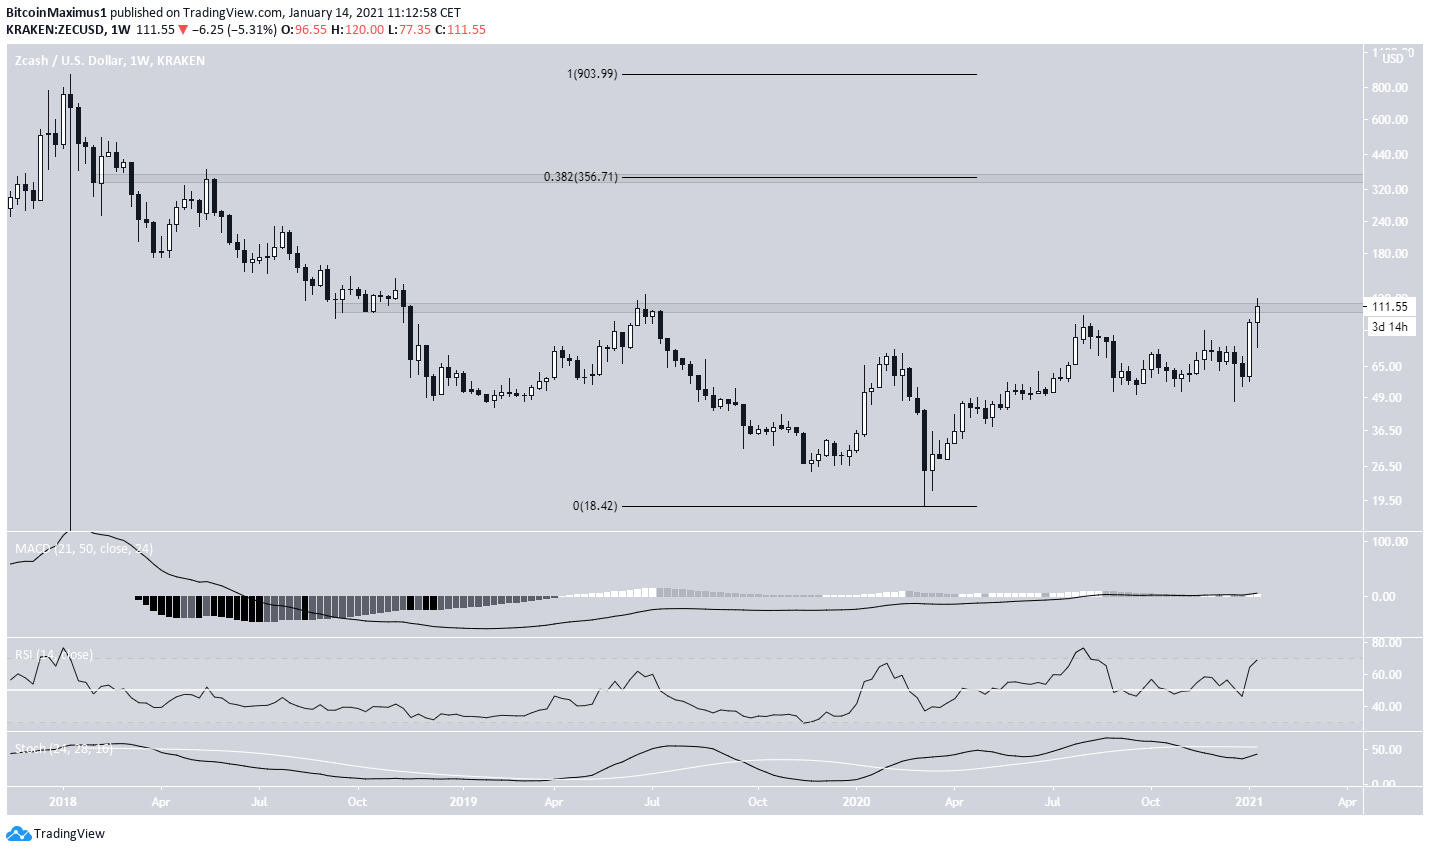
Long-Term Zcash Resistance Levels
ZEC is currently trading inside the $110 resistance area, a resistance level that has been in place since ZEC initially broke down in November 2018. ZEC made an unsuccessful breakout attempt in Jun. 2019 before dropping sharply.
Nevertheless, ZEC has returned to this area once again and technical indicators appear bullish.
If ZEC is able to finally overcome this resistance, the next closest resistance area is found at $356 (0.382 Fib retracement level).
Ongoing Breakout
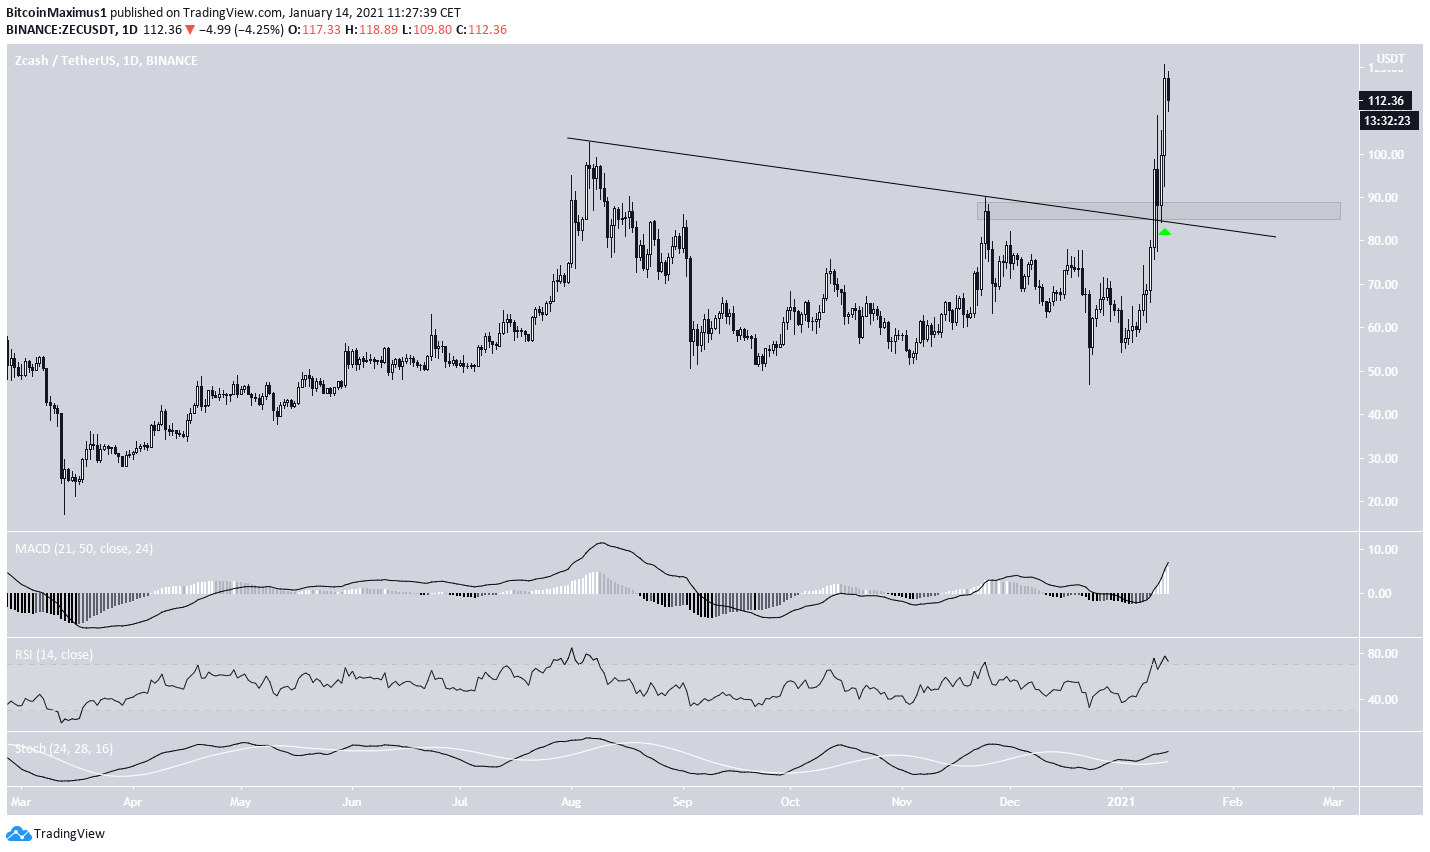
Cryptocurrency trader @CTreets outlined a ZEC chart that shows a breakout from a descending resistance line.

Since the breakout, ZEC has validated the line as support and continued its ascent. The validation level at $87 is now expected to act as support in case ZEC drops.
However, similar to the weekly time-frame, indicators in the daily time-frame are bullish and support the continuation of the upward movement.
ZEC Wave Count
The wave count suggests that ZEC is in an extended wave 3 (shown in white below) of a bullish impulse that began with the March lows.
The minimum target for wave 3 would be at $183, which would give waves 1:3 a 1:1.61 ratio.
However, a more likely target would be at $238, the 2.61 Fib extension of wave 1. This scenario would allow for the whole movement to be completed between $351-$376 — the 0.382 Fib retracement resistance outlined in the first section.
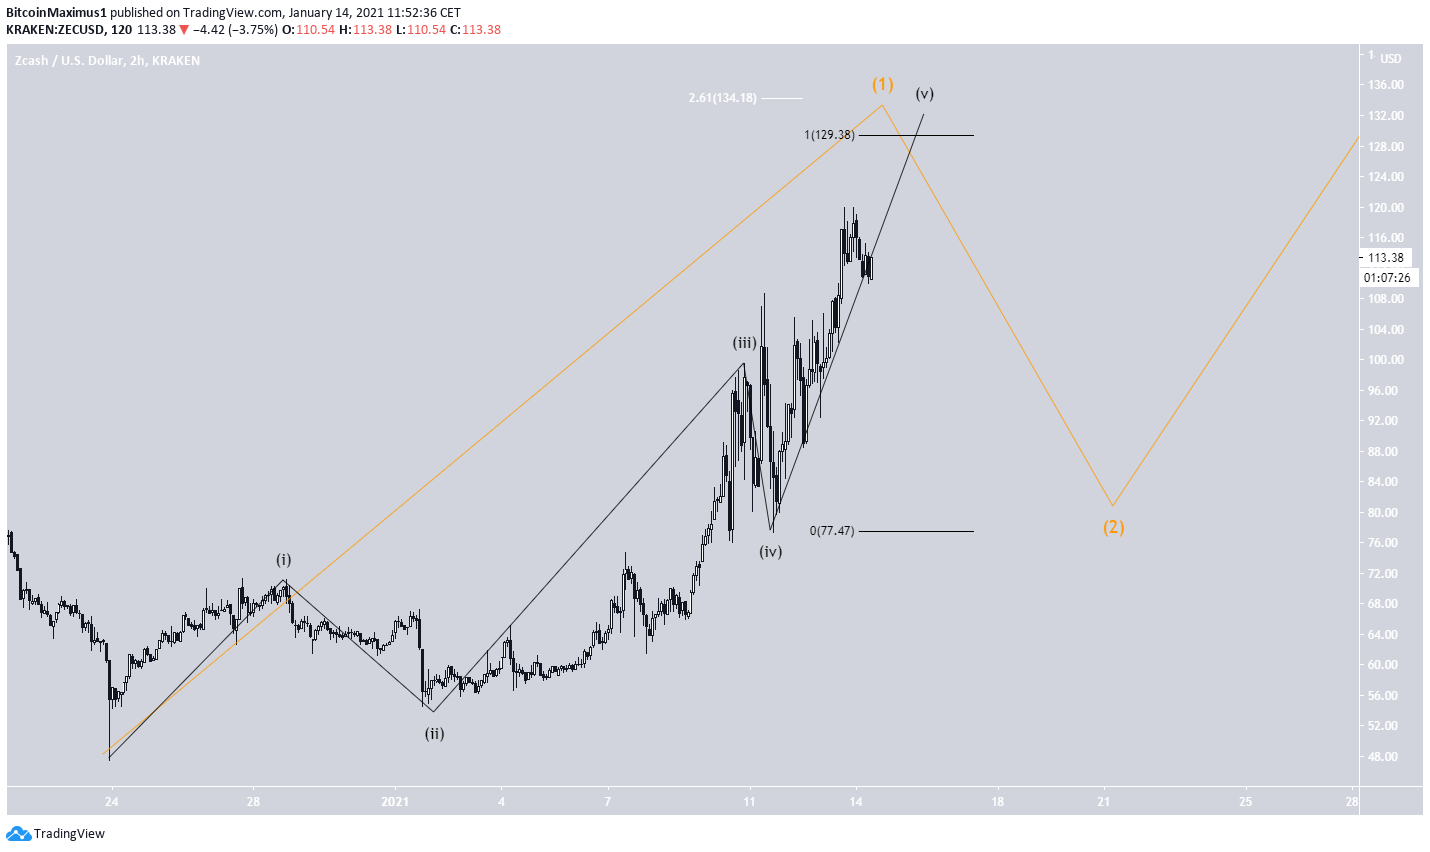
The sub-wave count for the extended wave 3 is given in orange.
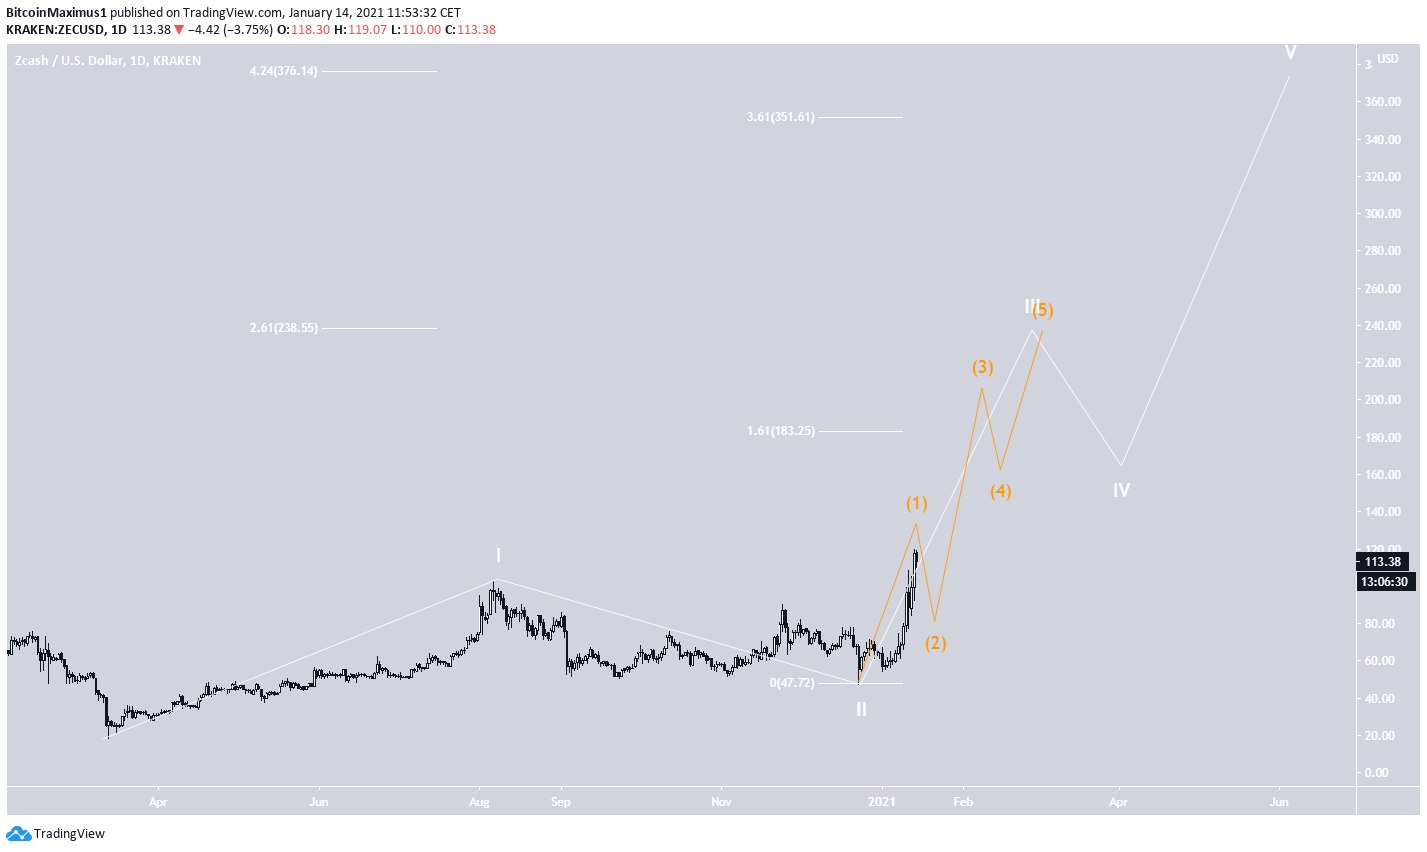
A closer look reveals that ZEC is likely approaching the top of sub-wave 1. This has a target between $129-$134, found by using a combination of Fib projections (black) and external retracements (white).
The minor sub-wave count is shown in black.
Conclusion
Zcash is likely in a long-term bullish trend which could eventually take it to $350.
However, the short-term bullish trend seems to be coming to an end, so an eventual retracement is likely before ZEC resumes any further accelerated upward movement.
For BeInCrypto’s latest Bitcoin (BTC) analysis, click here!
Disclaimer: Cryptocurrency trading carries a high level of risk and may not be suitable for all investors. The views expressed in this article do not reflect those of BeInCrypto.
Trusted
Disclaimer
In line with the Trust Project guidelines, this price analysis article is for informational purposes only and should not be considered financial or investment advice. BeInCrypto is committed to accurate, unbiased reporting, but market conditions are subject to change without notice. Always conduct your own research and consult with a professional before making any financial decisions. Please note that our Terms and Conditions, Privacy Policy, and Disclaimers have been updated.
