
The Zcash price traded flat over the past 24 hours, even as almost $2 billion in crypto positions were liquidated during the sell-off. This makes ZEC one of the few coins that held ground amid the broader market’s decline.
It is still up more than 27% week-on-week, but the next breakout is not guaranteed yet, unless the price clears one important hurdle.
Momentum Signals Reveal The Sell-Off Win, but Risks Are Not Gone
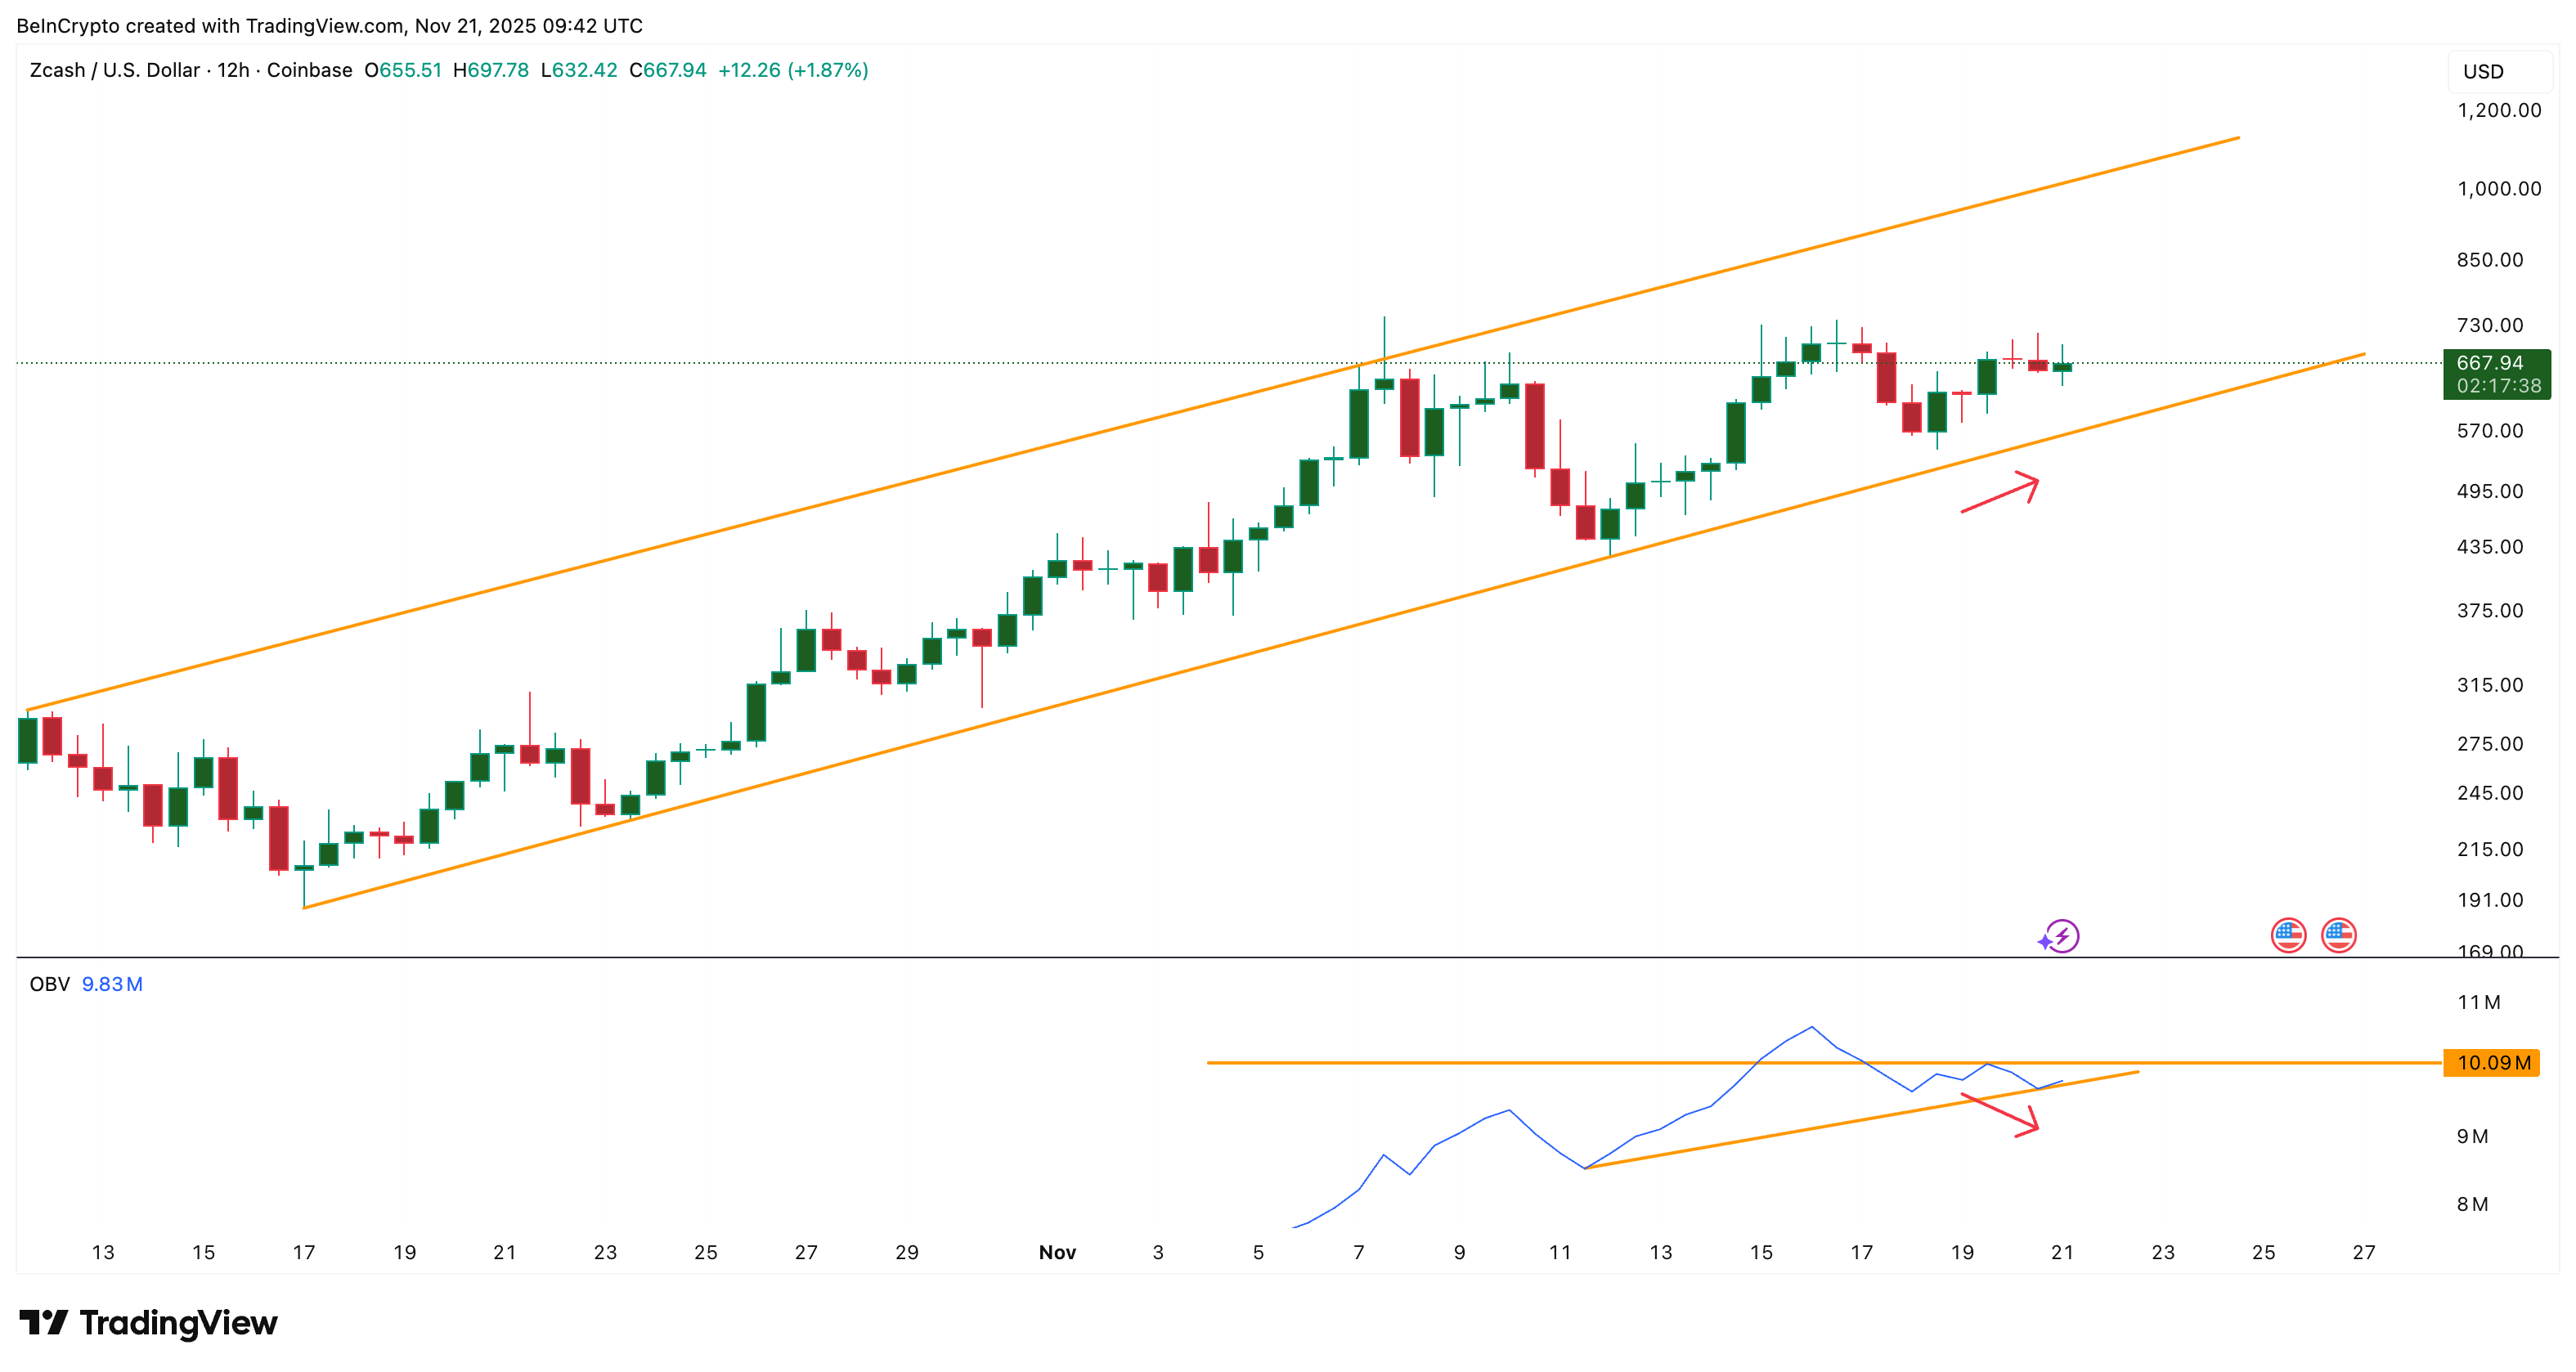
On the 12-hour chart, Zcash continues to move inside a rising channel. The upper trend line has only two touch points, so it can break easily if momentum improves. But the breakout theory did run into some issues during the sell-off, primarily led by three key indicators.
On-Balance Volume (OBV) shows if real demand is supporting the price. Between November 19 and 20, the price made a higher low, but OBV made a lower low.
That kind of bearish divergence weakens a trend. OBV touched the channel support on November 20 and bounced, avoiding a deeper breakdown. But ZEC needs OBV to move above 10.09 million to confirm stronger demand.
Want more token insights like this? Sign up for Editor Harsh Notariya’s Daily Crypto Newsletter here.
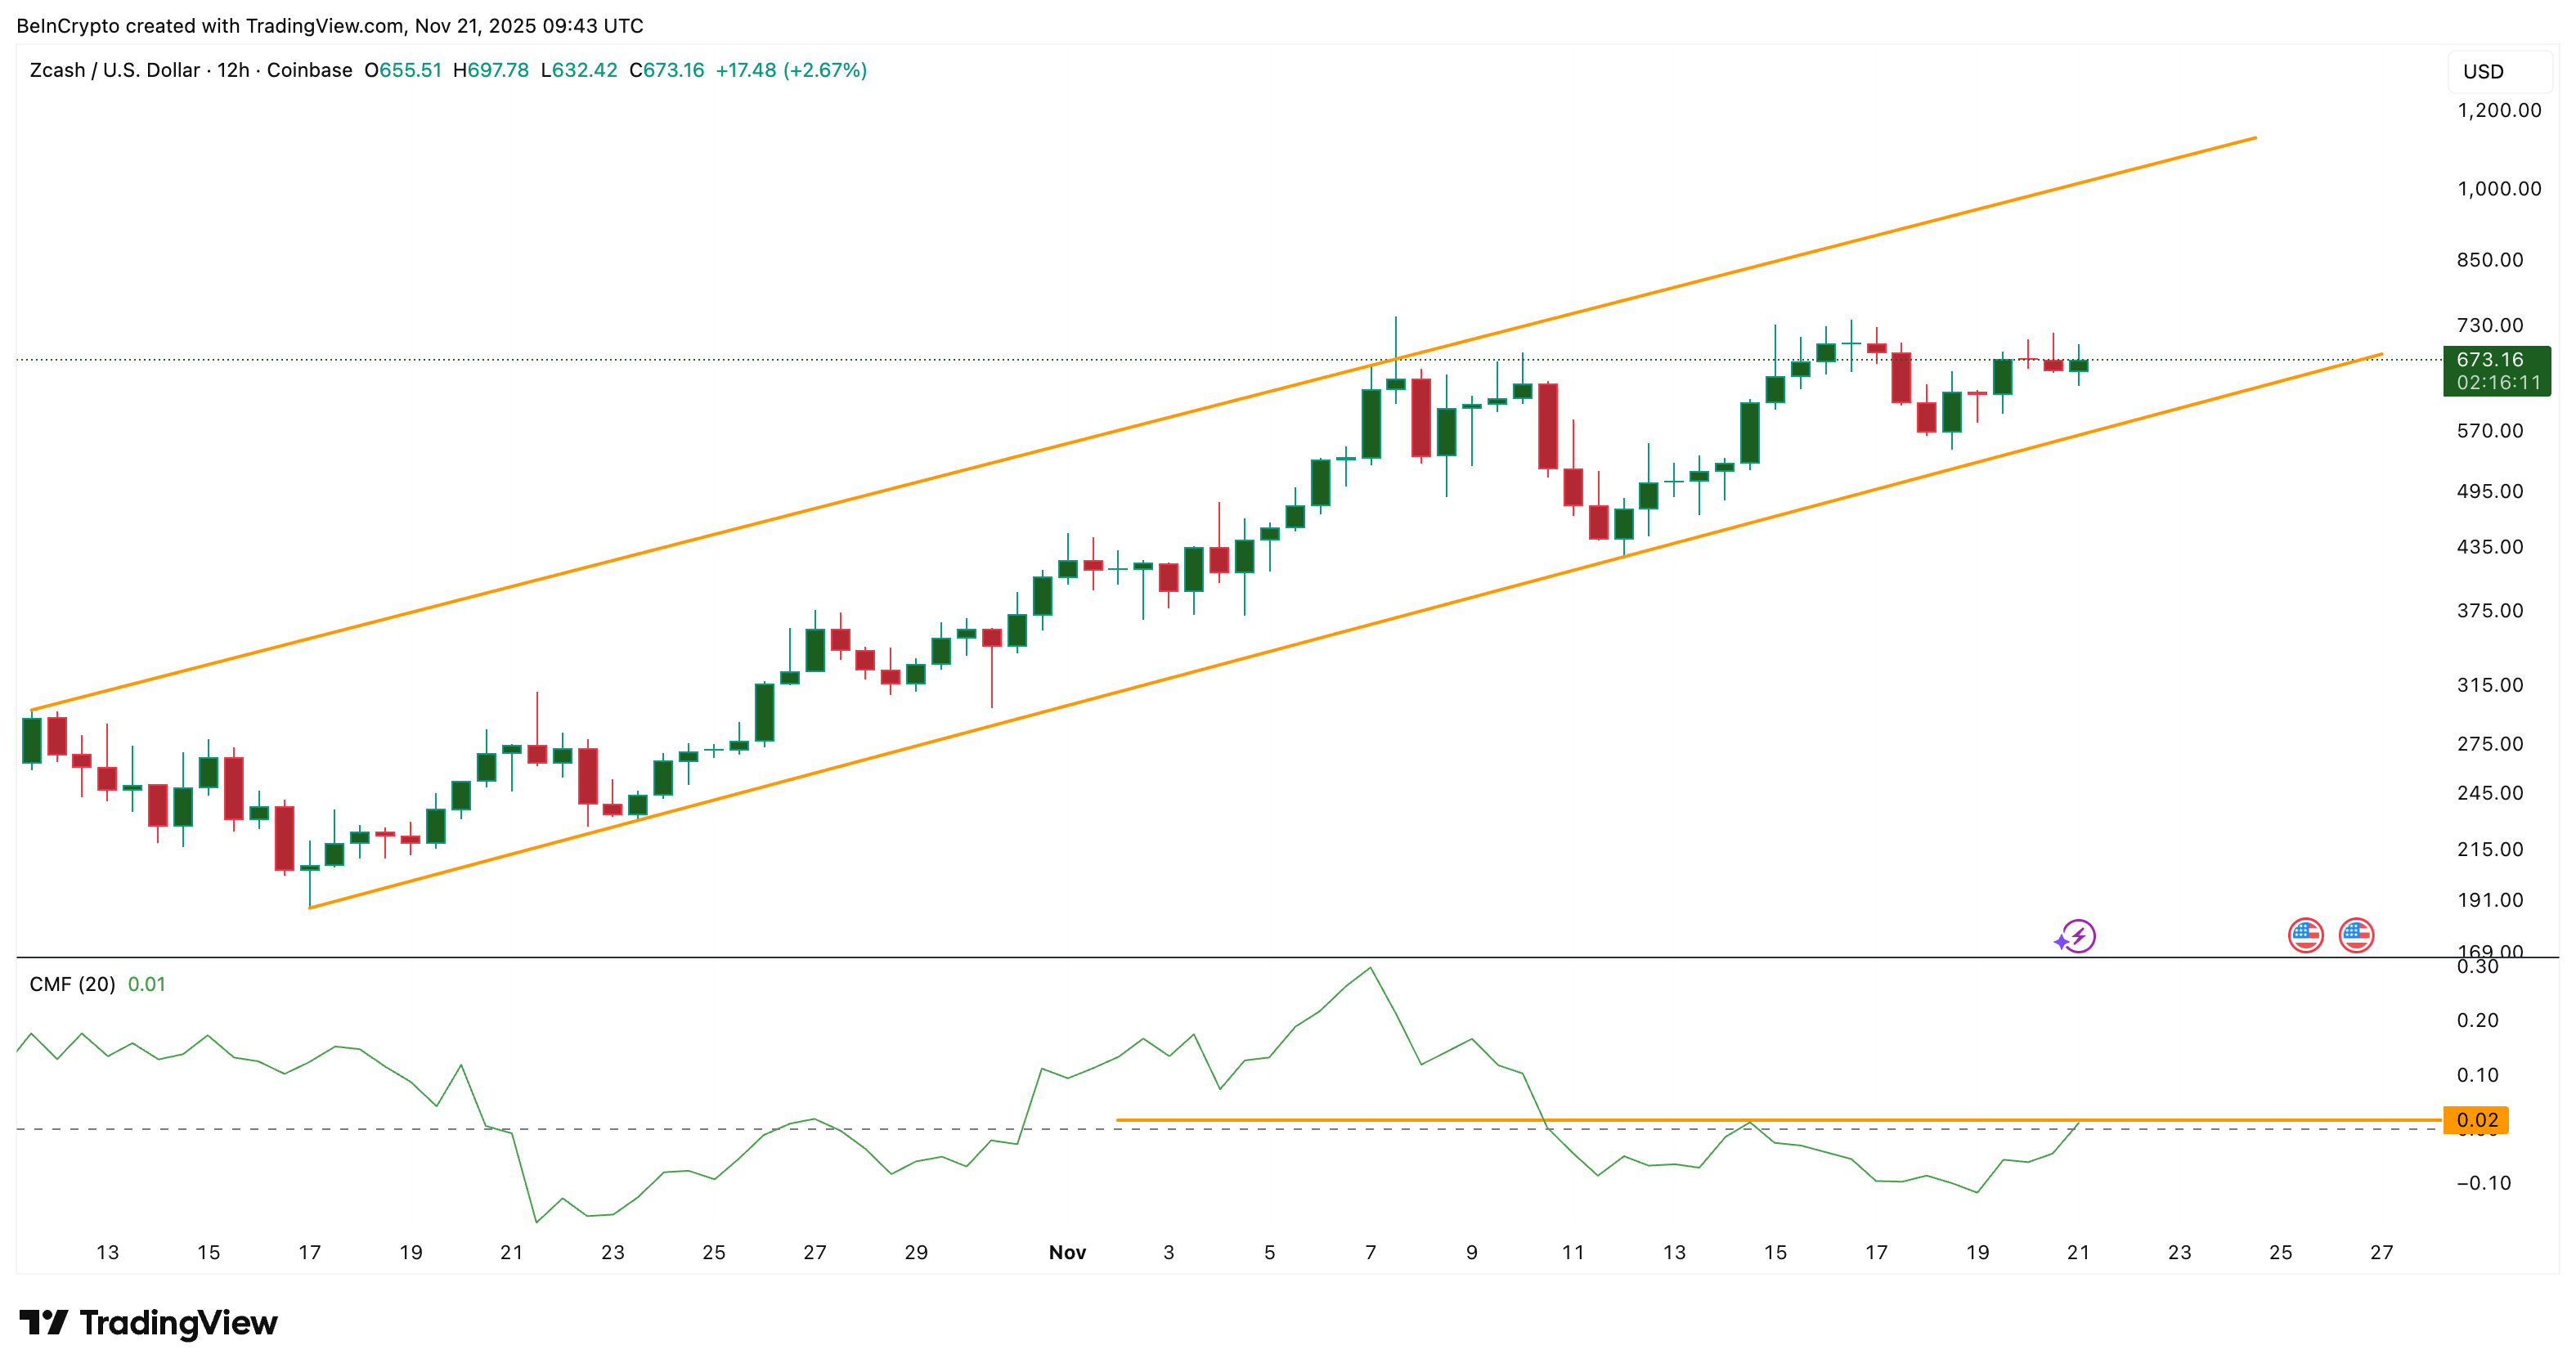
Chaikin Money Flow (CMF), which tracks large wallet inflows, has been falling since November 7, which explains why ZEC failed to break the top of the rising channel.
CMF briefly crossed above zero on November 14 and helped trigger a mid-rally bump. The indicator is now back above the zero line. Yet, a move above 0.02 would be a stronger confirmation that money flow has recovered.
The Relative Strength Index (RSI), the momentum indicator, however, added the main risk.
Between November 10 and 16, the Zcash price made a higher high, but RSI made a lower high. That bearish divergence showed momentum fading while the Zcash price rose.
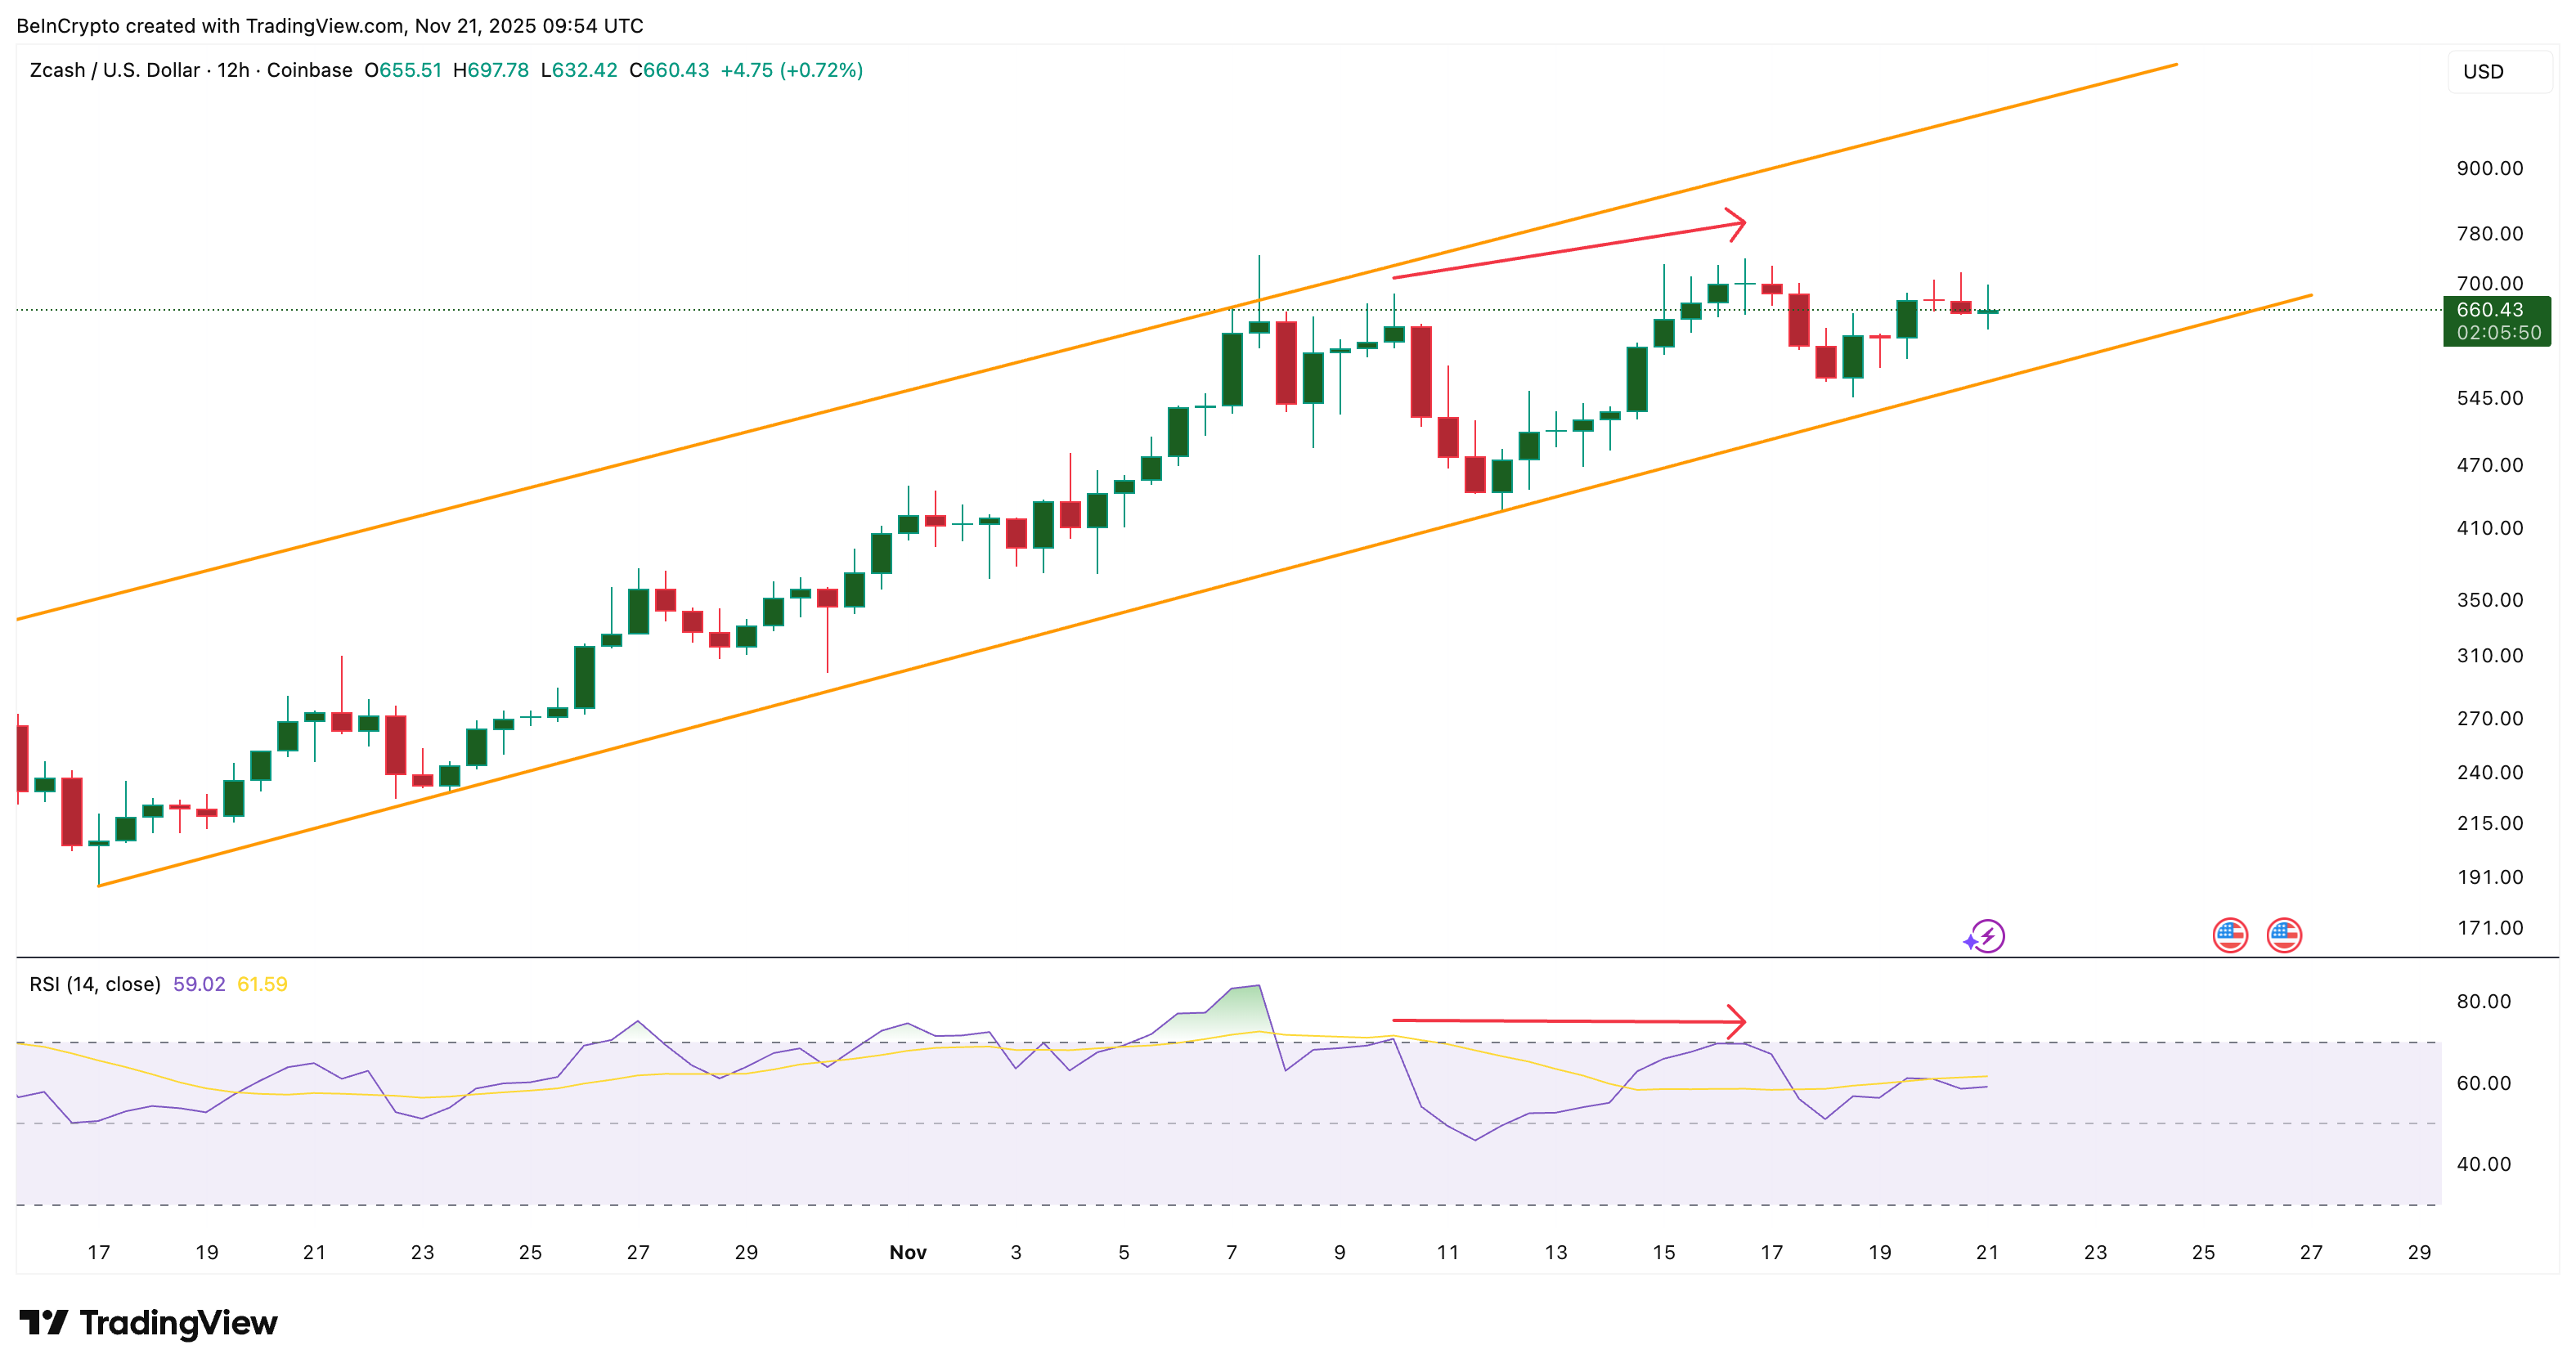
This is also when bears briefly took control, and it matches the OBV and CMF weakness. Now RSI is moving with the price again, showing momentum support coming back. That is why Zcash “barely” beat the sell-off instead of flipping into a deeper reversal.
Zcash Price Levels Show the Breakout War Still Ahead
The Zcash price levels now decide whether bulls can take control of the breakout war.
The first major barrier is $766, the first breakout target. This is the trend-based extension zone before which ZEC stalled earlier. Clearing $766 would show the first real shift in momentum.
If ZEC breaks $766, the next key target is $978. That level also represents the breakout possibility of the rising channel itself. A clean move above $978 would open the path toward four-digit prices.
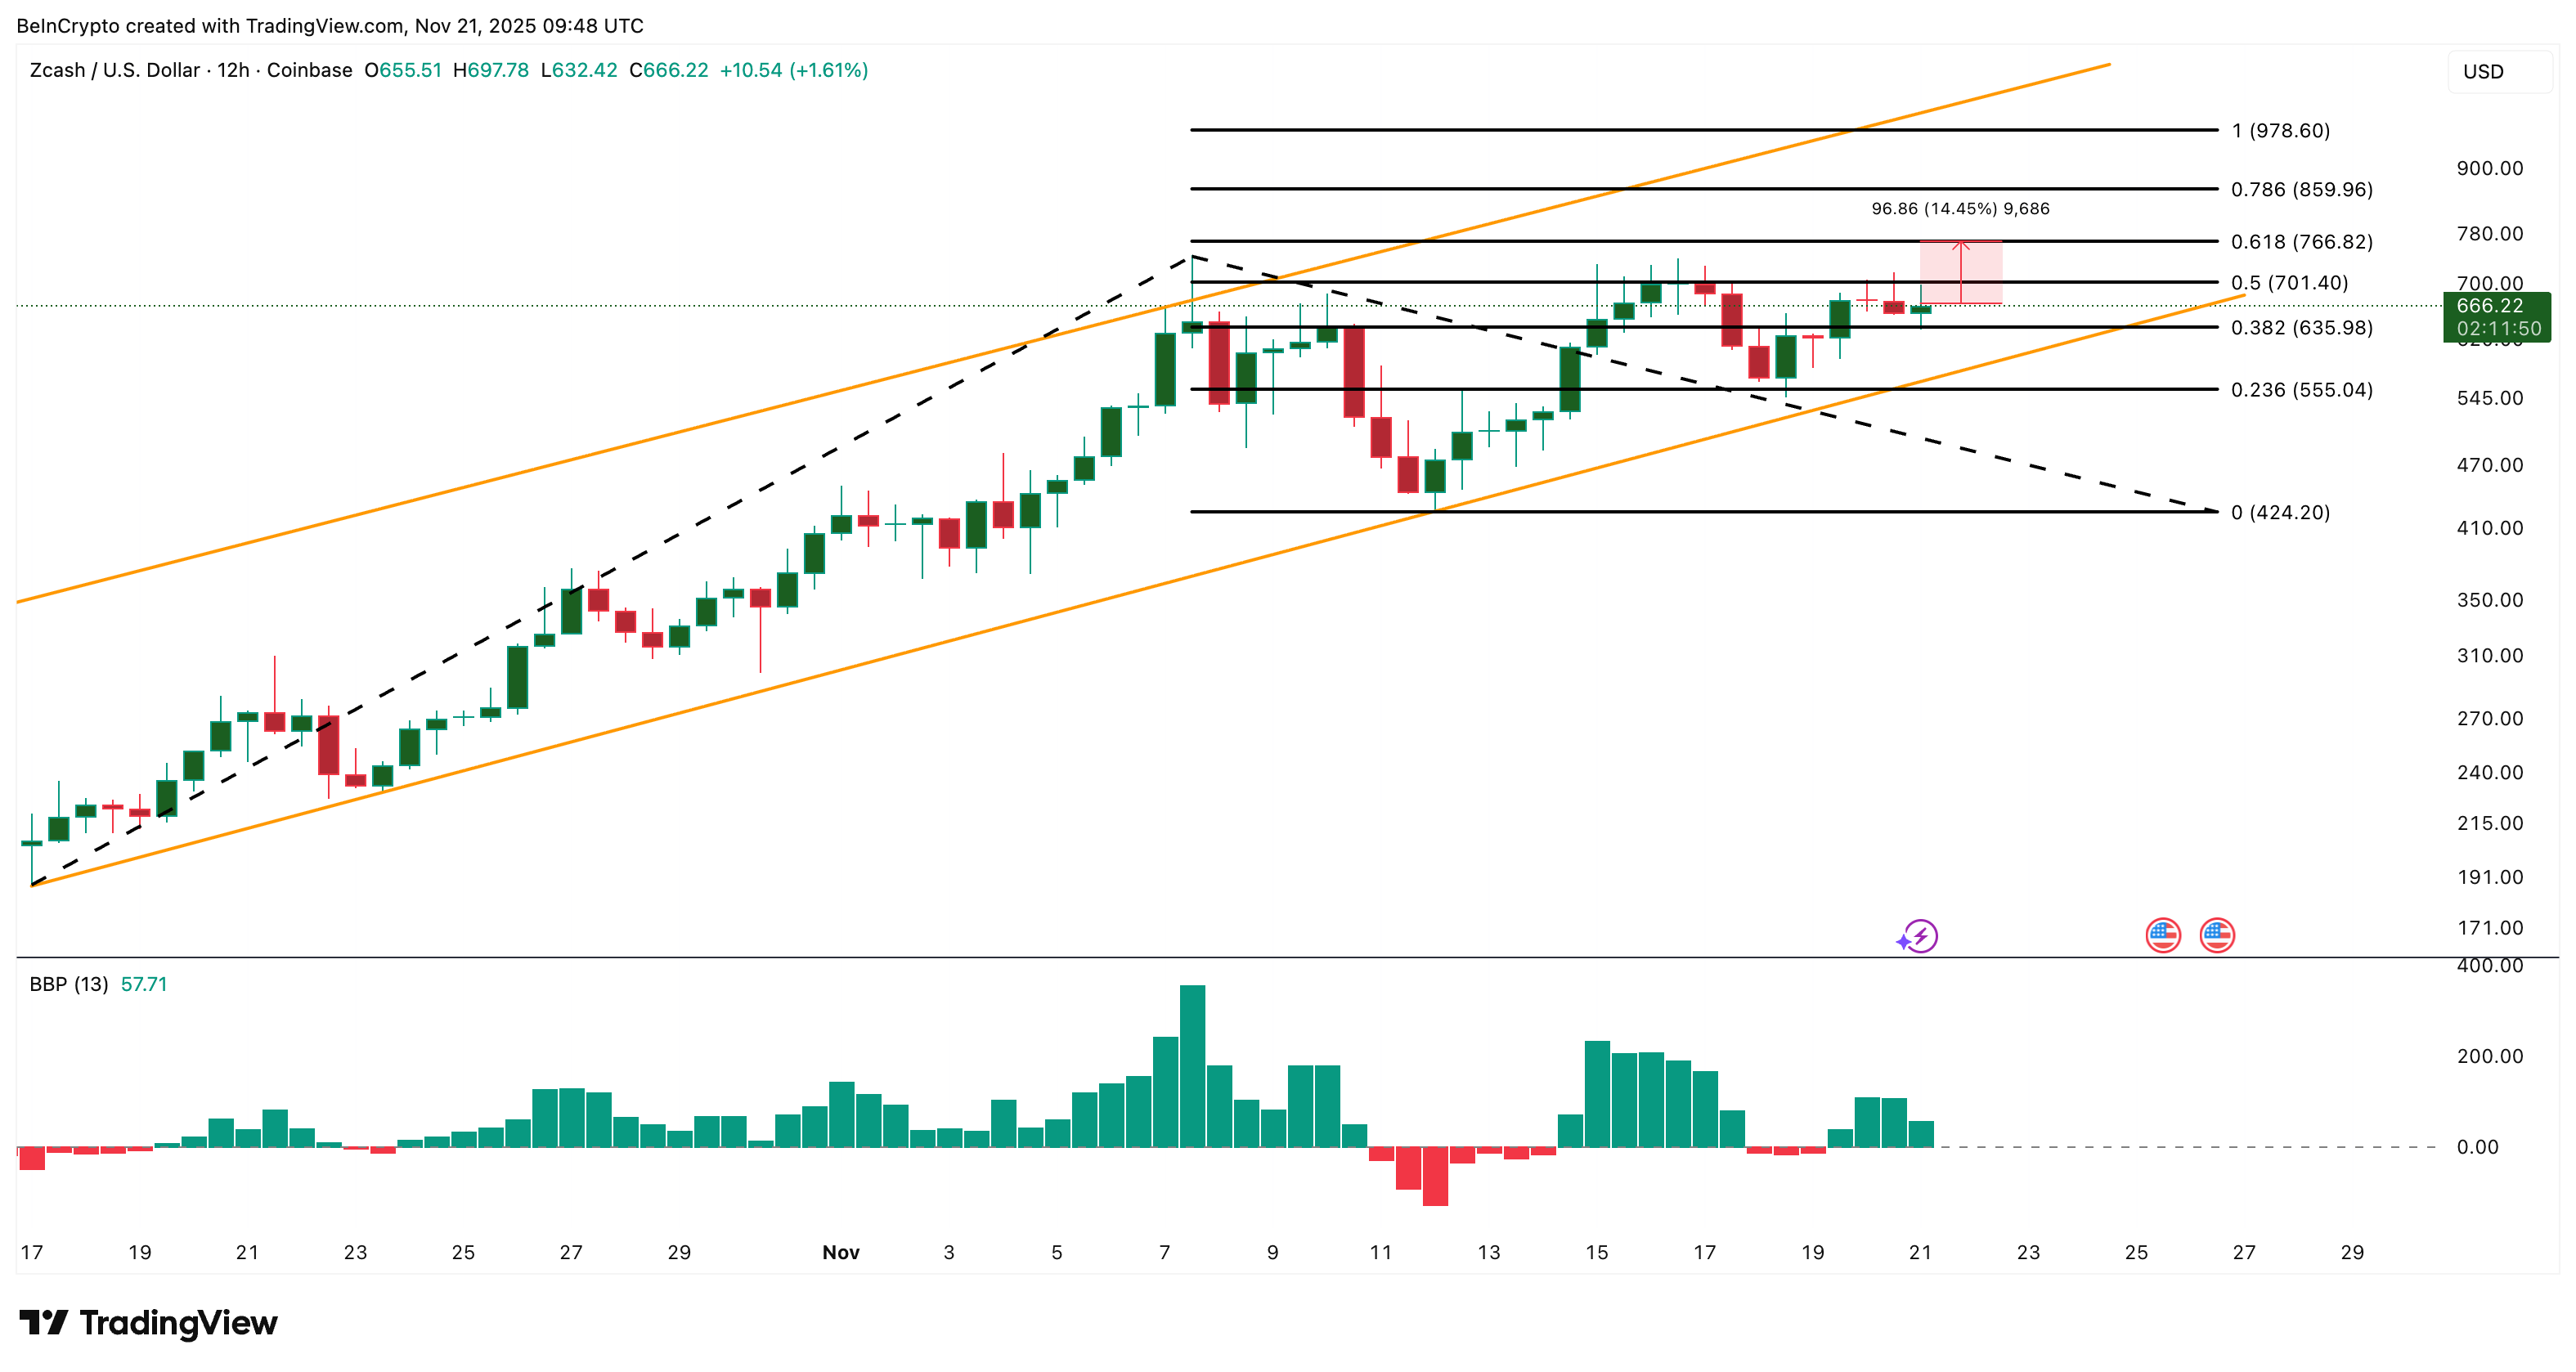
On the downside, $635 is the first support. Losing it exposes $555. A drop under $555 would push ZEC out of the rising channel and turn the trend neutral. This is where the bull-bear power indicator matters.
The bull-bear power indicator compares price to a basic trend value to show who is controlling short-term strength. Post the RSI divergence (10–16 November), bears briefly took control, matching the mid-channel pullback.
But the indicator has flipped back into the positive zone now, which means bulls are in control again. Because bulls now lead on the bull-bear power indicator, the breakout war intensifies above $766. If the Zcash price breaks $766 while bull-bear power stays positive, Zcash gets a real chance to attack $978, the key breakout level that would decide the next leg of the trend.
