

The DFI.money (YFII) price has broken out from the $2,500 resistance area but is currently returning to validate it as support.
Despite the ongoing short-term decline, the trend is still likely to be bullish and should continue moving upward.
YFII Breakout From Resistance
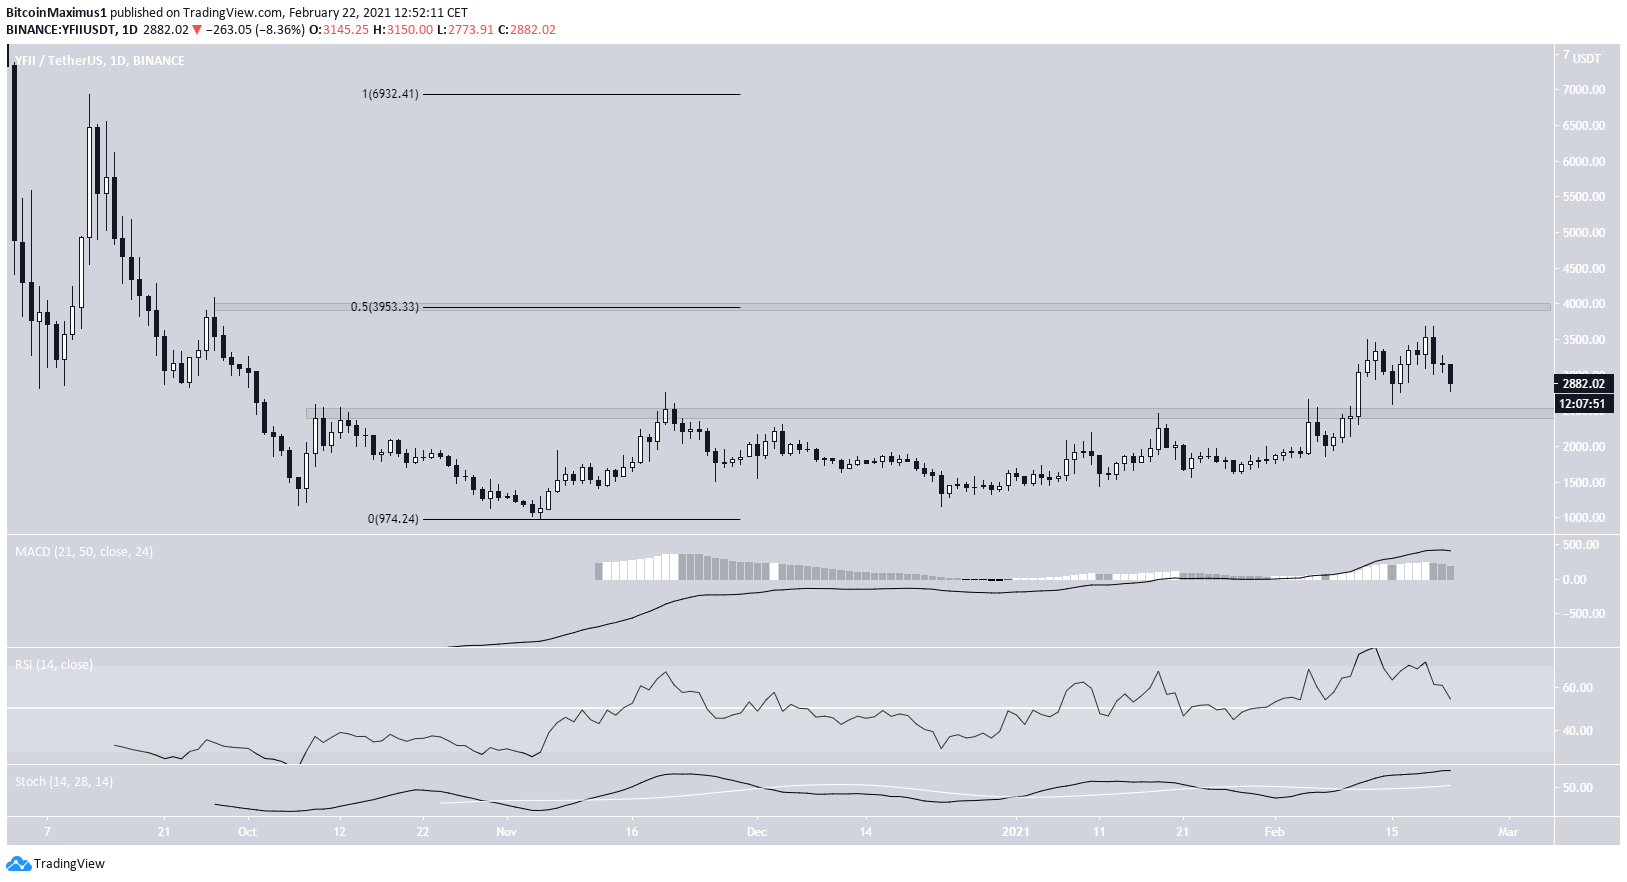
Since breaking down on Oct. 2020, YFII had been trading below the $2,500 resistance area, having made four unsuccessful breakout attempts.
However, YFII successfully moved above this level on Feb. 11, reaching a high of $3,682 several days later. Nevertheless, the highs could not be sustained, and YFII has been moving downwards since and is close to validating the $2,500 area as support.
Despite the loss of momentum evident by the decreasing RSI and MACD, the Stochastic oscillator has made a bullish cross. The RSI is still above 50, and the MACD is above 0, indicating that the trend is still bullish.
Short-Term Movement
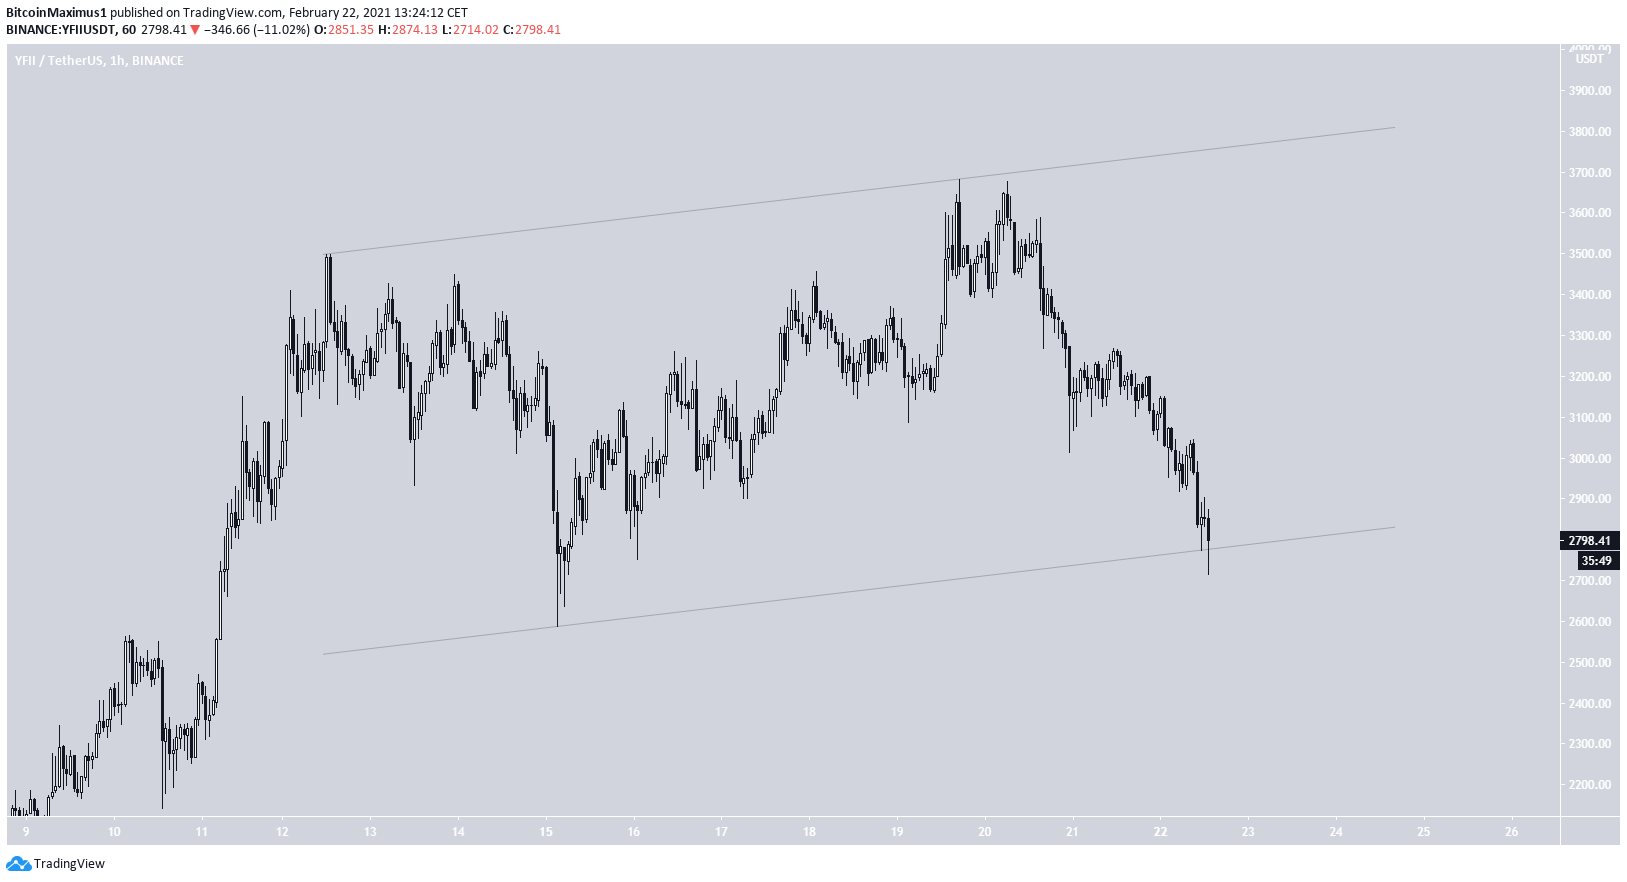
Cryptocurrency trader @TradingTank outlined a YFII chart, stating that it looks ready to move upwards after breaking the $3,500 resistance area.
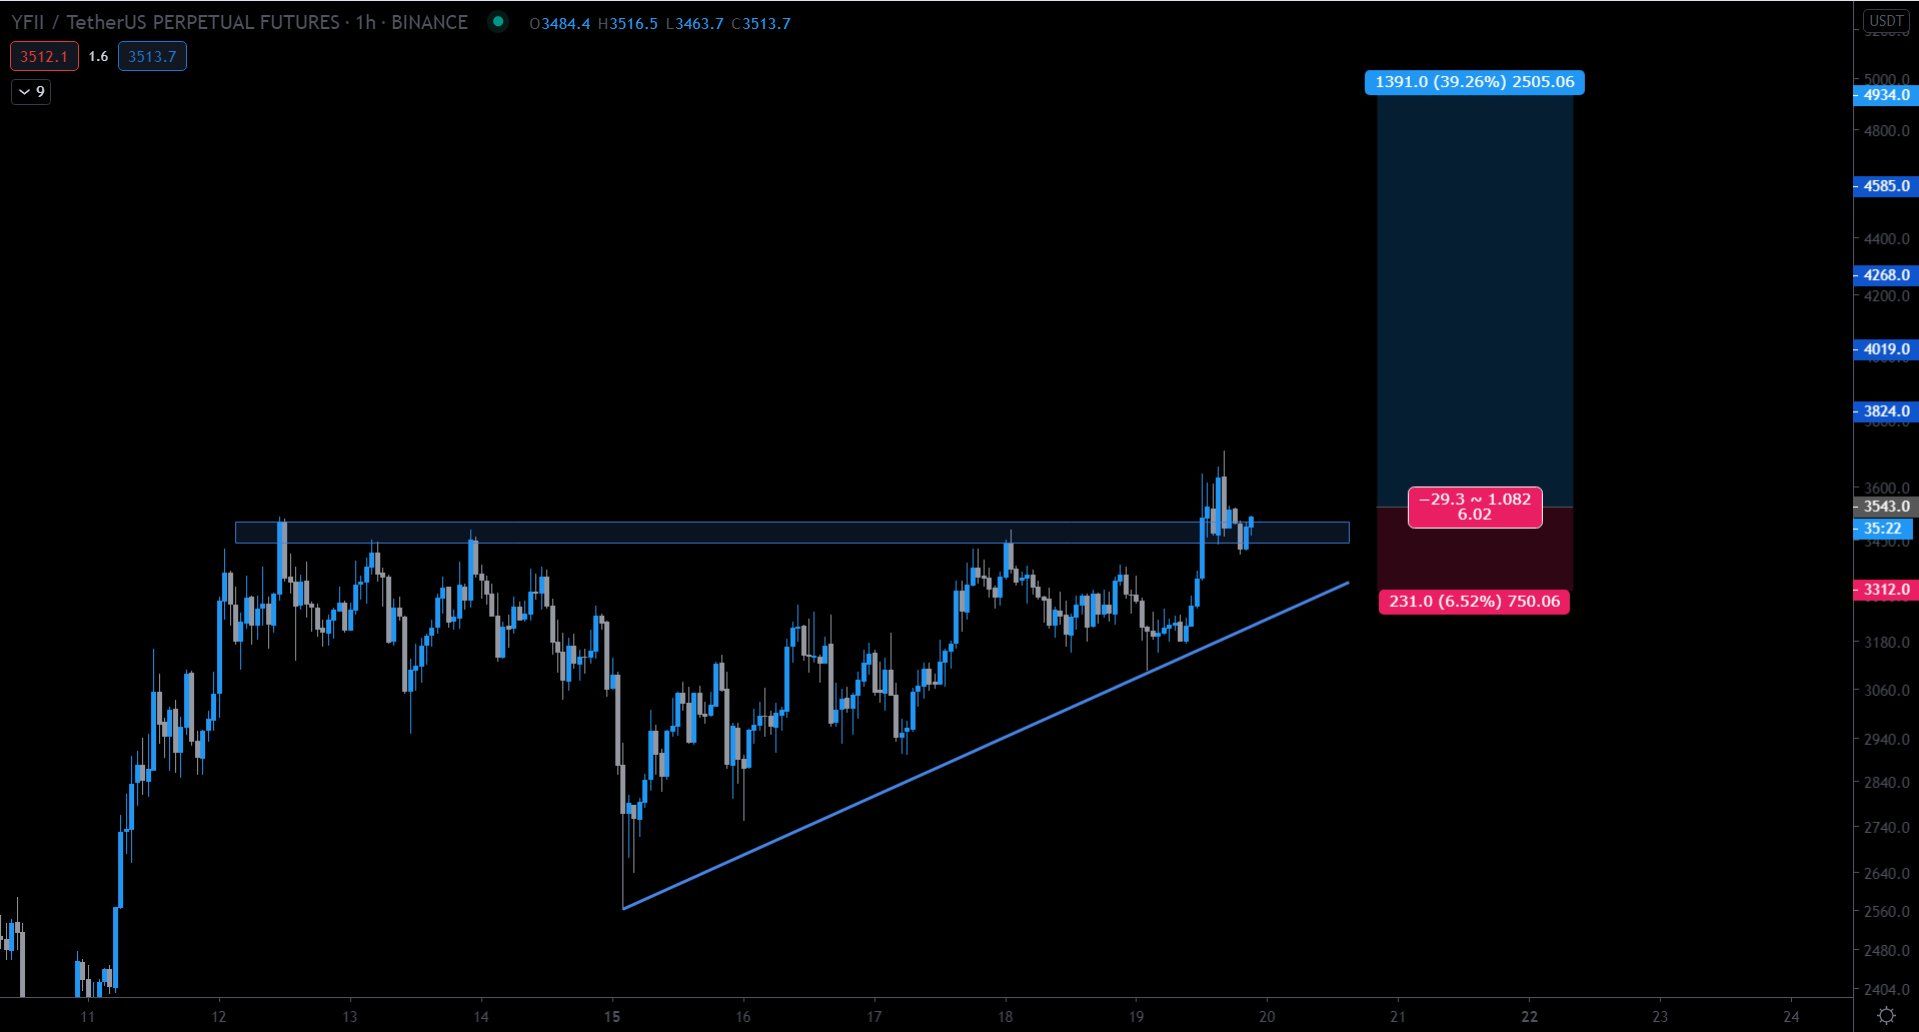
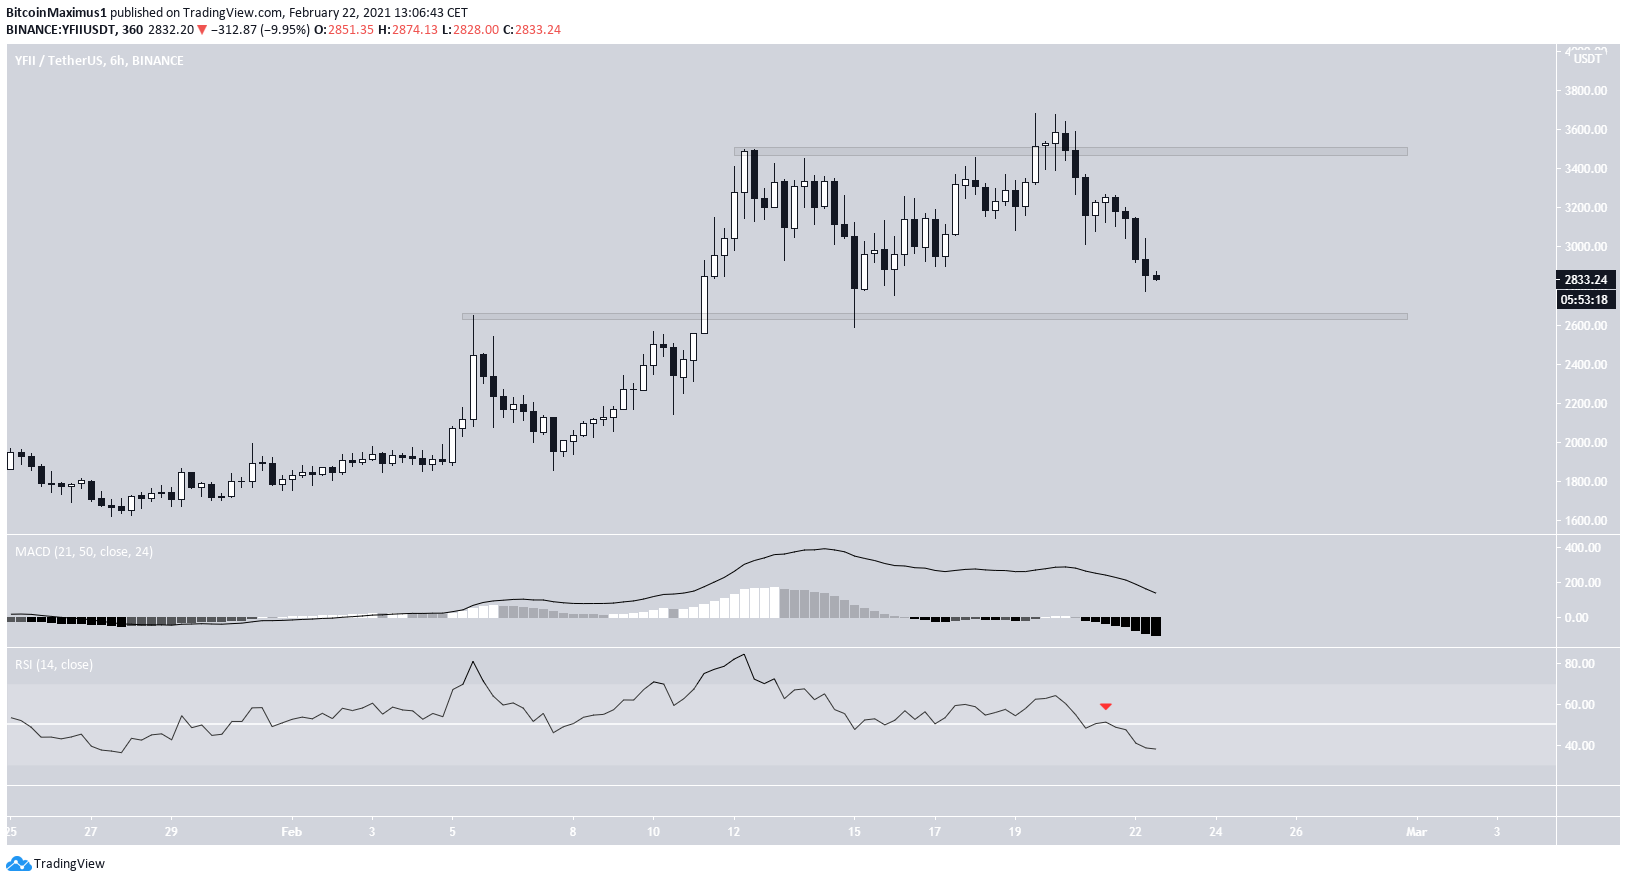
However, since the tweet, YFII has actually fallen, created a double top pattern, and has been moving downwards since.
It is now approaching the closest minor support area at $2,650. Both the short-term MACD and the RSI are decreasing, indicating that it is likely to reach the area.
YFII Wave Count
The wave count suggests that YFII is in wave three (white) of a bullish impulse that began on Nov. 2020. The sub-wave count is in orange, suggesting that it has just completed or is in the process of completing sub-wave four.
The most likely target for the top of the move is at $5,360, found by the external retracement of wave two and a Fib extension on sub-wave one. A decline below the sub-wave one high at $2,084 would invalidate this particular wave count.
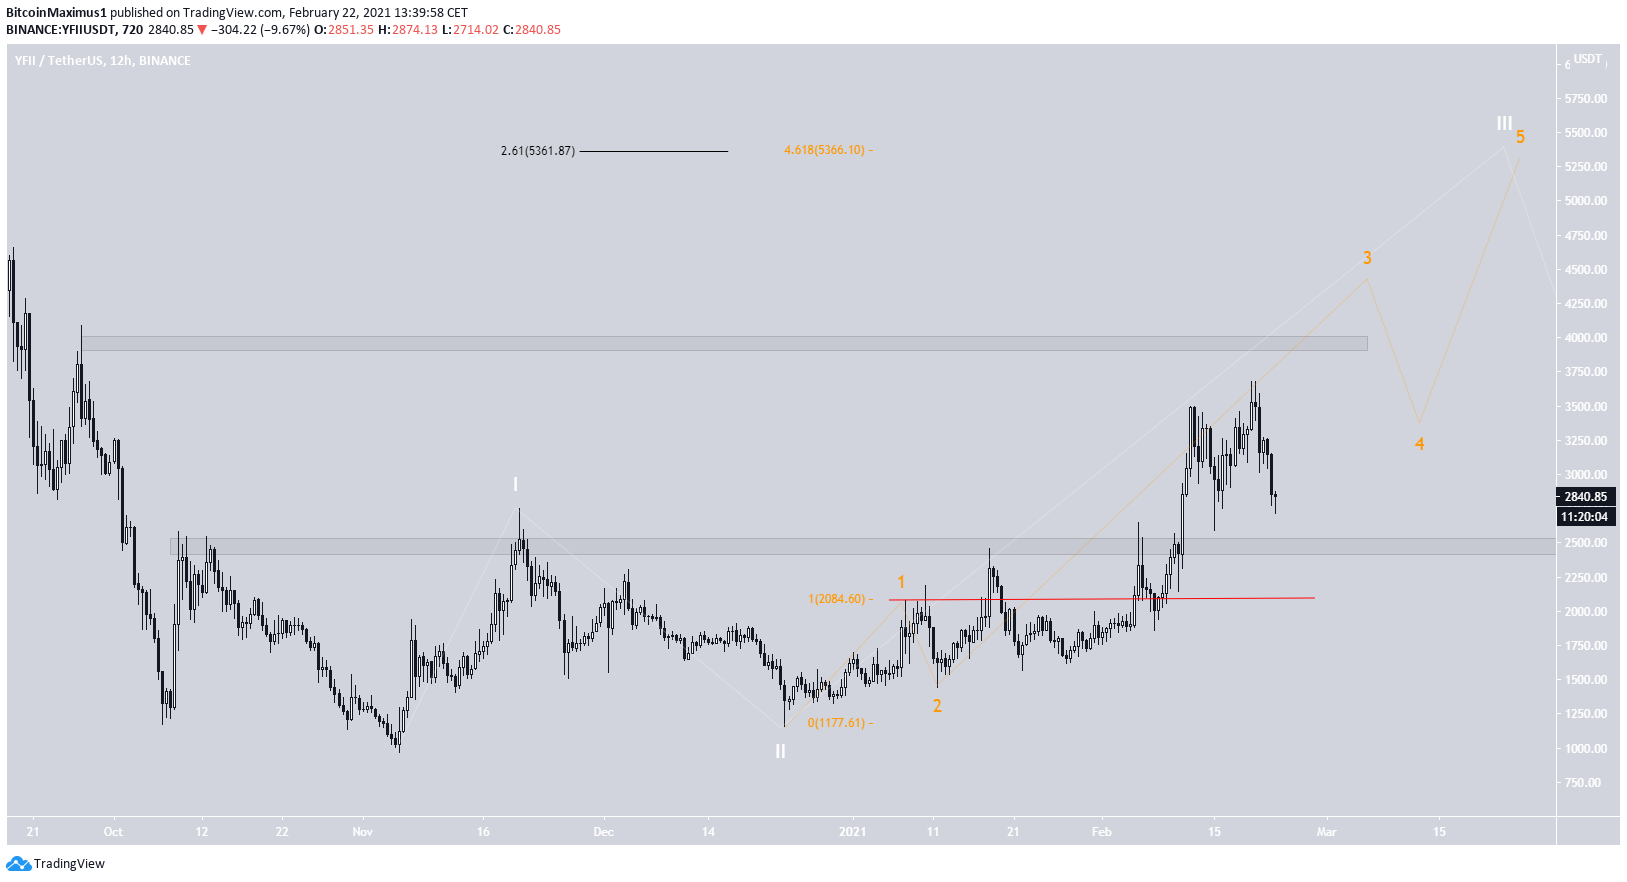
The move so far has been perfectly contained inside an ascending parallel channel, so this may be a running flat correction that just completed sub-wave four.
Conclusion
To conclude, YFII should complete its correction soon, potentially validating the $2,500 area once more before moving upwards towards $3,950 and possibly higher.
For BeInCrypto’s latest Bitcoin (BTC) analysis, click here
Disclaimer
In line with the Trust Project guidelines, this price analysis article is for informational purposes only and should not be considered financial or investment advice. BeInCrypto is committed to accurate, unbiased reporting, but market conditions are subject to change without notice. Always conduct your own research and consult with a professional before making any financial decisions. Please note that our Terms and Conditions, Privacy Policy, and Disclaimers have been updated.
