


Yearn.Finance (YFI) has fallen back from the $30,000 resistance area but is gearing up for another breakout attempt.
The DFI.Money (YFII) price is consolidating inside a symmetrical triangle, from which a breakout is likely.
YFI Gets Rejected
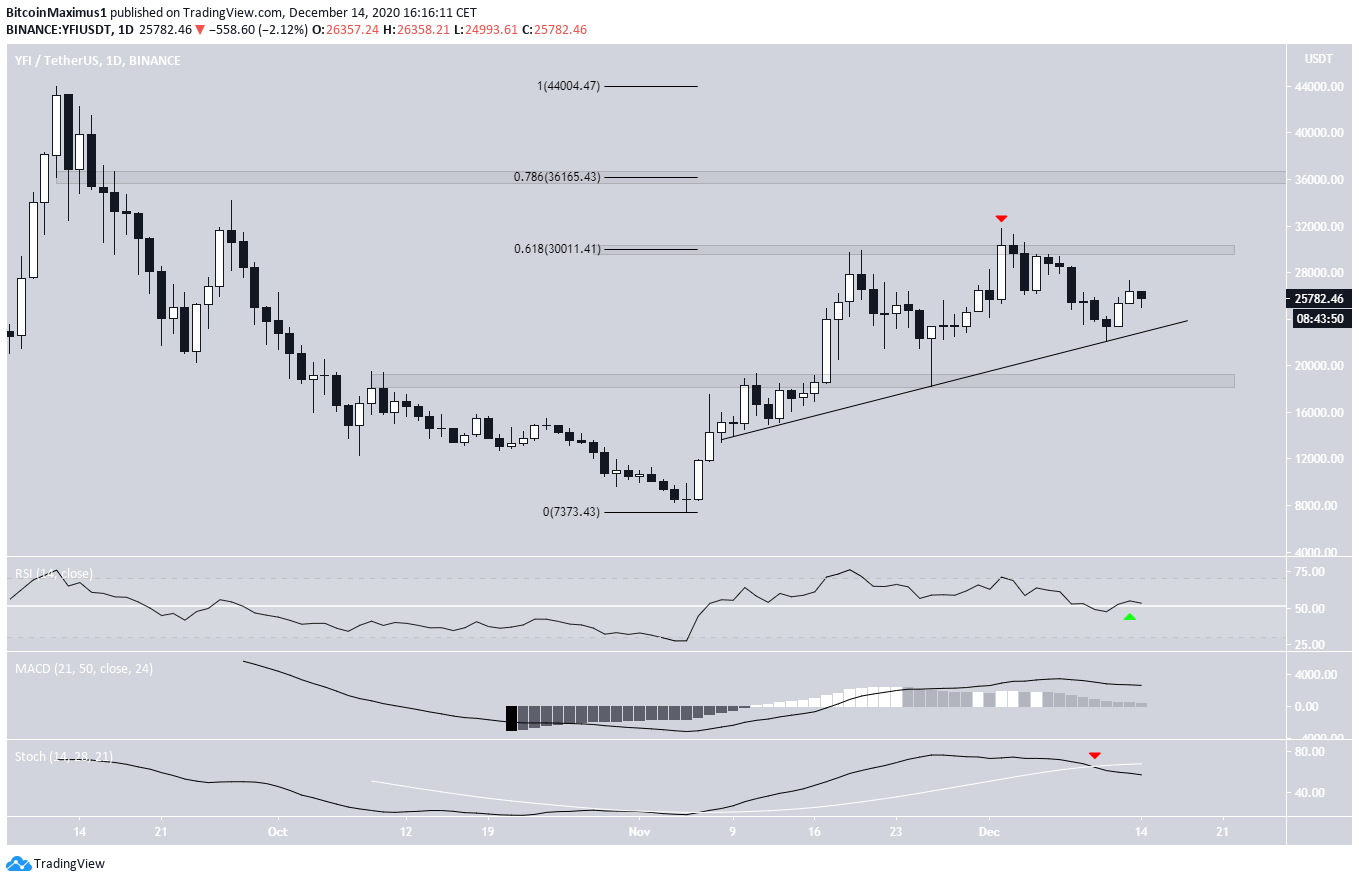
On Dec.2, the YFI price reached a high of $31,781. It was the second time over the past two weeks that it had reached a high above $30,000, which is an important resistance area created by the 0.618 Fib retracement level of the most recent decline.
Since then, YFI has been moving downwards. On Dec. 11, YFI validated an ascending support line and has been moving upwards since. As long as it continues to follow this line, YFI should attempt another breakout.
Technical indicators are mixed. The RSI is bullish, the MACD is neutral, and the Stochastic Oscillator is bearish.
If YFI were to break down from the ascending support line, the closest support area would be at $18,500. On the other hand, a breakout would take YFI towards the next resistance area at $36,165.
Future Movement
Cryptocurrency trader @Daancrypto outlined a YFI chart, stating that it has already broken out from a descending resistance line and re-tested it. He expects a continuation of the upward move.
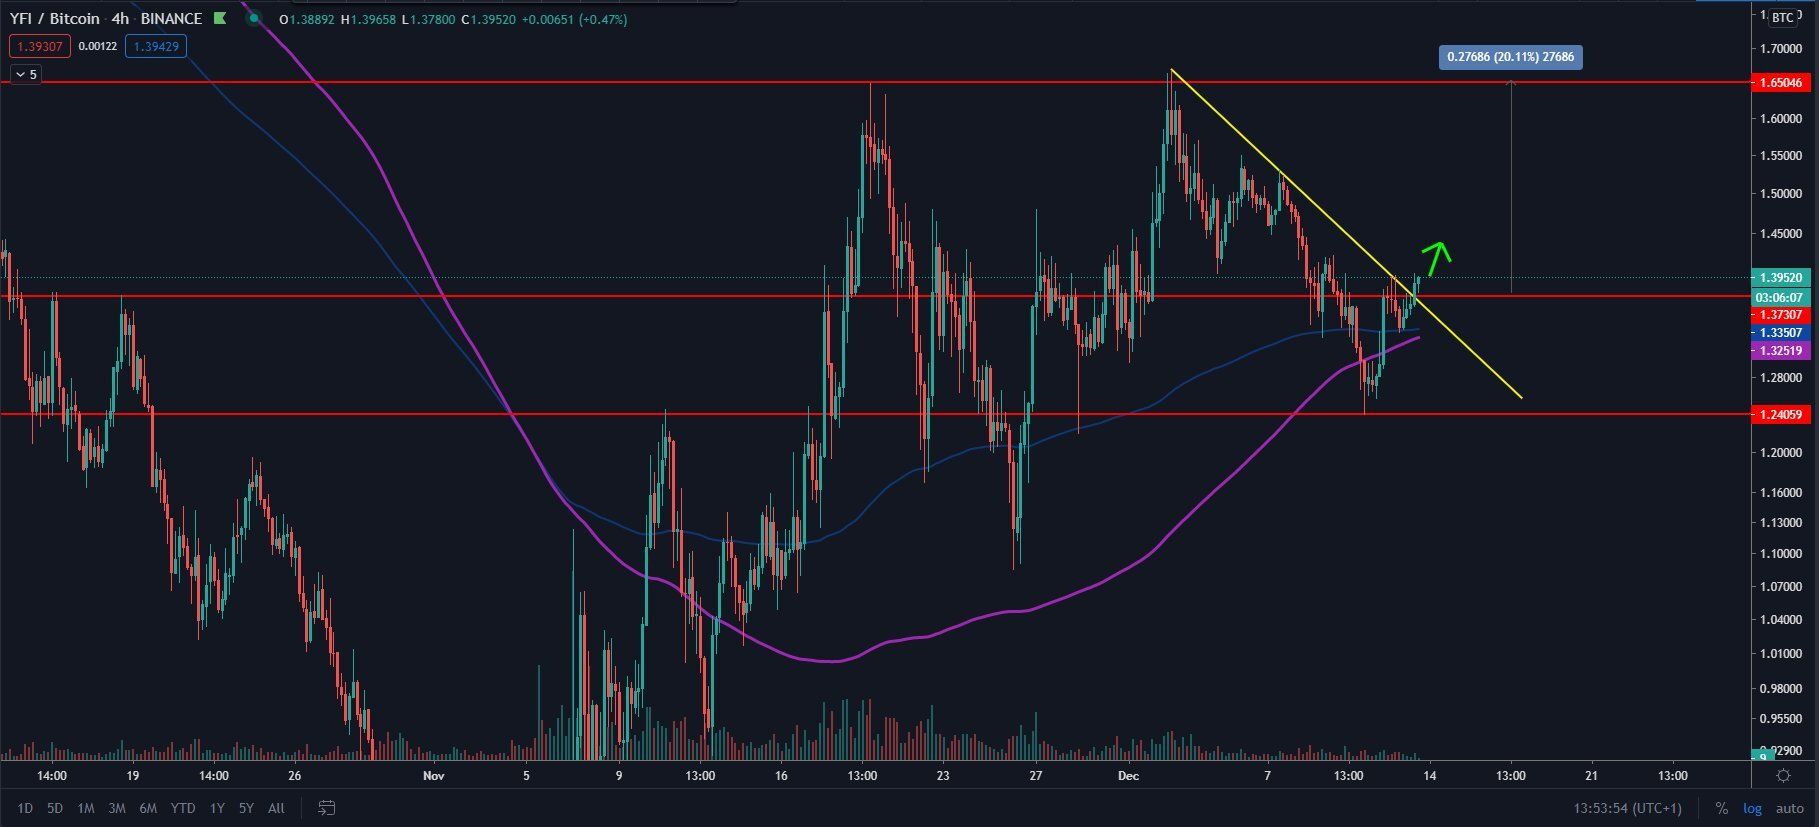
YFI has indeed broken out from a short-term descending resistance line (dashed) and has validated it as support. This suggests that YFI will make another breakout attempt.
If it continues moving upwards, the closest minor resistance area would be at $28,400.

YFII Consolidates Inside Triangle
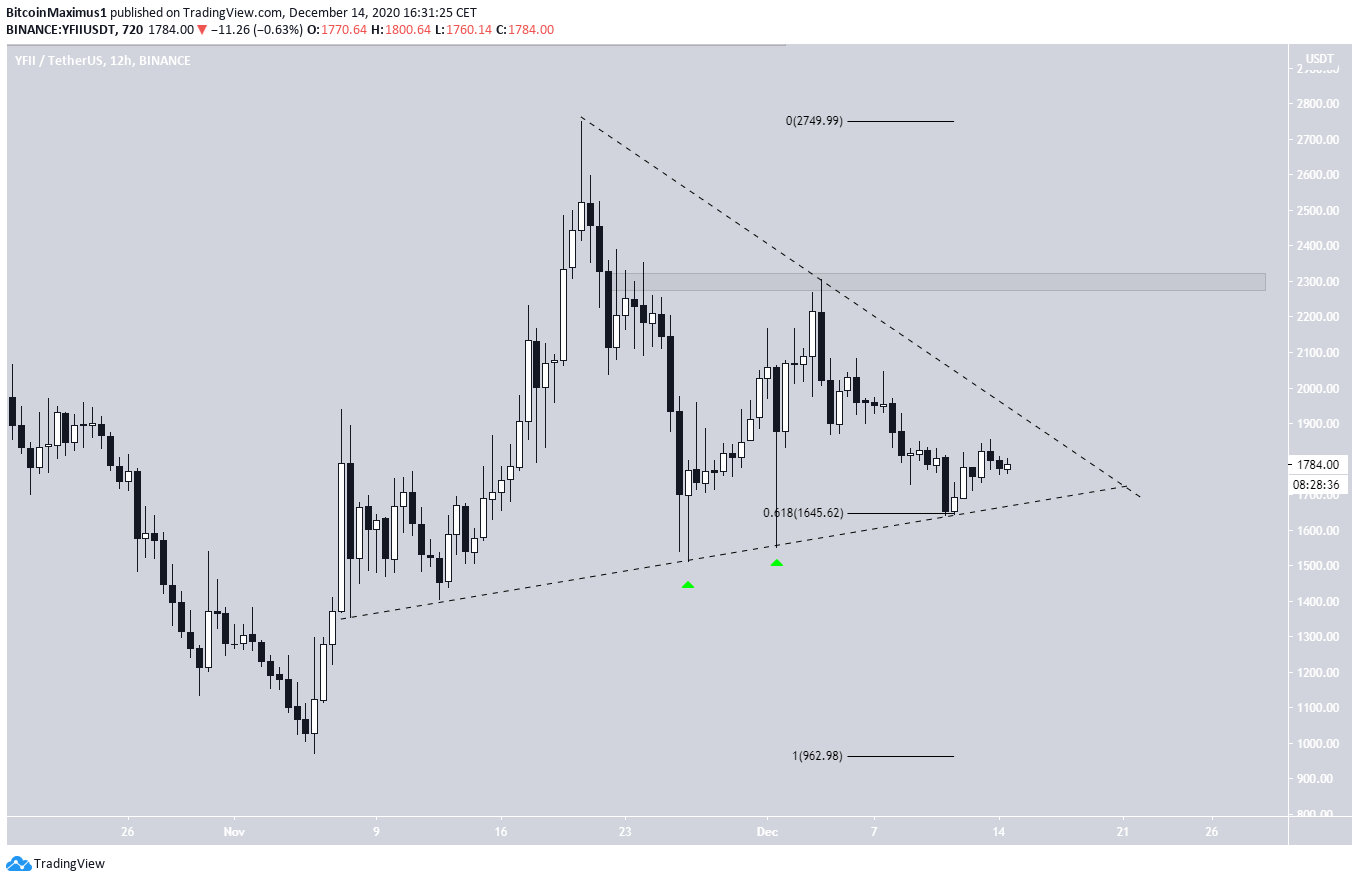
The YFII price has been declining since reaching a high of $2,750 on Nov. 21. Since then, it has been trading inside a symmetrical triangle.
Although the triangle is a neutral pattern, there are a few bullish signs, namely the two very long lower wicks (shown with the green arrows below). The wicks touched the support line of the triangle and are signs of buying pressure.
In addition, YFII has not managed to reach a close below the 0.618 Fib retracement level, rather bouncing each time it touched it.
Therefore, YFII should break out from the triangle and move towards the $2,300 resistance area and possibly higher.
Conclusion
To conclude, the YFI price could possibly soon make another breakout attempt, this time successfully. While YFII is also likely to break out from its symmetrical triangle, it has not given any bullish reversal signs yet.
For BeInCrypto’s latest Cardano (ADA) analysis, click here!
Disclaimer: Cryptocurrency trading carries a high level of risk and may not be suitable for all investors. The views expressed in this article do not reflect those of BeInCrypto.


