


The price of the Yearn. Finance Token (YFI) has regained the majority of its losses from last week’s drop, but its structure still looks corrective.
On the other hand, the DFI.Money (YFII) price has struggled to retrace since the drop, indicating that its prospects for an upward movement are weak.
YFI – Hammer Re-Tests Support
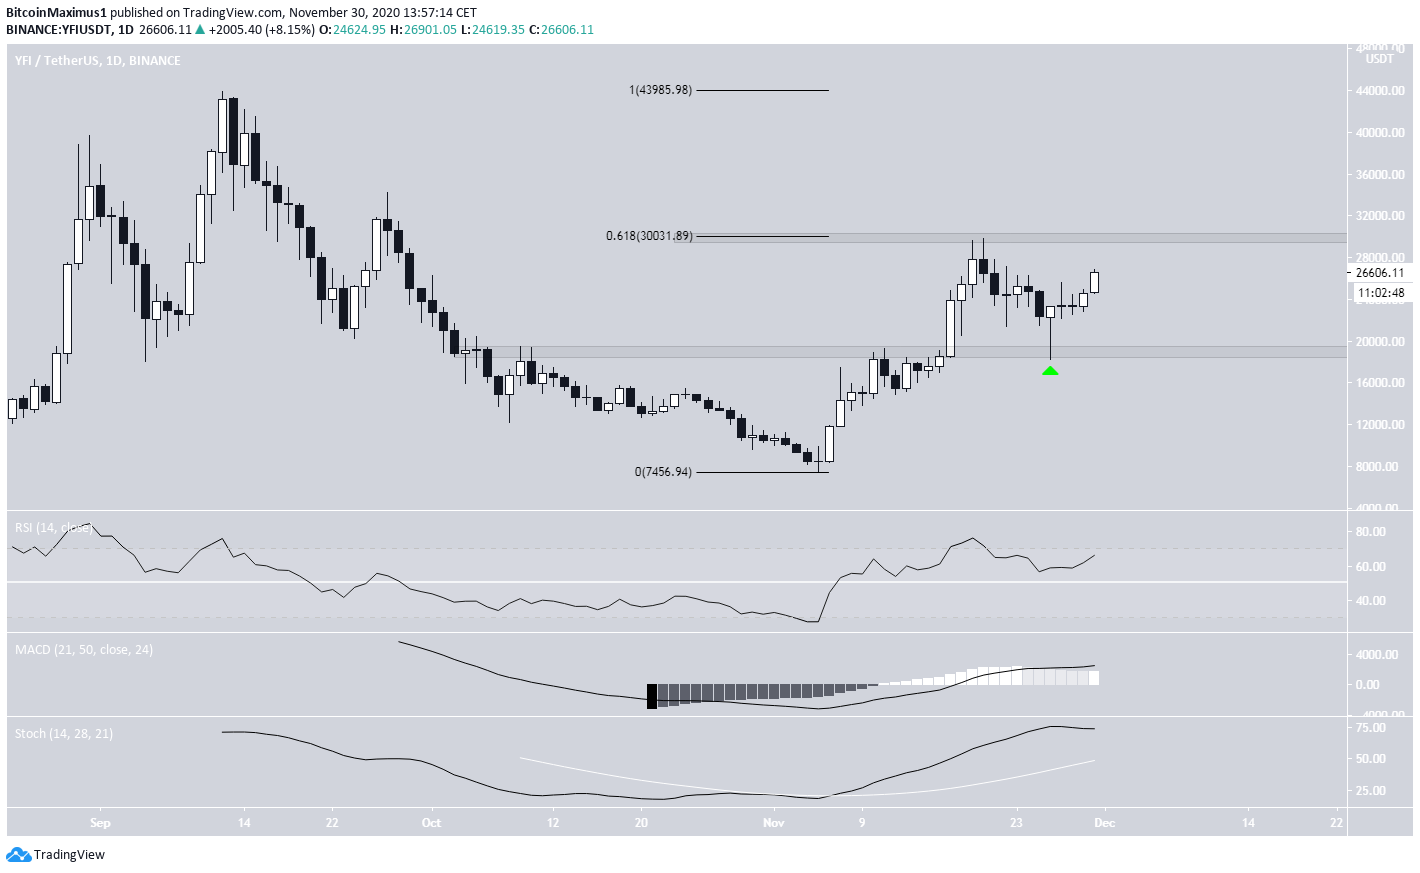
The YFI price reached a high of $29,890 on Nov. 20 before dropping sharply. On Nov. 26, the price re-tested the $19,000 support area with a long hammer candlestick and has been increasing since.
Technical indicators in the daily time-frame are still bullish. The RSI, MACD, and Stochastic oscillator are increasing.
Therefore, the price is expected to make another attempt at overtaking the $30,000 resistance area, which is also the 0.618 Fib retracement level of the entire decrease.
Wave Count
Cryptocurrency trader @TheEWguy stated that this entire increase is likely corrective and that YFI should soon begin a significant downward move toward $13,000.
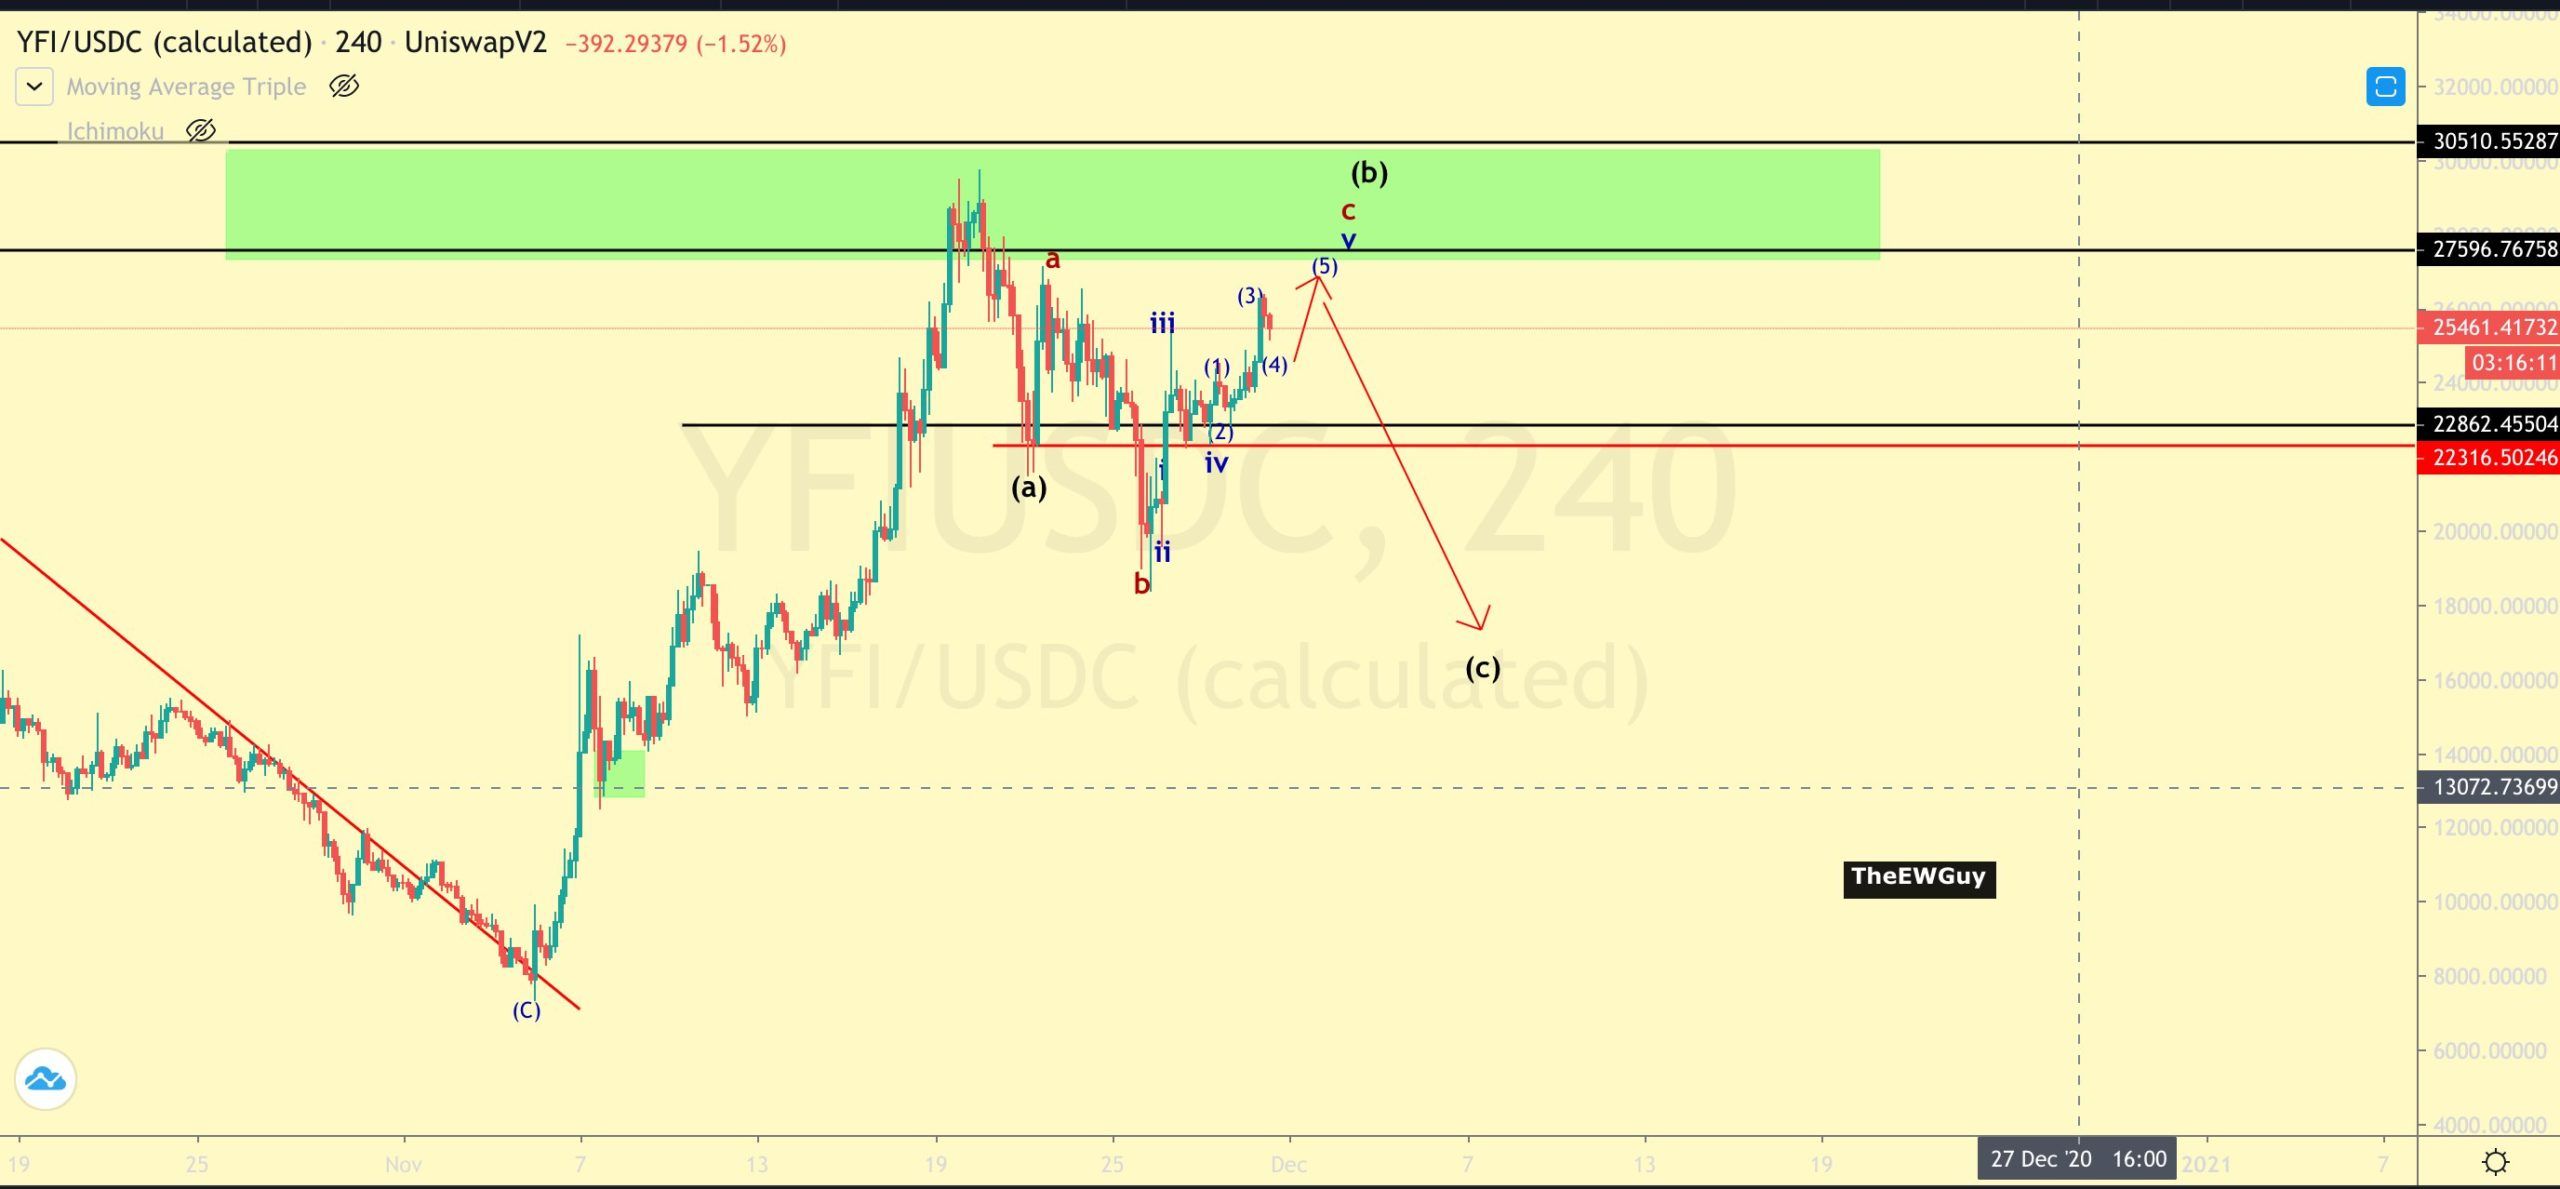
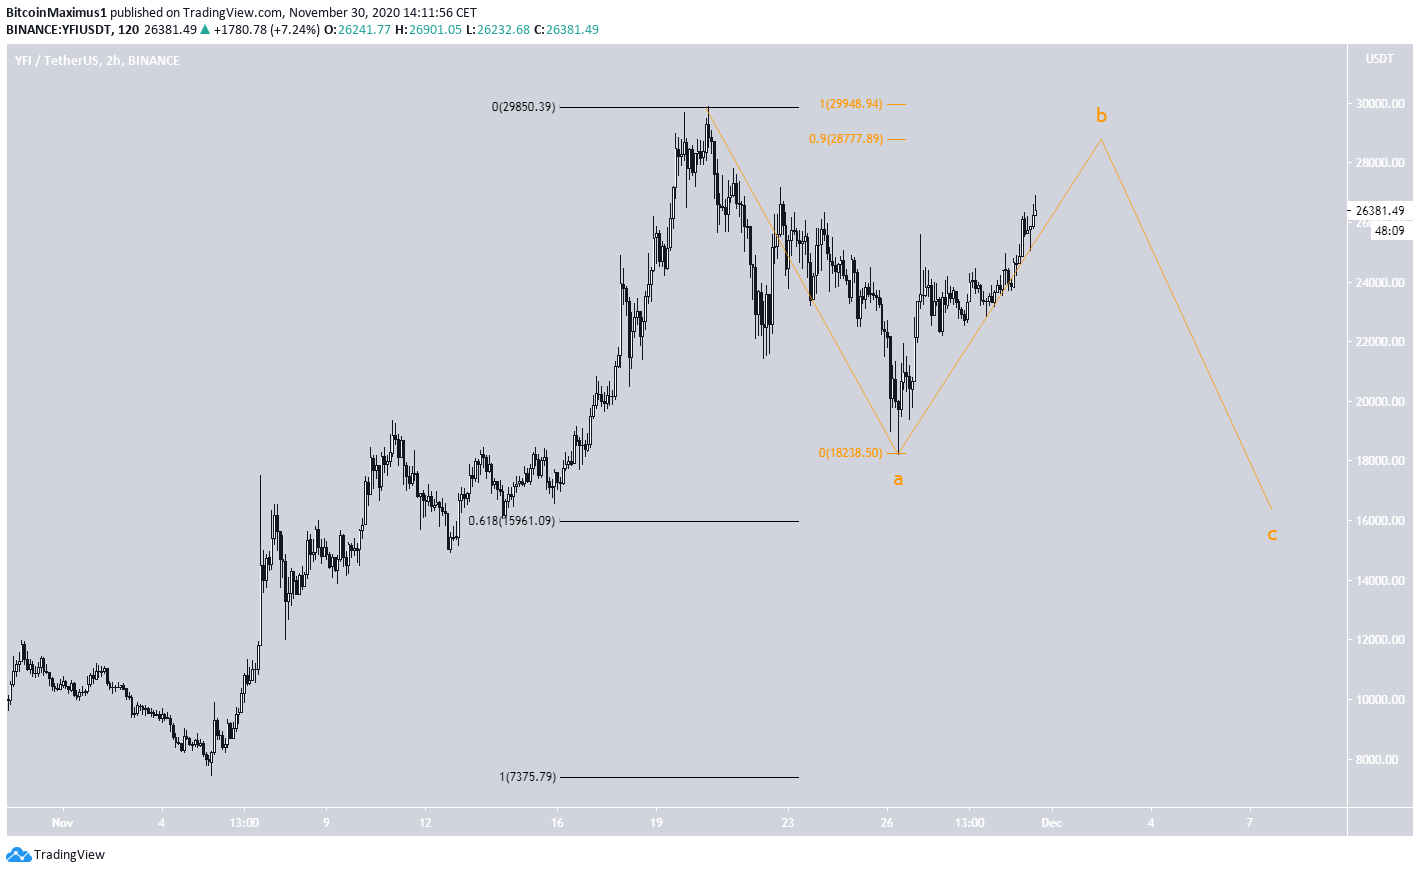
The movement since the Nov. 20 high looks like an A-B-C corrective structure (shown in orange below) in which the price is currently in the B wave.
Since the A wave transpired in three waves down, the structure is considered flat. The B wave is expected to retrace at least to the 0.9 Fib retracement level of $28,770.
After this, a drop back to the closest support area near $16,000 (0.618 Fib retracement level) is likely.
YFII Lags Behind
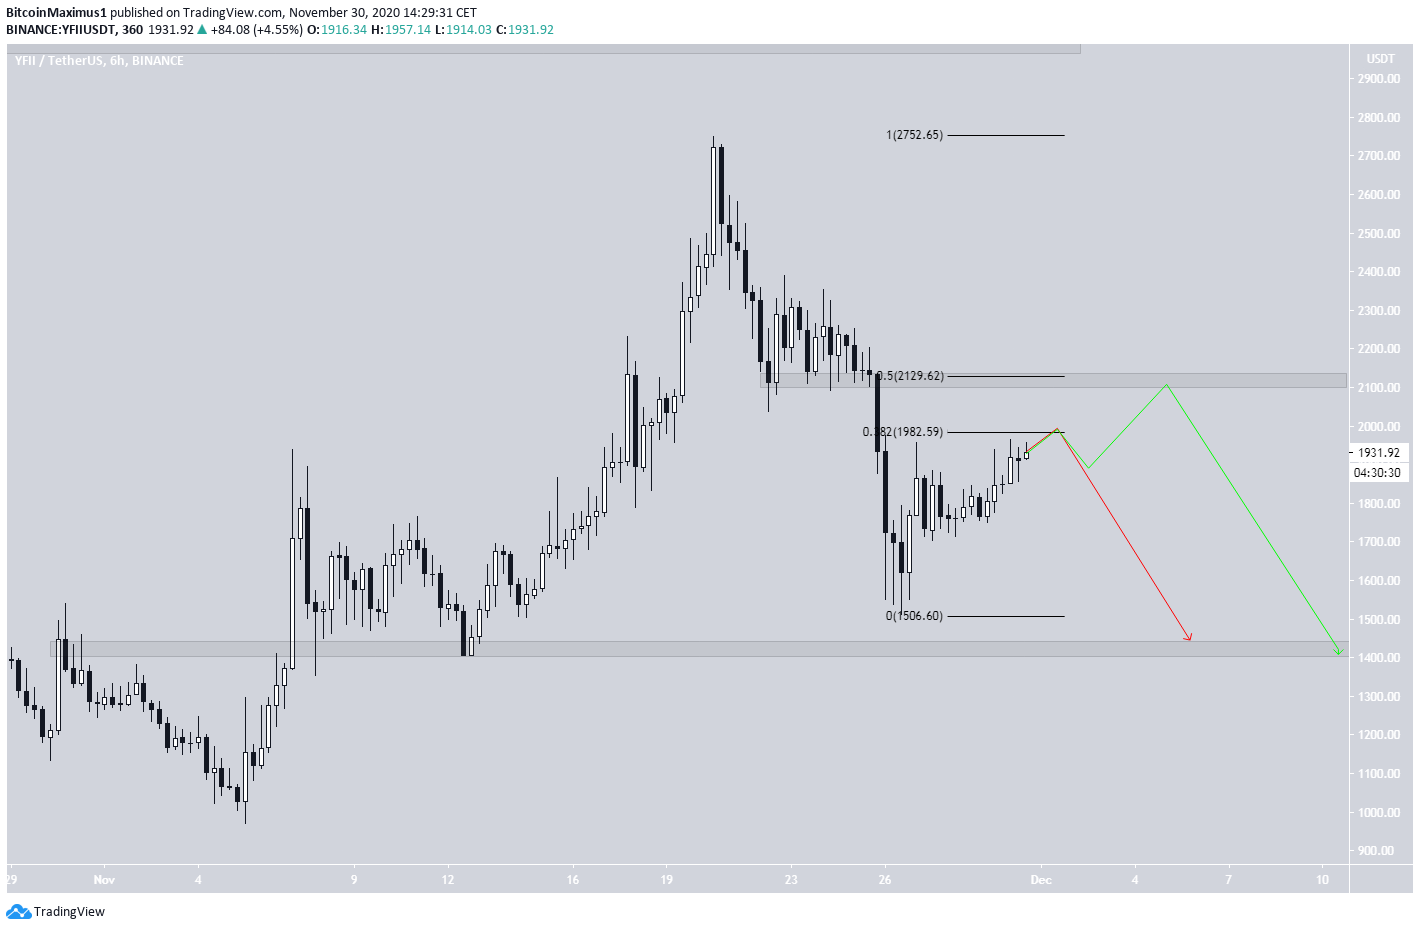
Unlike YFI, the DFI.Money (YFII) price has barely retraced since falling on Nov 20. In fact, the price has yet to reach the 0.382 Fib retracement level, which is the first level that is expected to provide significant resistance.
Even if YFII were able to clear it this time around, the 0.5 Fib level at $2,130 would also provide horizontal resistance, making it difficult to break out from.
Therefore, the most likely scenario would be a rejection from the current level followed by a decrease towards support at $1,400 or an increase towards the 0.5 Fib retracement level followed by a decrease towards $1,400.
For BeInCrypto’s latest Bitcoin analysis, click here!
Disclaimer: Cryptocurrency trading carries a high level of risk and may not be suitable for all investors. The views expressed in this article do not reflect those of BeInCrypto


