


The Bitcoin (BTC) price began the week of Nov 23-30 by increasing significantly but suffered a sharp drop on Nov. 26.
Bitcoin has been moving upwards since the drop, but it is more likely that the increase is a retracement rather than the beginning of a new upward trend.
Bitcoin Doji Candle Shows Indecision
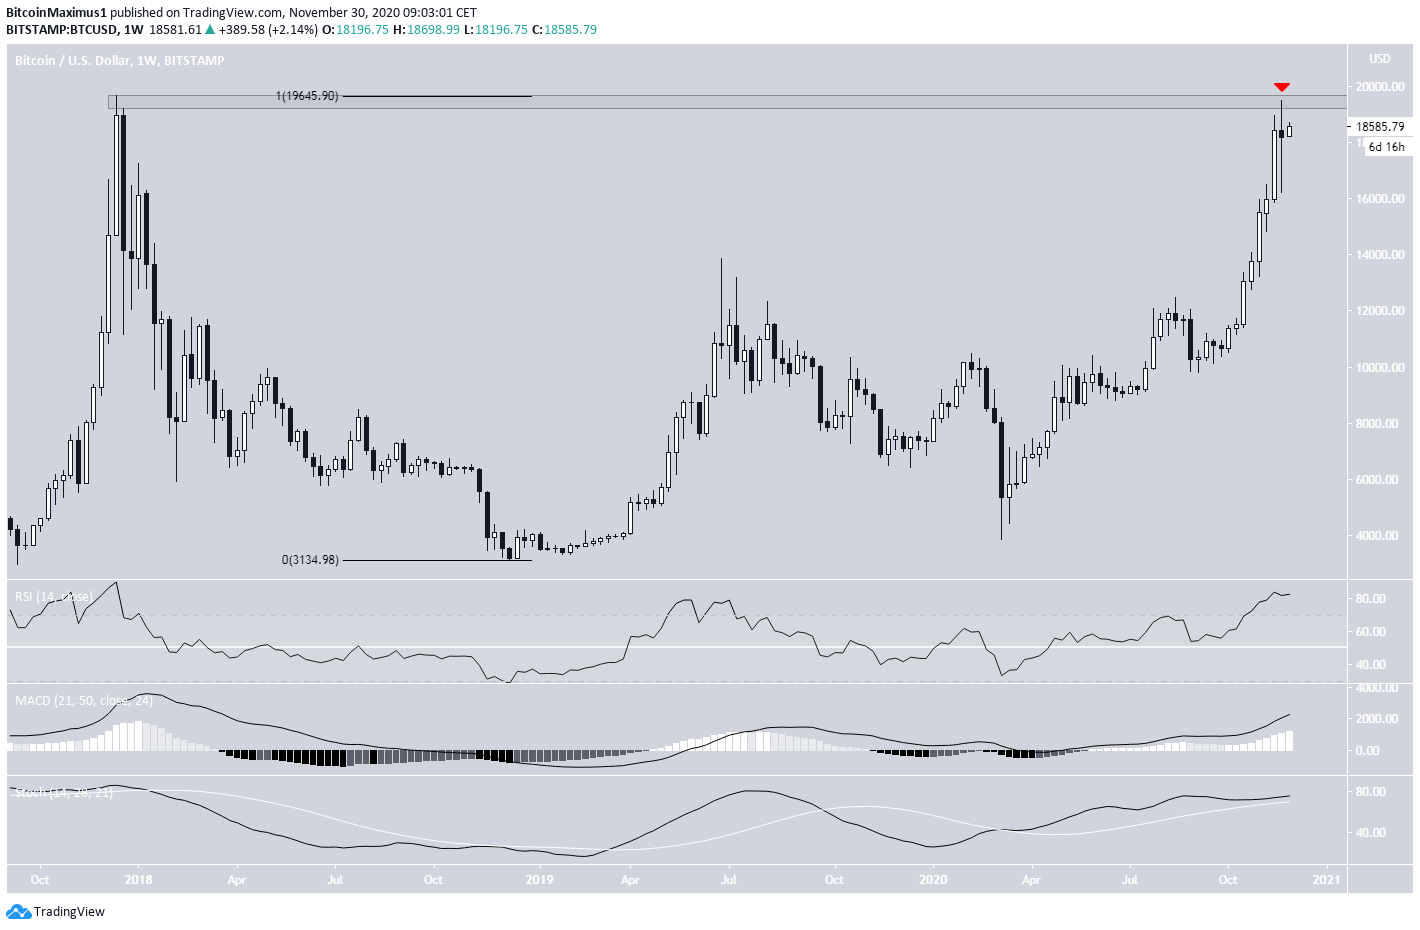
During the week of Nov 23-30, Bitcoin created a long-legged Doji candlestick which had a bearish close.
While the Doji is usually seen as a sign of indecision when coming after an upward trend, a Doji can also signify weakness in a trend.
The high of the week nearly touched the all-time high price of $19,645, creating a double top pattern.
However, there is no weakness yet in the weekly time-frame indicators, even if the RSI is extremely overbought.
Dump Or Continuation?
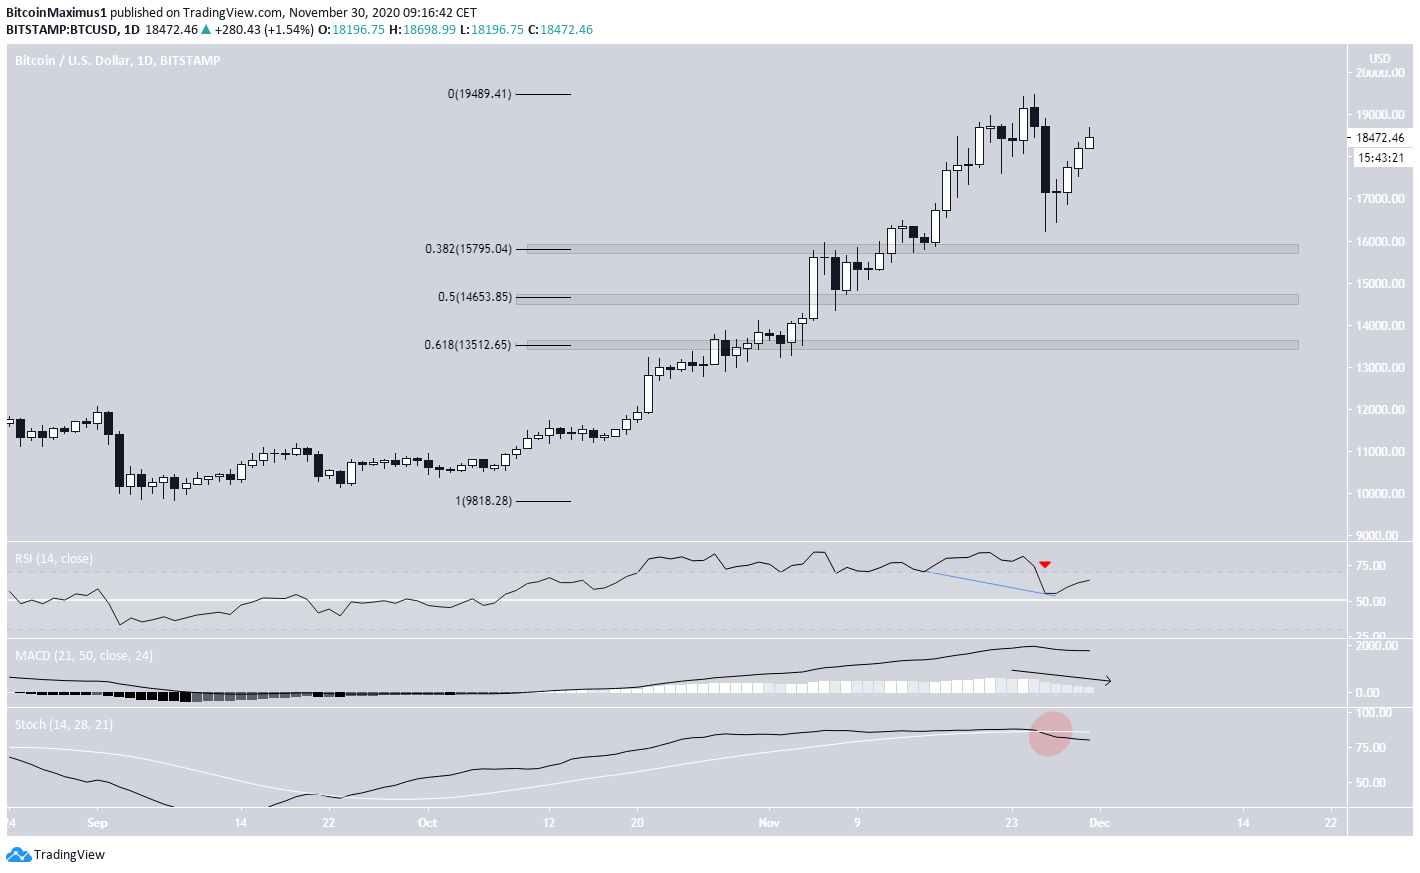
The daily chart gives mixed signals.
Bitcoin has been retracing well since the decrease on Nov. 26 but has yet to clear the previous highs. If the price were to decrease from the current level, it would create the first lower high since the upward movement began in September.
The MACD and Stochastic oscillator are decreasing, and the latter has just made a bearish cross. However, the RSI has managed to hold on above 50 and has generated a significant hidden bullish divergence preceding the current upward move.
If the RSI were to get rejected at 70 (overbought) and decrease, it would confirm that the trend is bearish.
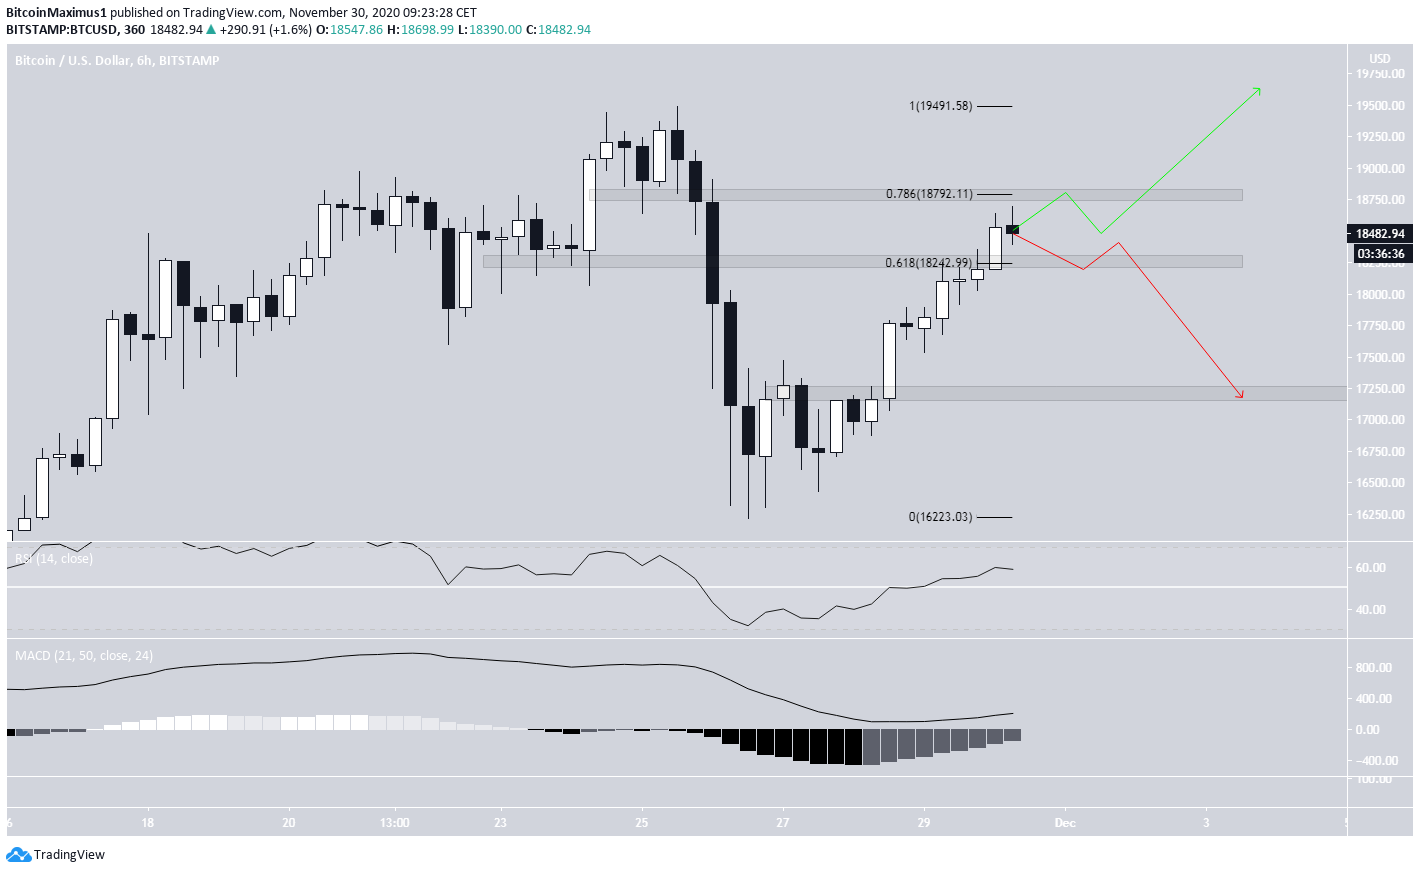
The six-hour chart shows that the price is currently trading between two important Fib retracement levels of 0.618-0.786, found at $18,250-$18,790.
A breakout and validation of $18,790 as support would mean that BTC is likely heading towards new highs. However, the loss of the $18,250 area could mean that the entire increase was a retracement and the price will head lower, with the $17,250 level acting as the closest support area.
Technical indicators are still bullish and do not show any weakness.
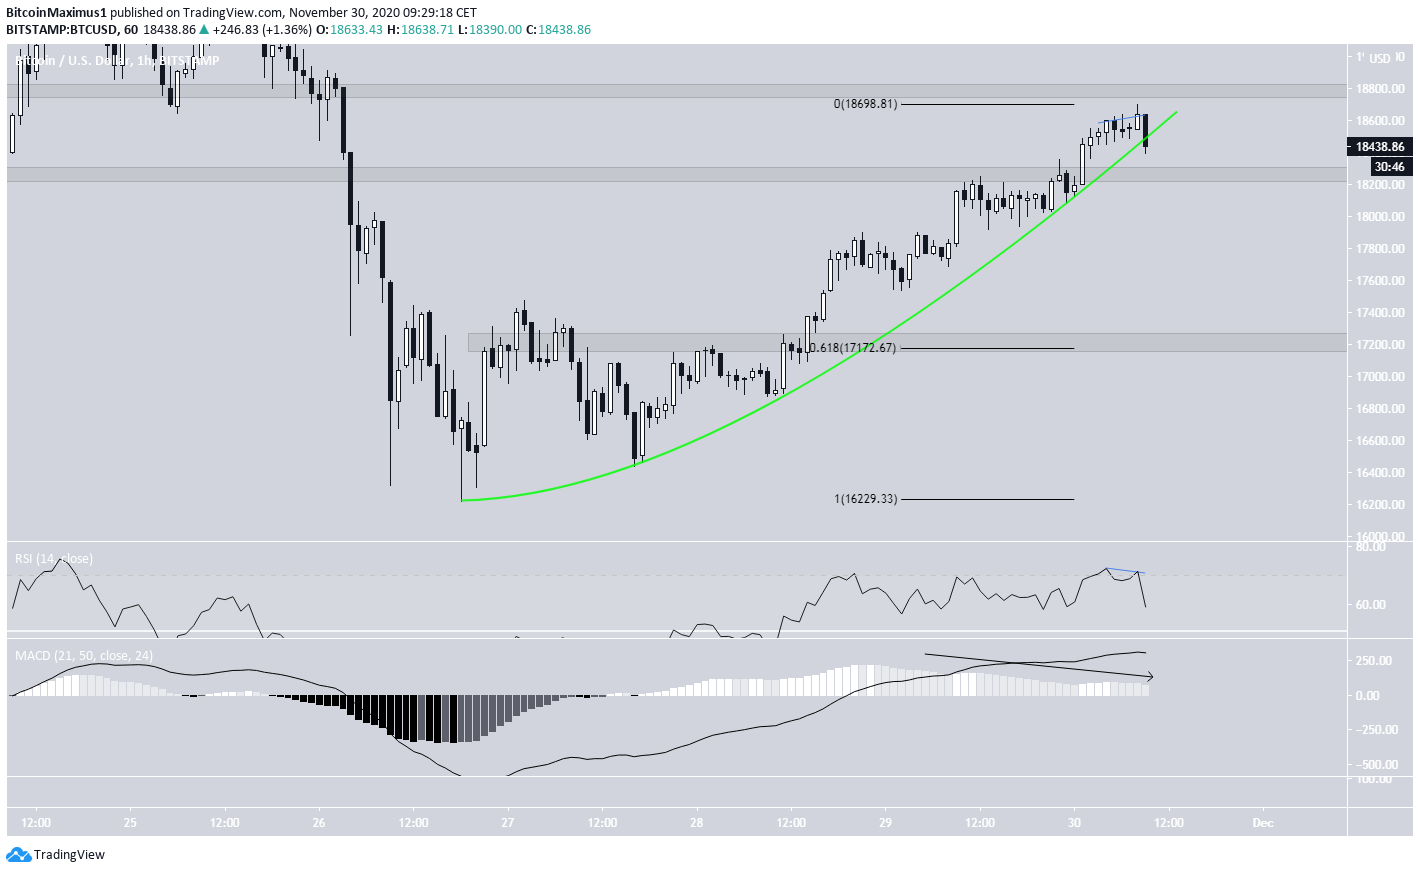
The one-hour chart shows the first definitive signs of weakness, as the MACD and RSI are decreasing after generating a bearish divergence. Furthermore, the price is in the process of breaking down from a parabolic ascending support line that has been in place since the Nov. 26 lows.
A breakdown would be confirmed with a decrease below $18,250.
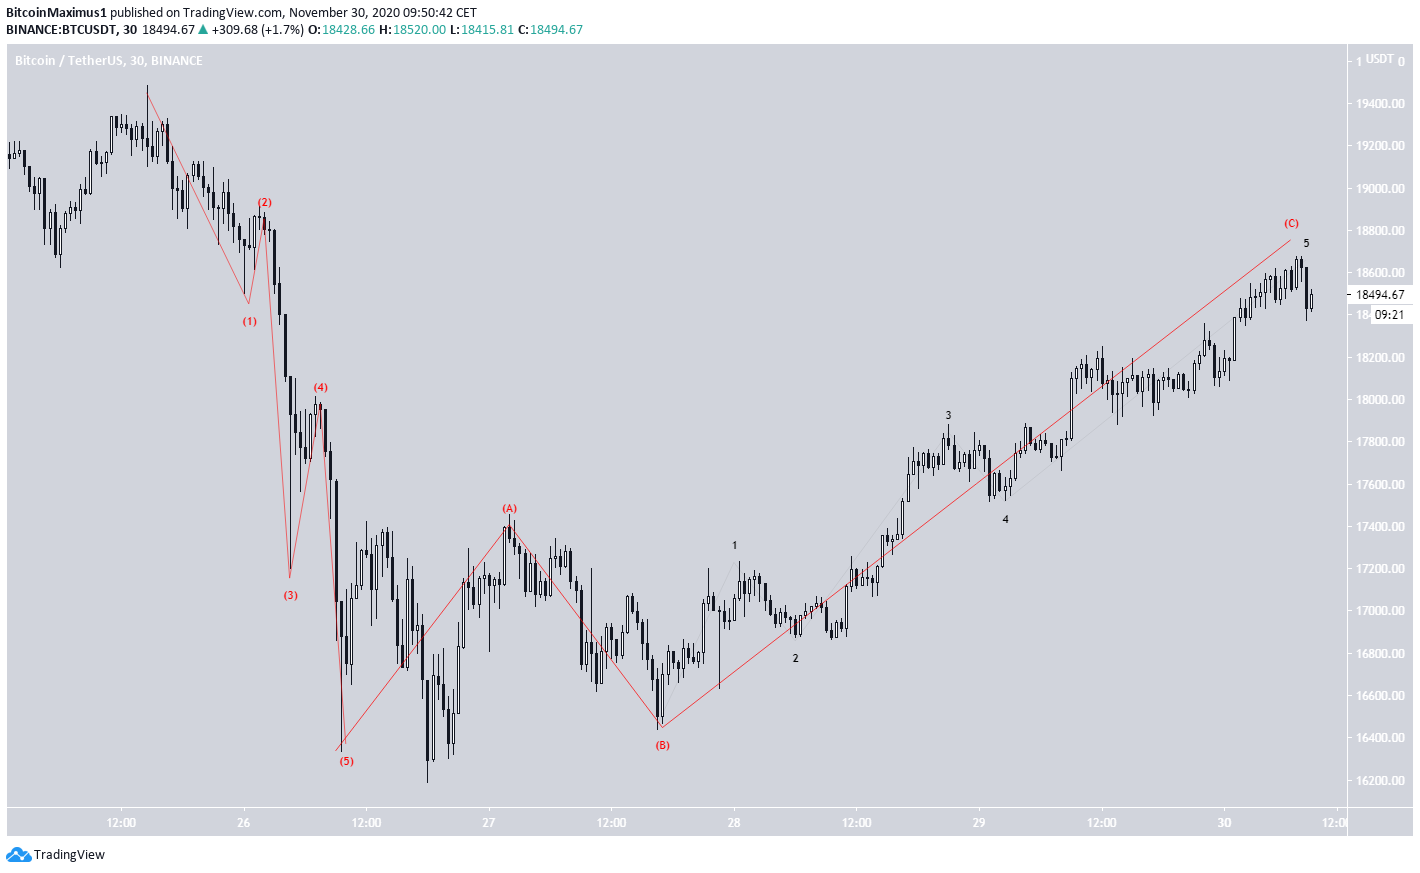
Wave Count
The most likely wave count for BTC suggests that the price has completed a bearish impulse and is now retracing in an A-B-C correction (both shown in red below).
If the count is correct, then BTC has already, or will very soon, reach a top and begin to decrease towards the $17,200 support area.
A continued increase would make for a very unusual wave A to C ratio, hence invalidating the count.
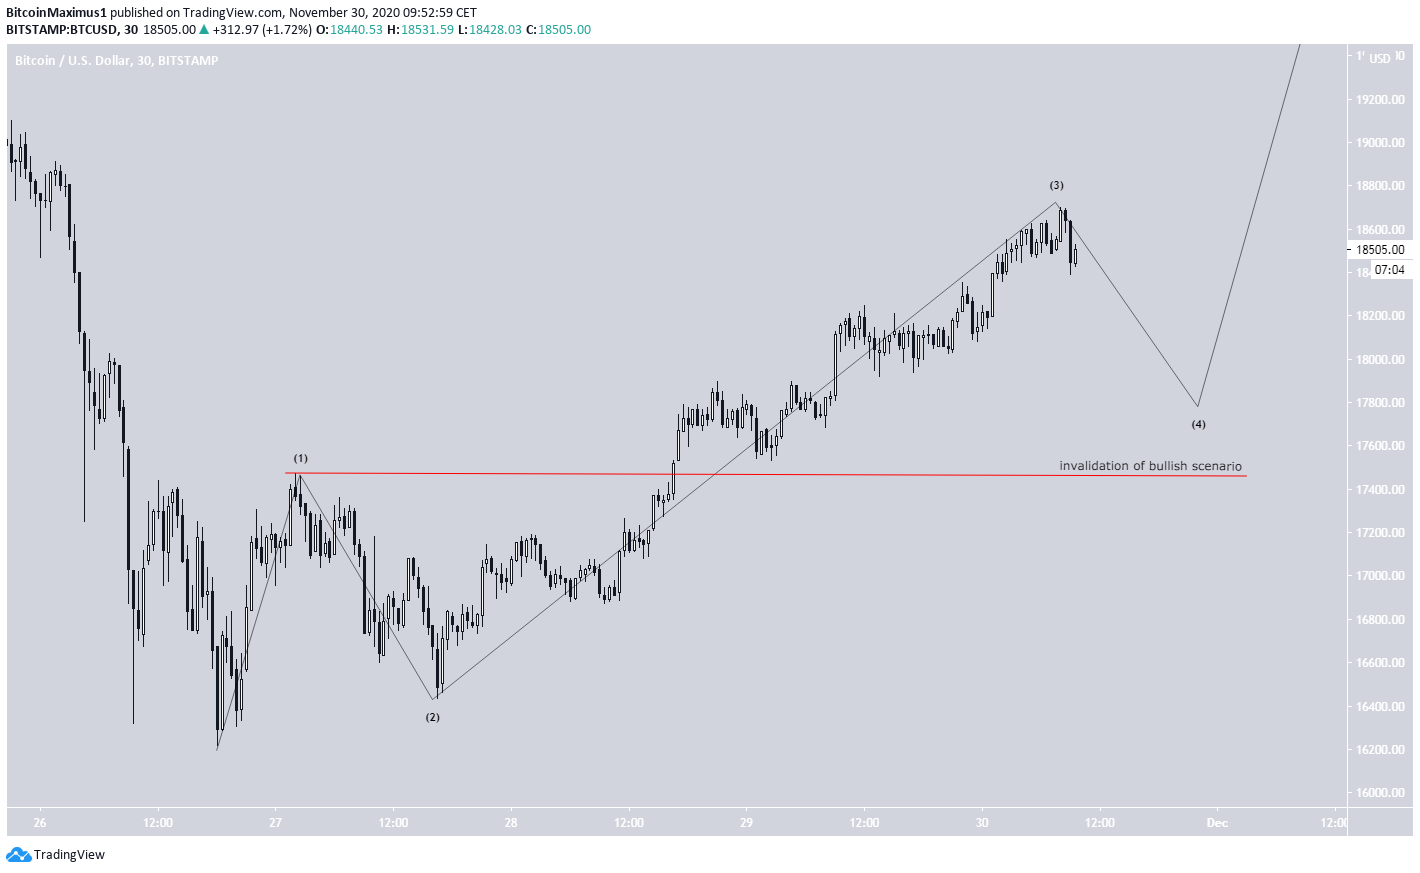
The bullish alternative suggests that this is the beginning of a new upward move instead and that the price is in wave 3 (black).
A retracement is still expected, and a decrease below the wave 1 high of $17,406 would invalidate it.
At the time of press, this count seems more unlikely than the bearish scenario.
Conclusion
Whether BTC breaks out above $18,7900 or below $18,250 will play a major role in determining the direction of the future movement.
For BeInCrypto’s previous Bitcoin analysis, click here!
Disclaimer: Cryptocurrency trading carries a high level of risk and may not be suitable for all investors. The views expressed in this article do not reflect those of BeInCrypto


