
Yearn.finance (YFI) has broken out from a short-term pattern, but is still facing long-term diagonal and horizontal resistance.
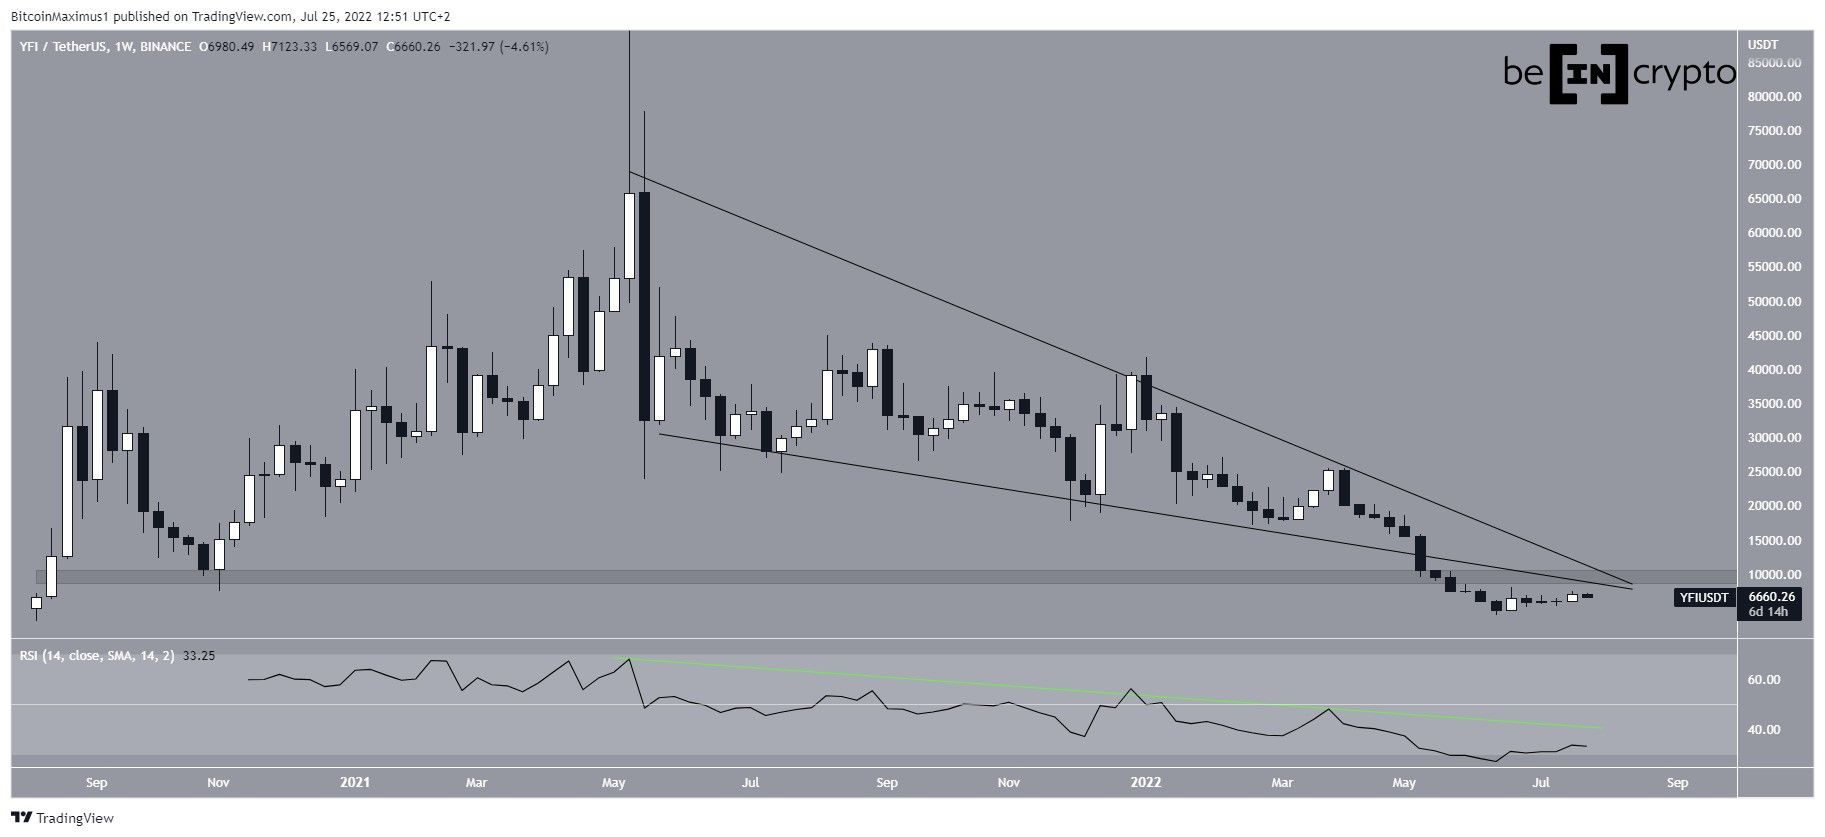
YFI has been falling since reaching an all-time high price of $95,000 in May 2021. Initially, the downward movement was contained inside a descending wedge, which is considered a bullish pattern.
However, the price broke down from the wedge in May 2022 and proceeded to reach a low of $4,018. This was just slightly above the $3,000 all-time low price.
Moreover, the weekly RSI fell to a new all-time low. While it has bounced since, it is still following a descending trend line (green).
Currently, YFI is facing resistance from both the previous support line of the wedge and $9,500 horizontal area.
Short-term movement
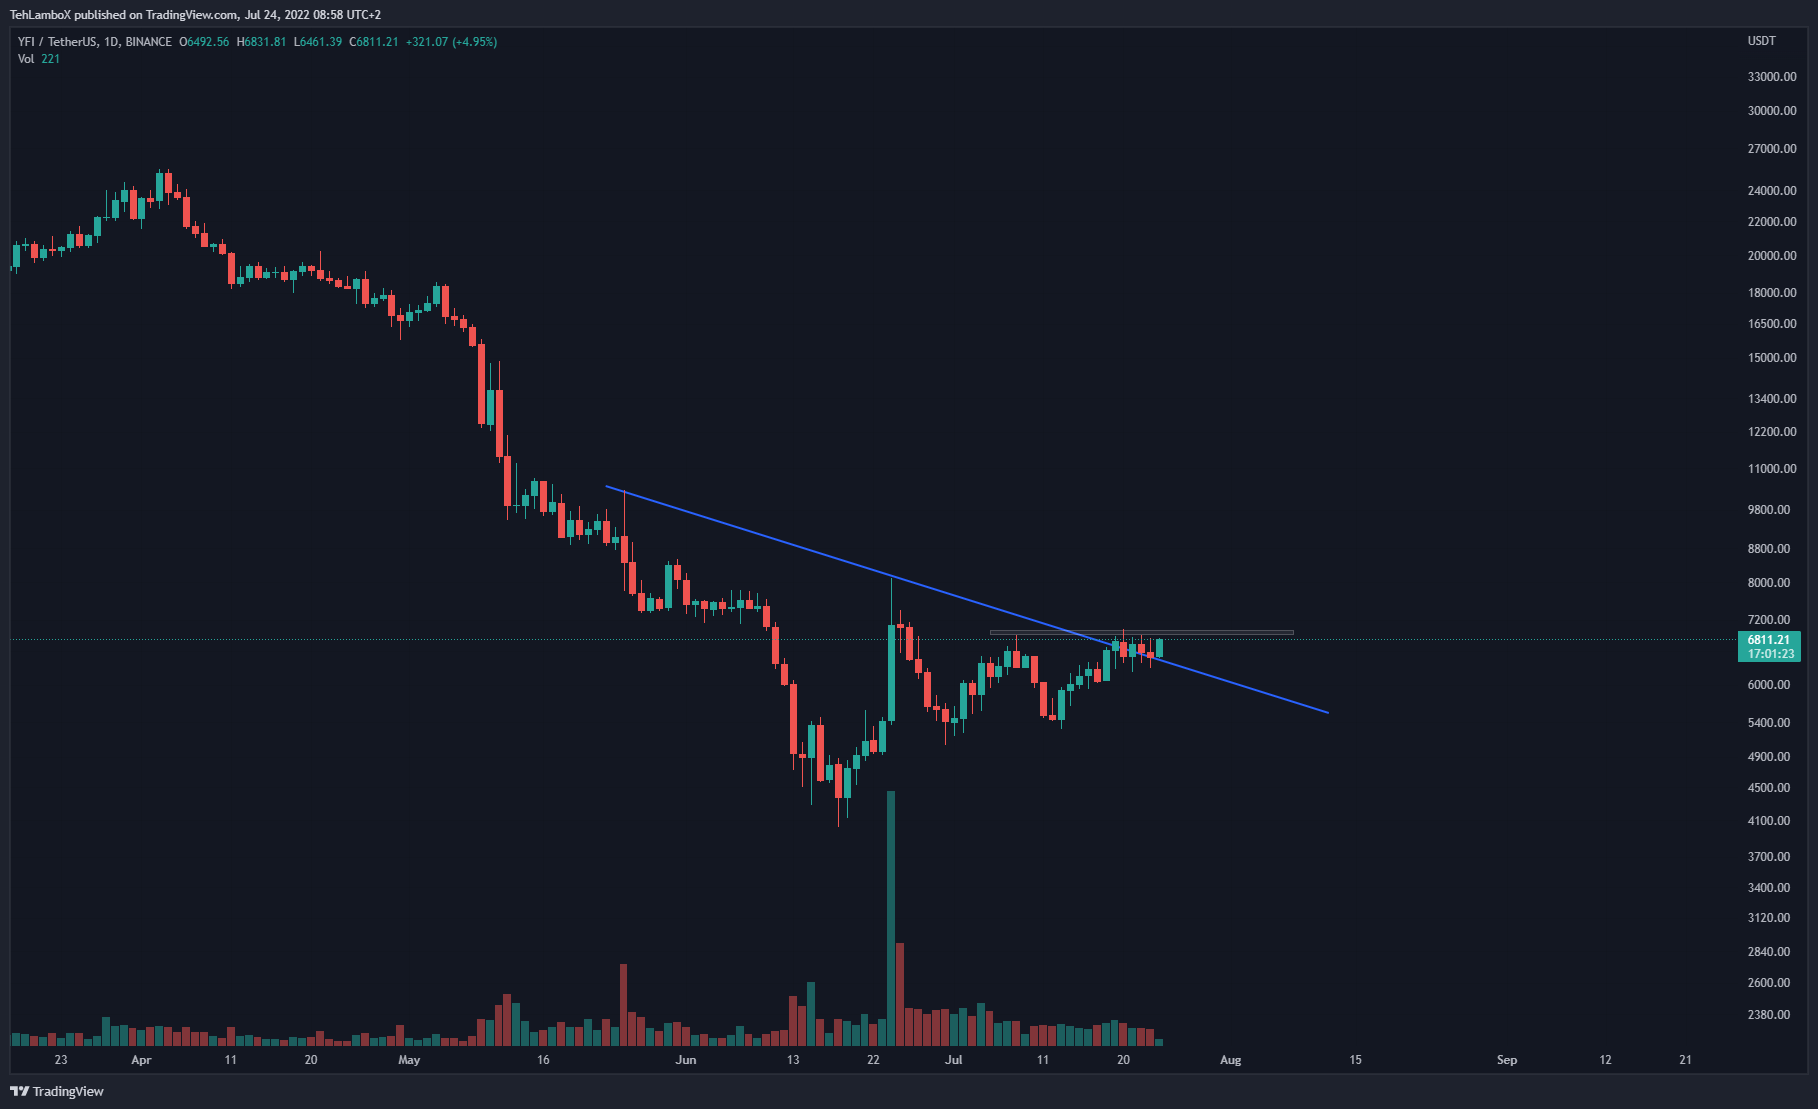
Cryptocurrency trader @TeHLamboX tweeted a chart of YFI, stating that the price could break out above $7,000.
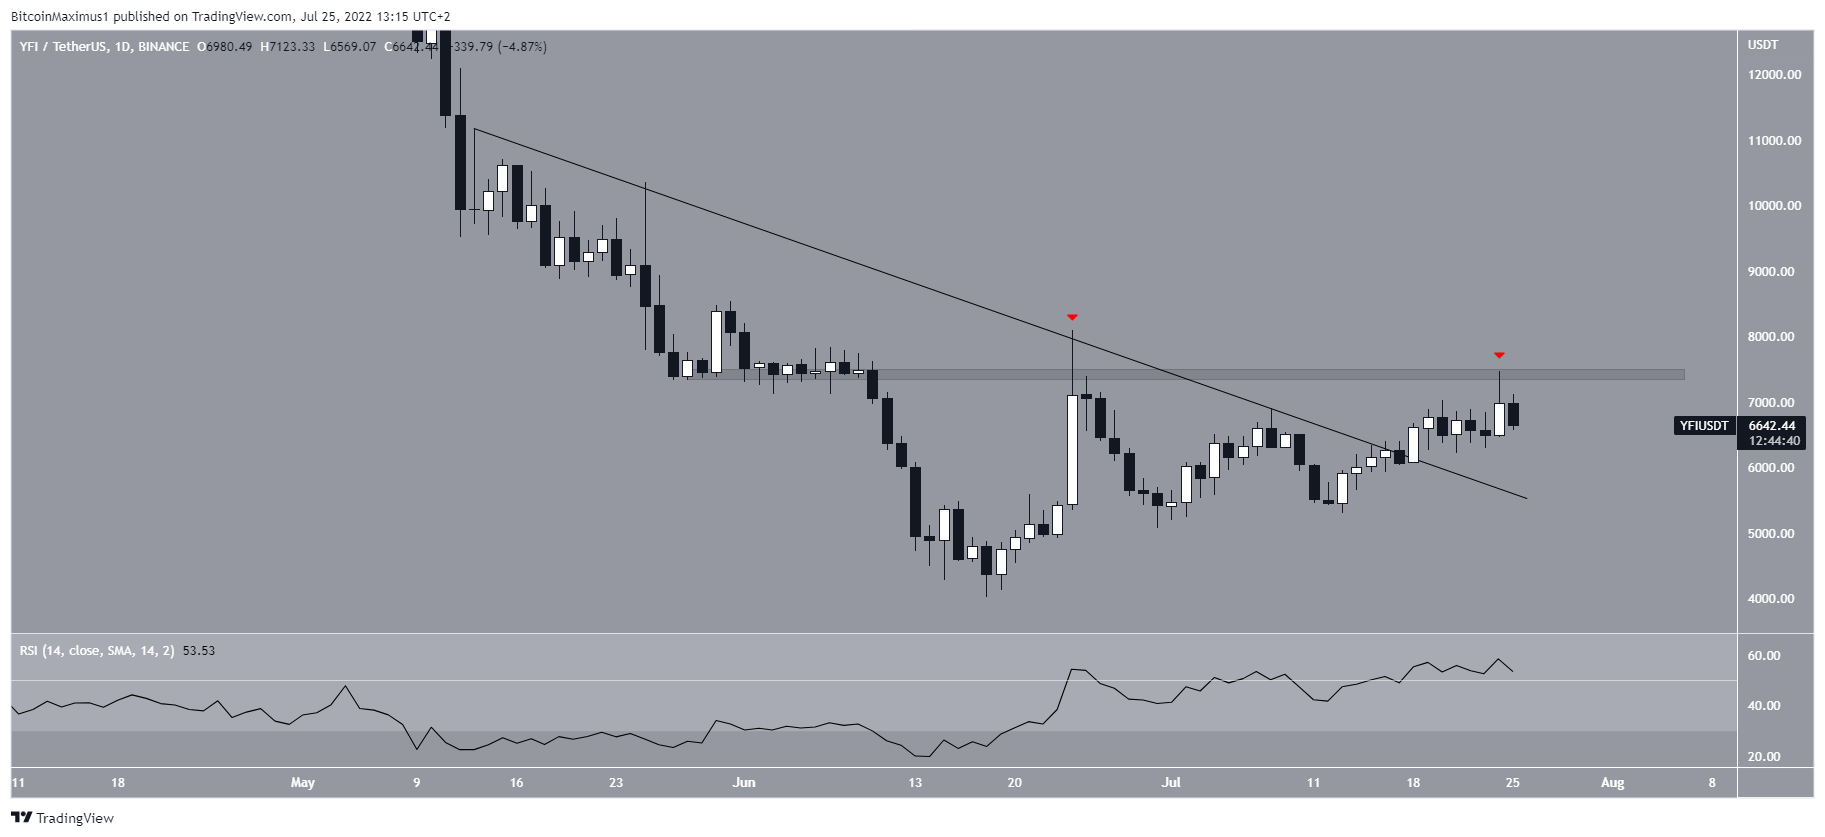
The daily chart shows that YFI broke out from a descending resistance line that was in place since May 9. Afterward, it proceeded to reach a high of $7,461 but was rejected by the $7,400 horizontal resistance area (red icon), creating a long upper wick.
Despite the rejection, the daily RSI supports the possibility of a breakout, since it has already increased above 50.
If one occurs, the price would be expected to increase towards the previously outlined $9,200 resistance area.
Short-term breakdown
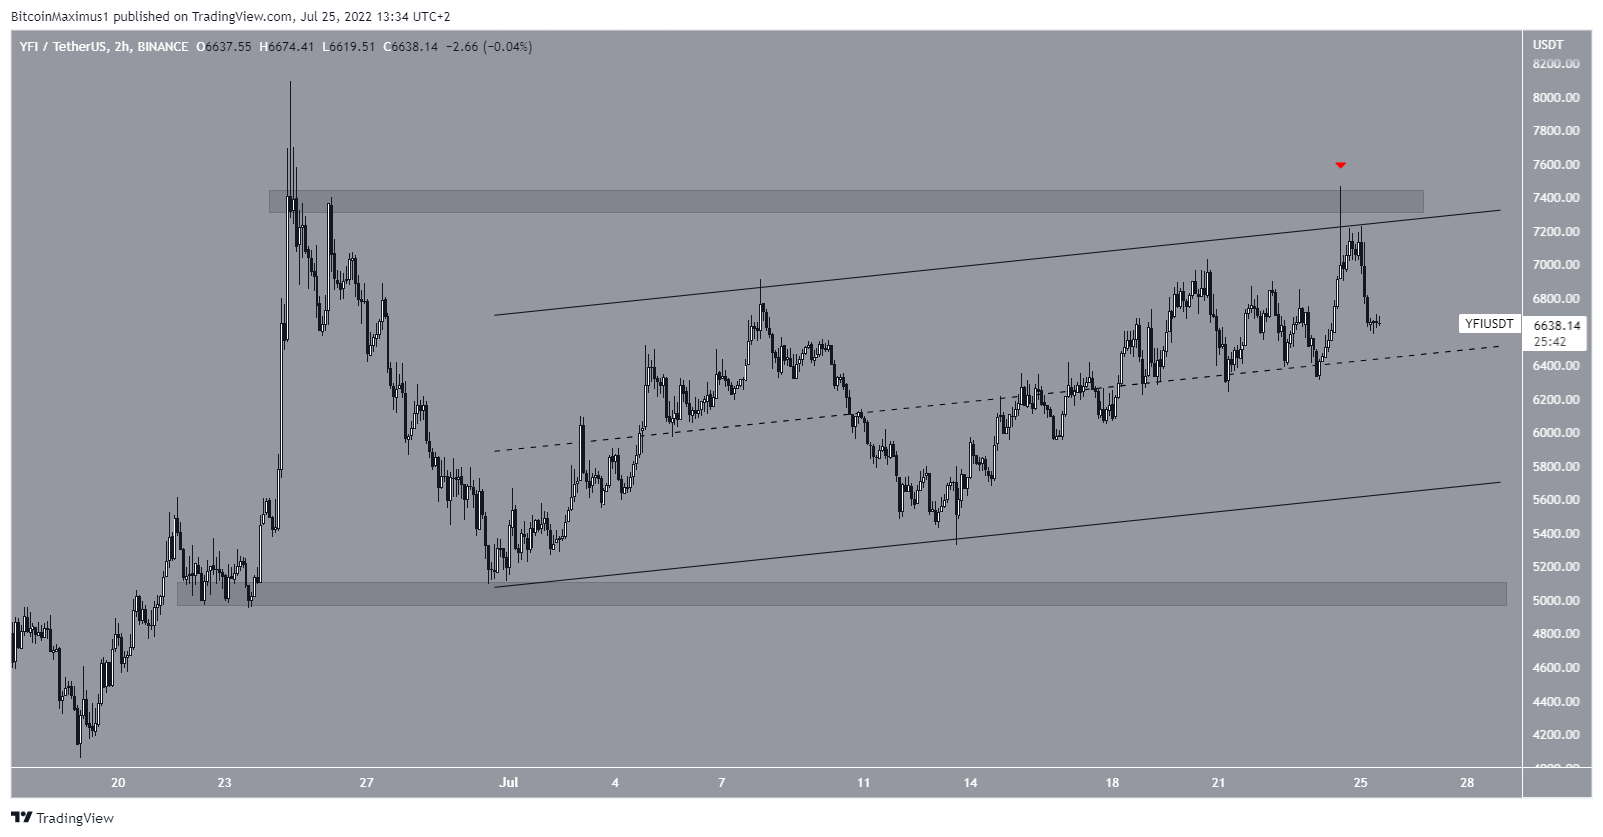
Despite the relative bullishness from the daily time frame, the two-hour chart indicates that an initial decrease is expected. The main reason for this is that the price was rejected by both the $7,400 resistance area and the resistance line of the channel (red icon).
In turn, this validated the possibility that YFI is trading inside an ascending parallel channel. Since such channels usually contain corrective movements, an eventual breakdown from it is likely.
If one occurs, the price could visit the $5,000 support area prior to potential continuation.
For Be[in]Crypto’s latest Bitcoin (BTC) analysis, click here
