

XRP (XRP) is showing bullish signs in the weekly time frame but is trading inside a short-term corrective pattern.
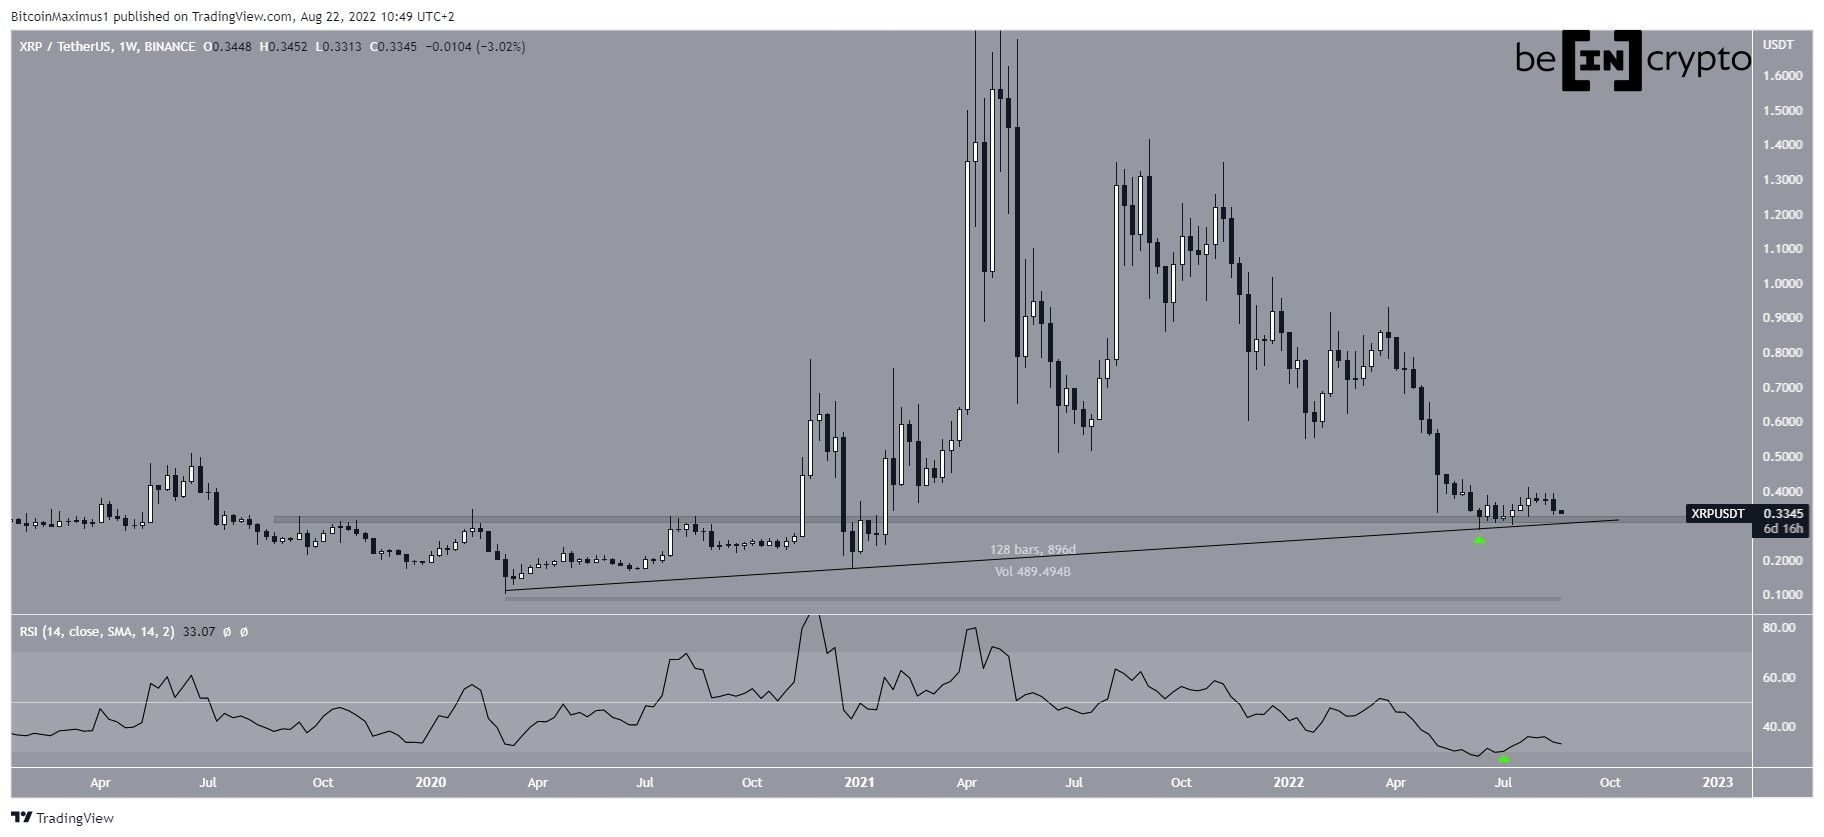
XRP has been falling since reaching an all-time high price of $1.97 in April 2021. The downward movement has so far led to a low of $0.28 in June.
The ensuing bounce served to validate both the $0.32 horizontal support area and an ascending support line that has been in place for 896 days.
Furthermore, the weekly RSI moved outside its oversold territory after previously decreasing below it.
So, despite the fact that XRP is approaching the $0.32 area once more, readings from the weekly time frame are bullish.
Until the price breaks down from both the $0.32 area and the ascending support line, the bullish structure can be considered intact.
Current reading
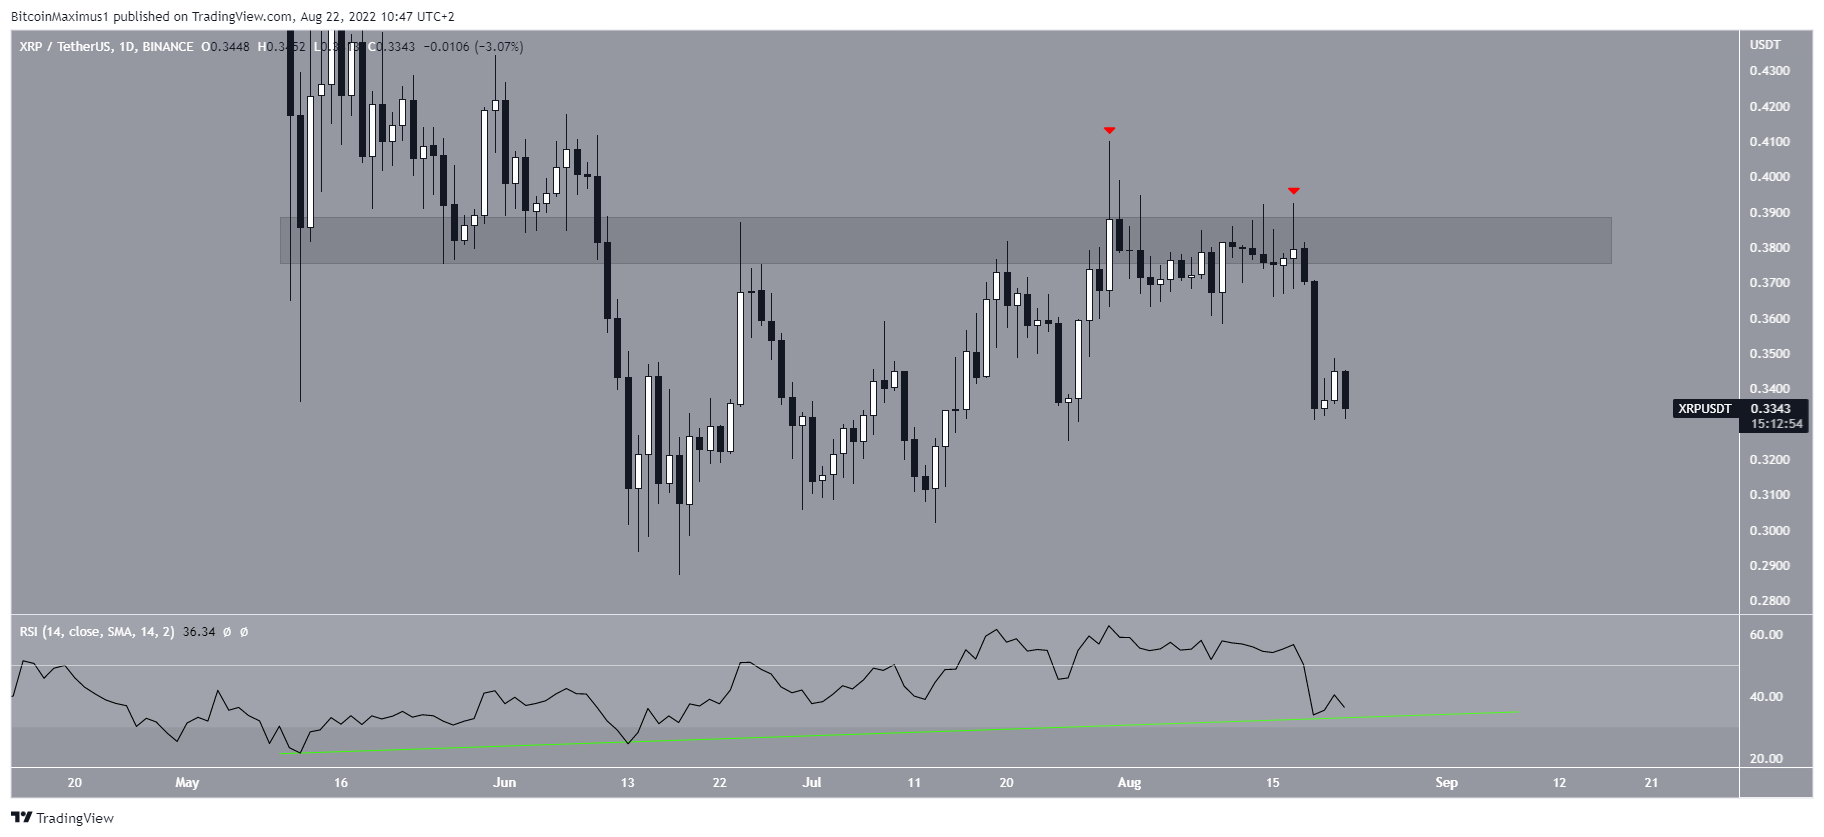
Despite the positive readings from the weekly time frame, the daily chart provides a more bearish outlook.
XRP has been rejected by the $0.38 area twice (red icons), creating long upper wicks each time. In turn, this caused a short-term decrease towards the current price at $0.33.
While the daily RSI is below 50, it is still trading above the bullish divergence trend line (green line) which preceded the entire upward movement.
Short-term pattern
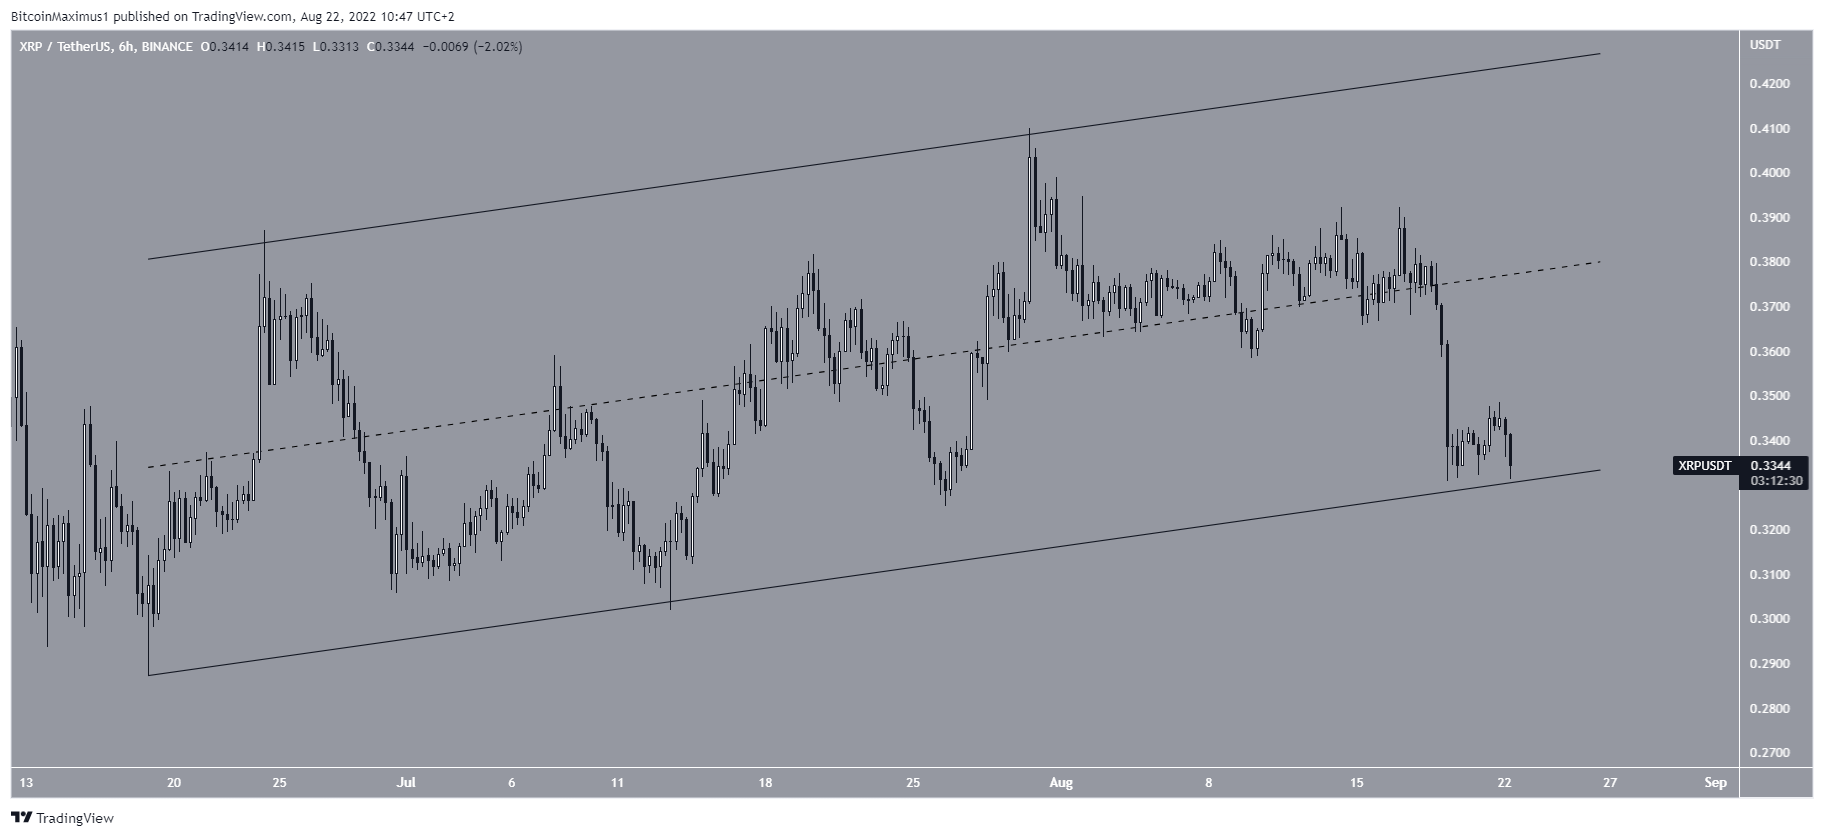
Finally, the six-hour chart shows that the price has been trading inside an ascending parallel channel since June 19. Such patterns usually contain corrective movements, meaning that an eventual breakdown from it would be likely.
Moreover, the price is trading in the lower portion of the channel, further giving credence to this possibility.
Therefore, there are multiple mixed readings. The weekly chart is bullish, the daily one is neutral while the six-hour chart is bearish.
For Be[in]Crypto’s latest Bitcoin (BTC) analysis, click here
Disclaimer
In line with the Trust Project guidelines, this price analysis article is for informational purposes only and should not be considered financial or investment advice. BeInCrypto is committed to accurate, unbiased reporting, but market conditions are subject to change without notice. Always conduct your own research and consult with a professional before making any financial decisions. Please note that our Terms and Conditions, Privacy Policy, and Disclaimers have been updated.
