

At BeInCrypto, we regular price analyses and predictions for XRP. On Mar 22 XRP, we predicted that XRP—still known widely as Ripple—would experience short-term losses before starting an upward move. While the short-term losses were predicted correctly, an upward move has yet to materialize, but we still believe it is coming. Click here to read more or keep reading below for our most recent price predictions for XRP!
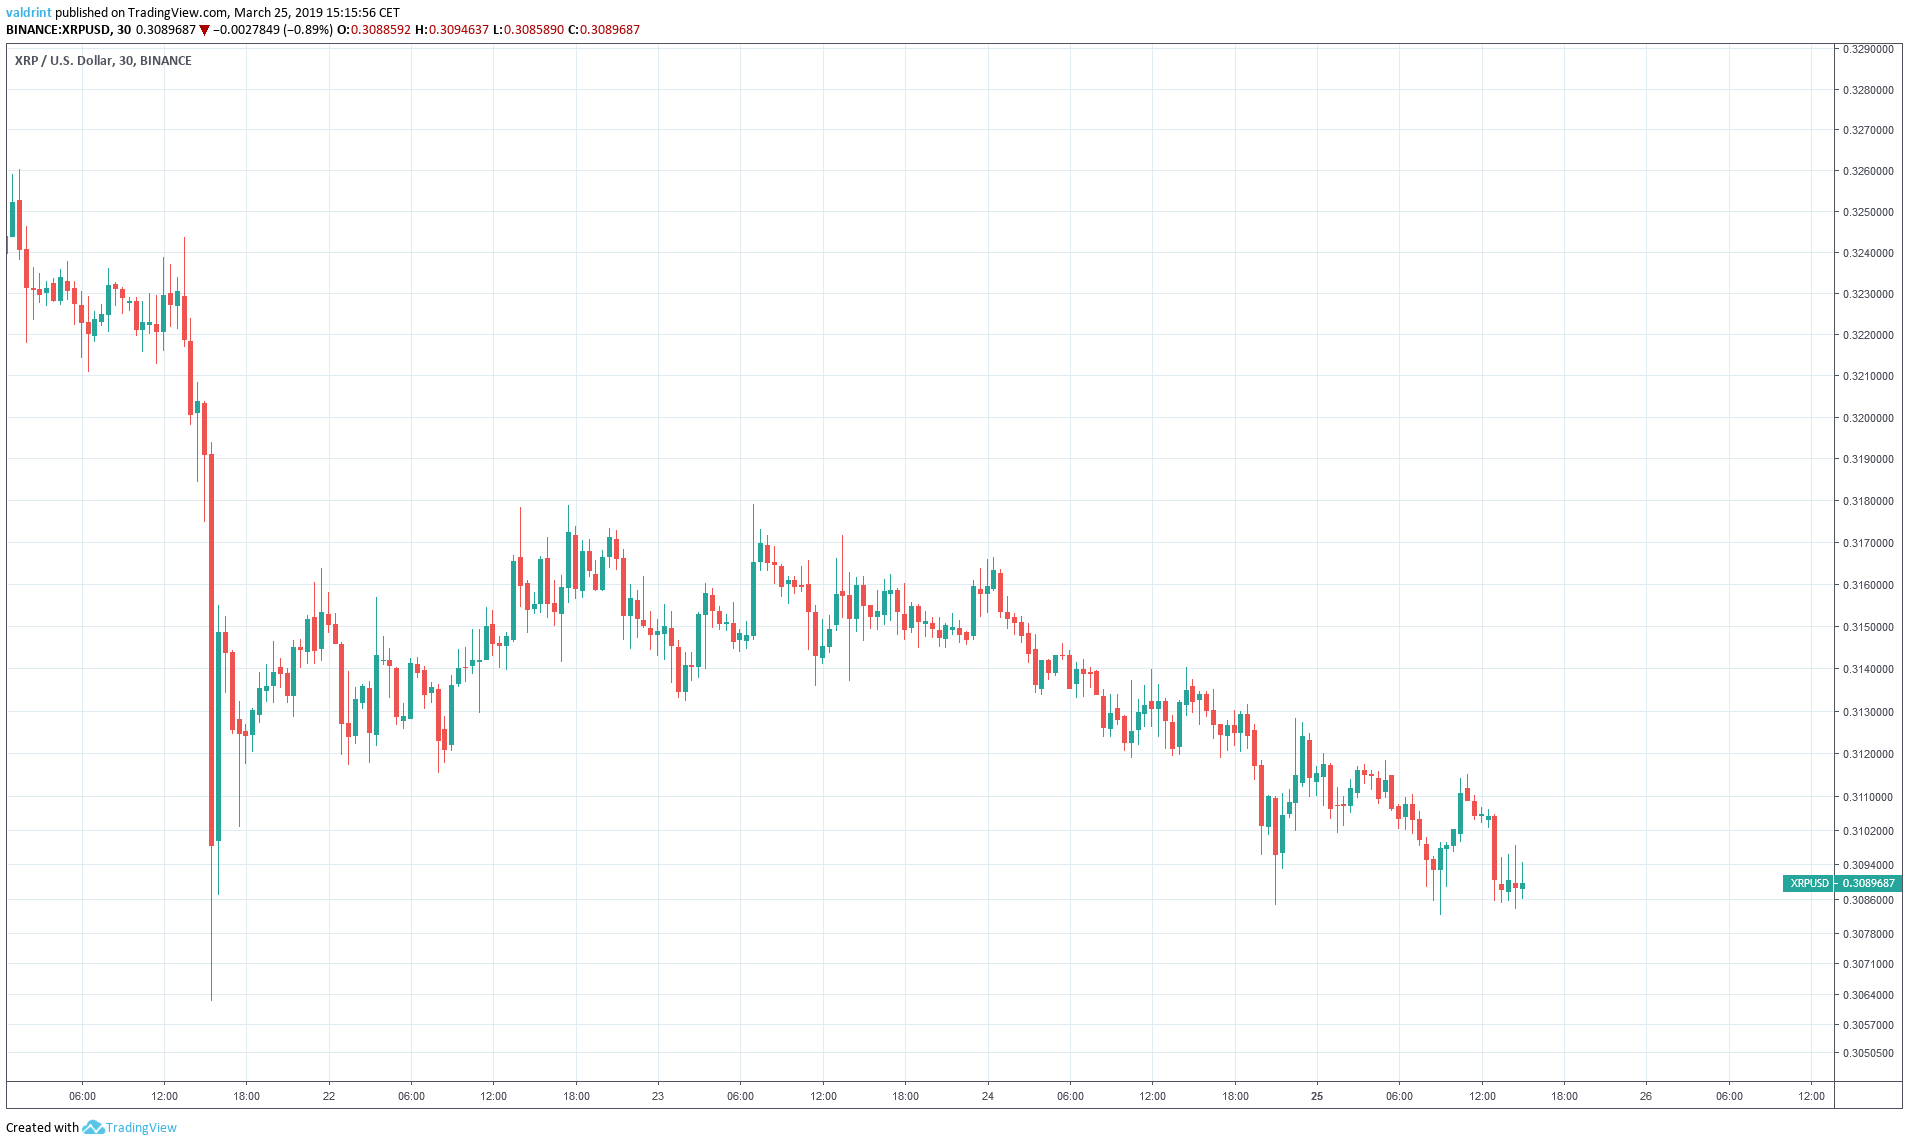
On March 21, 2019, the price of XRP (XRP) reached a high of $0.324 before a rapid drop brought prices below $0.306. After a gradual uptrend, prices again dropped. At the time of writing on Mar 25, lows below $0.309 were becoming more frequent.
Will XRP’s price keep going down or will a reversal bring up back to the highs seen on Mar 21?
XRP (XRP): Trends and Highlights for March 25, 2019
- The price of XRP experienced a flash crash on Mar 21.
- It is trading inside a descending wedge.
- There is bullish divergence developing in the RSI and the MACD.
- There are resistance areas near $0.313, $0.317 and $0.324
- There is support near $0.304.
Tracing Resistance
The price of XRP on Binance is analyzed at two-hour intervals from Mar 19 to Mar 25. The price reached a high of $0.328 on Mar 20. A sharp drop ensued, followed by a gradual downtrend move. The price has made successively lower highs. Tracing these highs gives us a descending resistance line.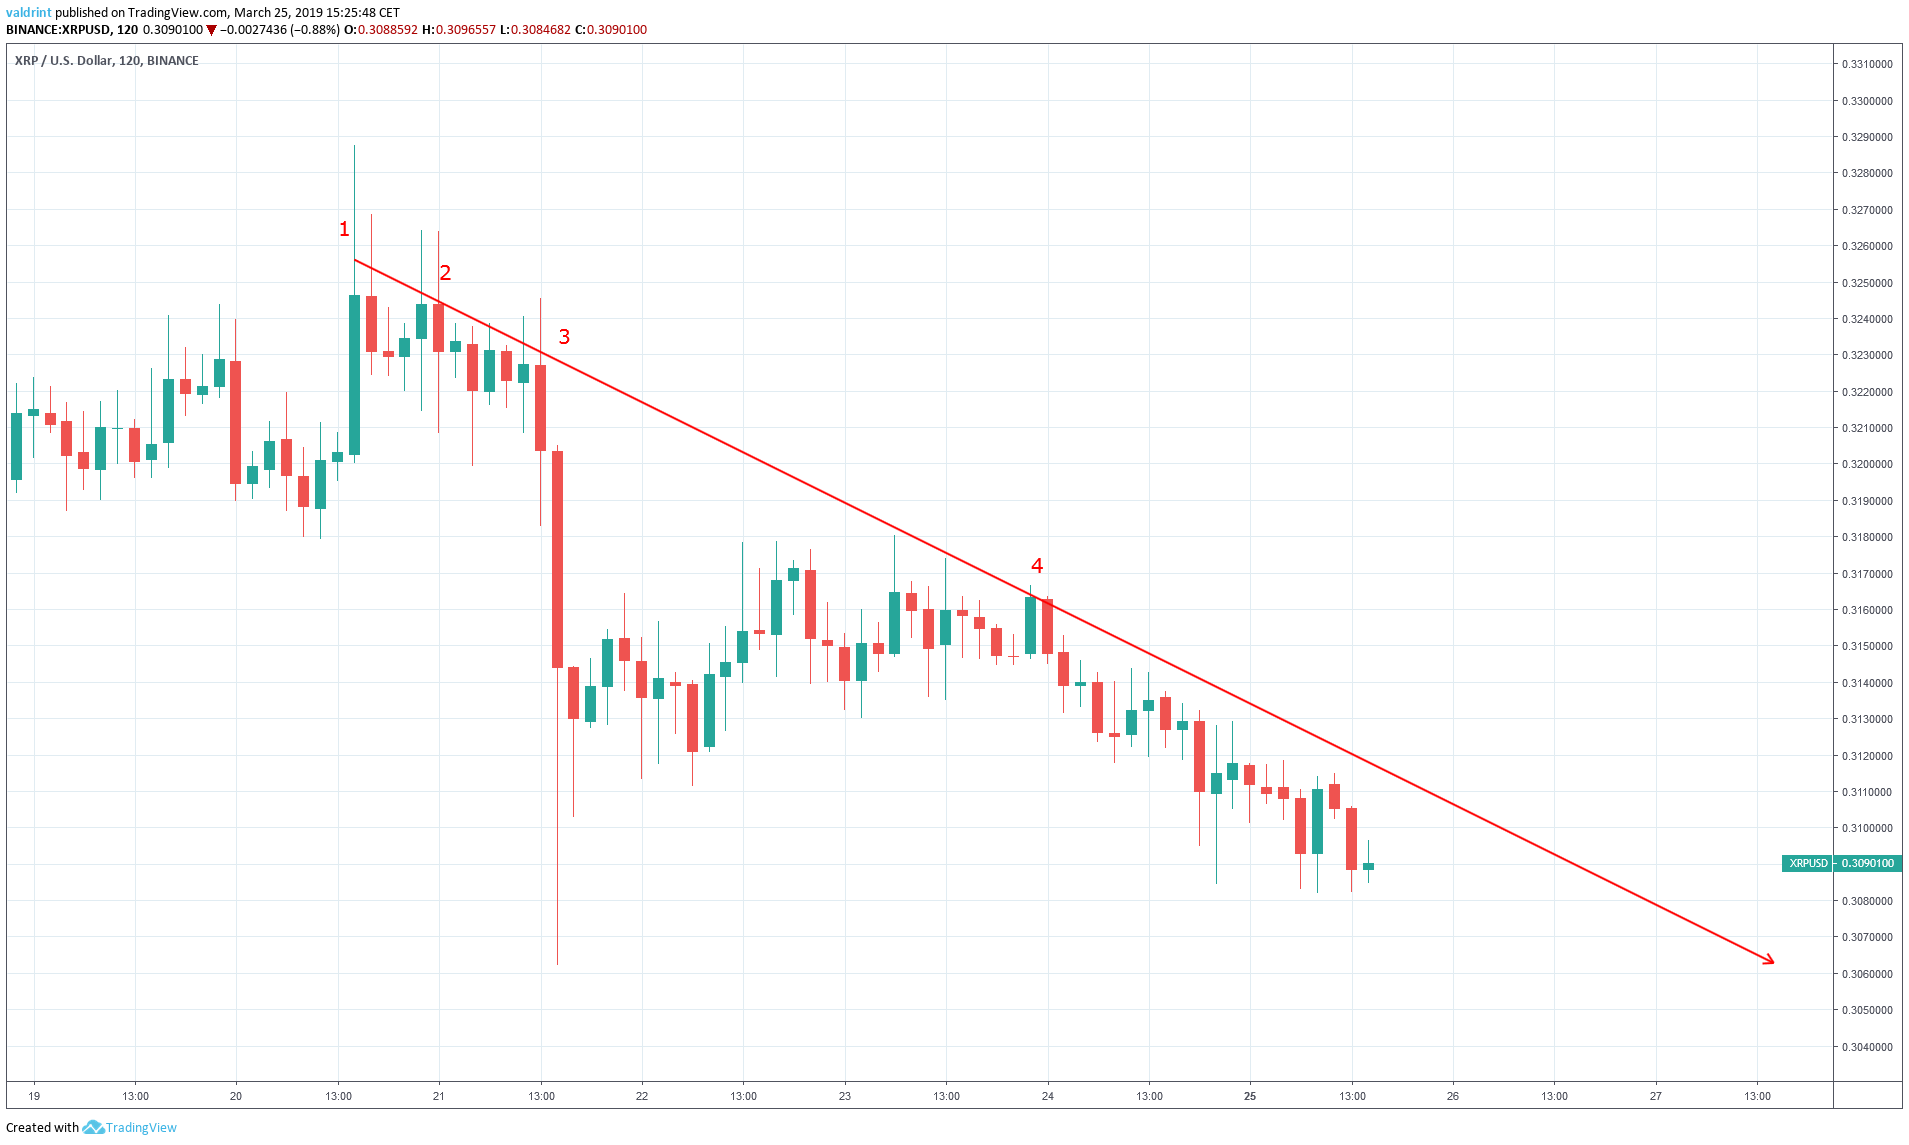 The resistance line acts as a ceiling to price, preventing further upward movement. It theoretically traces the upper limits of the price and measures the rate of decrease.
The price has been decreasing at the same rate as predicted by the resistance line.
Breakouts above the line such as the wick highs of $0.326 and $0.324 on Mar 21 can be considered insignificant since they were not supported by continuous gains.
The price is likely to keep decreasing at the same rate predicted by the line. Taken without other trends or indicators, this suggests continued gradual price losses. However, a reversal may be forthcoming based on deeper analysis.
The resistance line acts as a ceiling to price, preventing further upward movement. It theoretically traces the upper limits of the price and measures the rate of decrease.
The price has been decreasing at the same rate as predicted by the resistance line.
Breakouts above the line such as the wick highs of $0.326 and $0.324 on Mar 21 can be considered insignificant since they were not supported by continuous gains.
The price is likely to keep decreasing at the same rate predicted by the line. Taken without other trends or indicators, this suggests continued gradual price losses. However, a reversal may be forthcoming based on deeper analysis.
Descending Wedge
XRP reached a low of $0.306 on Mar 21. It immediately rebounded and closed at $0.312 on the same day. An upward move was followed by a gradual downward move. Several market cycles were completed along the way with each low being lower than the previous one. Tracing these lows gives us a descending support line: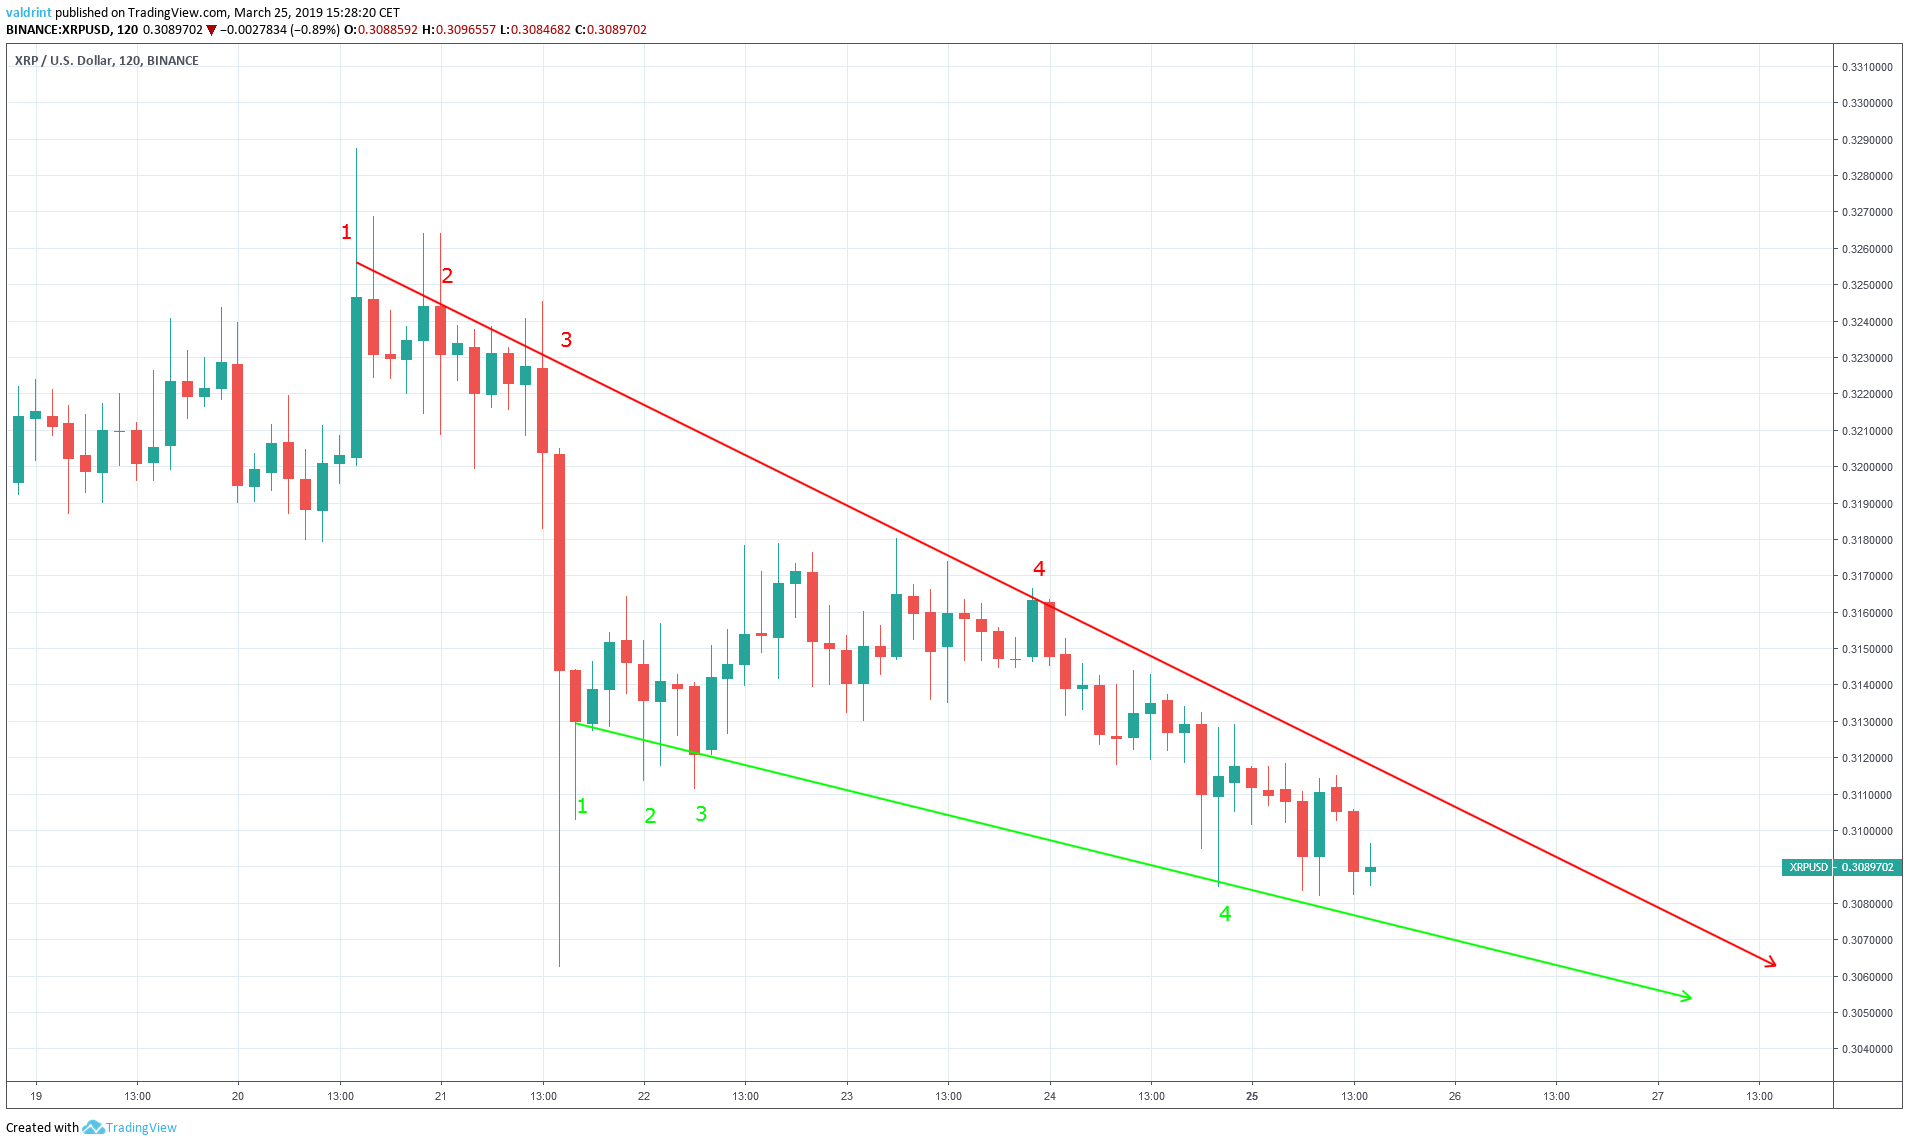 Similar to the resistance line, the support line acts as a floor to price, preventing further downward movement. In the case of XRP, it currently measures the rate of decrease.
The resistance and support lines combine to create a descending wedge. This is a bullish pattern and suggests that price increases are more likely than decreases.
A breakout is possible but it is also possible that XRP may fall back toward support after nearing or touching the resistance.
However, it appears that the wedge will converge by the end of the month. At that point, A breakout above support or breakdown below resistance would become inevitable. The wedge, however, cannot tell us necessarily which to expect.
Incorporating technical indicators into the analysis leads us to believe that a breakout is more likely than a breakdown.
Similar to the resistance line, the support line acts as a floor to price, preventing further downward movement. In the case of XRP, it currently measures the rate of decrease.
The resistance and support lines combine to create a descending wedge. This is a bullish pattern and suggests that price increases are more likely than decreases.
A breakout is possible but it is also possible that XRP may fall back toward support after nearing or touching the resistance.
However, it appears that the wedge will converge by the end of the month. At that point, A breakout above support or breakdown below resistance would become inevitable. The wedge, however, cannot tell us necessarily which to expect.
Incorporating technical indicators into the analysis leads us to believe that a breakout is more likely than a breakdown.
Future Movement
Combining MACD and RSI bullish/bearish divergence with support/resistance essentially predicts price fluctuations. The moving average convergence divergence (MACD) is a trend indicator that shows the relationship between two moving averages (long and short-term) and the price. It is used to measure the strength of a move. The relative strength index (RSI) is an indicator which calculates the size of the changes in price in order to determine oversold or overbought conditions in the market.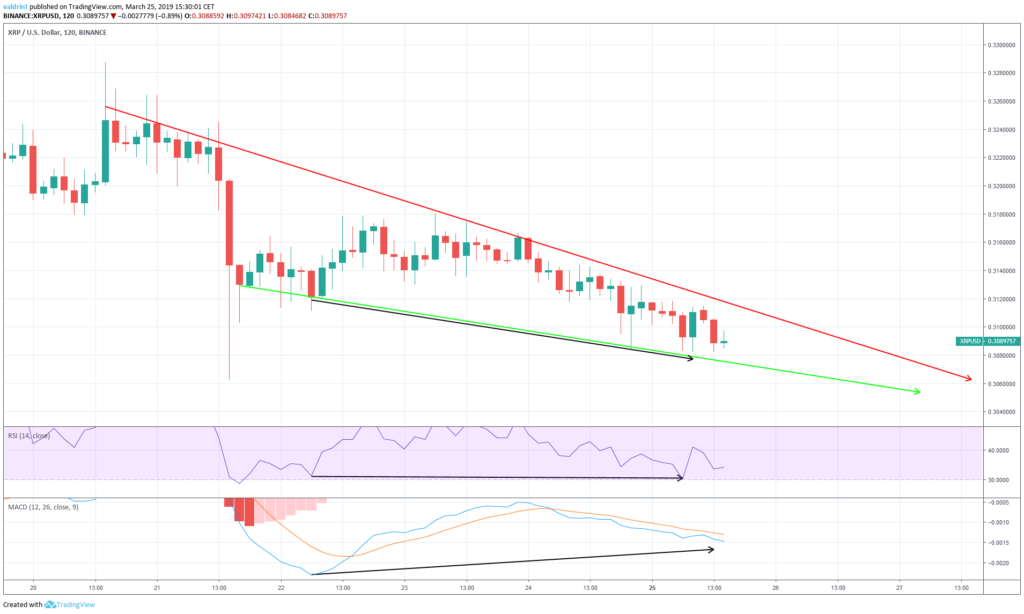 On Mar 22, the price made a low of $0.311. It made another low of $0.308 on Mar 25.
Similarly, the RSI and the MACD made a low on Mar 22. However, the RSI made the same low on Mar 25, while the MACD has generated higher values.
This is known as bullish divergence and often precedes price increases. The possibility of increasing prices becomes more liely if bullish divergence occurs in a bullish pattern. This is the case in XRP which is currently trading within a descending wedge—a bullish pattern.
These indicators lead us to believe that price will increase to the resistance and possibly breakout. Price may, however, return to the support a fifth or possibly sixth time before convergence. We anticipate a breakout before the support and resistance converge; however, a breakout might not be possible until the wedge fully closes.
On Mar 22, the price made a low of $0.311. It made another low of $0.308 on Mar 25.
Similarly, the RSI and the MACD made a low on Mar 22. However, the RSI made the same low on Mar 25, while the MACD has generated higher values.
This is known as bullish divergence and often precedes price increases. The possibility of increasing prices becomes more liely if bullish divergence occurs in a bullish pattern. This is the case in XRP which is currently trading within a descending wedge—a bullish pattern.
These indicators lead us to believe that price will increase to the resistance and possibly breakout. Price may, however, return to the support a fifth or possibly sixth time before convergence. We anticipate a breakout before the support and resistance converge; however, a breakout might not be possible until the wedge fully closes.
Resistance and Support
The price of XRP on Binance is analyzed at four-hour intervals from Feb 24 to Mar 22 to better visualize future possible resistance and support levels. Resistance and support lines are created when the price revisits the same level several times.
There are three visible resistance areas, near $0.313, $0.317 and $0.324. The final resistance area coincides with the top of the wedge. This means that in the case of a breakout, they would provide likely reversal areas. Based on our analysis, it is likely that the price will eventually reach one of these areas.
The closest support area is found near $0.305, coinciding with the end of the wedge. If the price keeps trading until a point of convergence between resistance and support, it will reach this area.
Resistance and support lines are created when the price revisits the same level several times.
There are three visible resistance areas, near $0.313, $0.317 and $0.324. The final resistance area coincides with the top of the wedge. This means that in the case of a breakout, they would provide likely reversal areas. Based on our analysis, it is likely that the price will eventually reach one of these areas.
The closest support area is found near $0.305, coinciding with the end of the wedge. If the price keeps trading until a point of convergence between resistance and support, it will reach this area.
Summary of Analysis
Based on this analysis, the price of XRP is likely to trade inside the confines of the descending wedge before eventually breaking out. If the price keeps trading inside the wedge until a point of convergence occurs then breaks out, the prediction will be fully validated. A breakdown below support will invalidate this prediction. Do you think the price of XRP will eventually break out from the wedge? Let us know in the comments below.Click Here To Read More About xrp!
Disclaimer: This article is not trading advice and should not be construed as such. Always consult a trained financial professional before investing in cryptocurrencies, as the market is particularly volatile.Disclaimer
In line with the Trust Project guidelines, this price analysis article is for informational purposes only and should not be considered financial or investment advice. BeInCrypto is committed to accurate, unbiased reporting, but market conditions are subject to change without notice. Always conduct your own research and consult with a professional before making any financial decisions. Please note that our Terms and Conditions, Privacy Policy, and Disclaimers have been updated.

Valdrin Tahiri
Valdrin discovered cryptocurrencies while he was getting his MSc in Financial Markets from the Barcelona School of Economics. Shortly after graduating, he began writing for several different cryptocurrency related websites as a freelancer before eventually taking on the role of BeInCrypto's Senior Analyst.
(I do not have a discord and will not contact you first there. Beware of scammers)
READ FULL BIO
Sponsored
Sponsored